
Bitcoin Cash [BCH] witnessed a 30% surge in daily trading volume on Monday, August 10. It is possible that quiet volume trends over the weekend shifted toward more active market participant engagement.
However, BCH fell 1.2% over the past 24 hours while Open Interest declined 2.26%. The combination suggested traders were reducing leveraged exposure despite the increase in spot trading activity.
Earlier, it was reported that the Cash 3.0 conference did not give Bitcoin Cash sufficient upward momentum. The long-term trend remains bearish, and the overhead supply zone at $250-$280 remains intact.
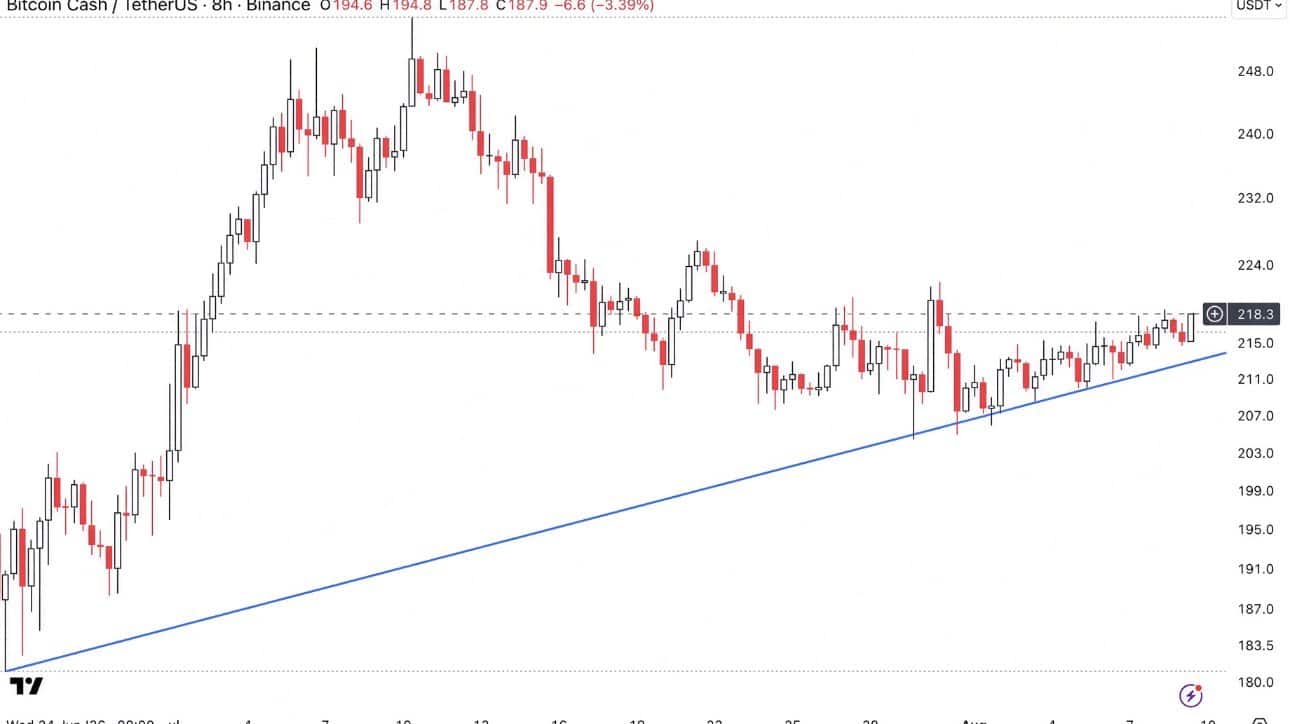
Analyst Cryptid Crypto plotted a rising trendline support, stretching back to June 24, that has still been defended.
So long as the altcoin is trading above this support, there’s a chance it can rise above the $224 local resistance and above $232, the analyst argued.
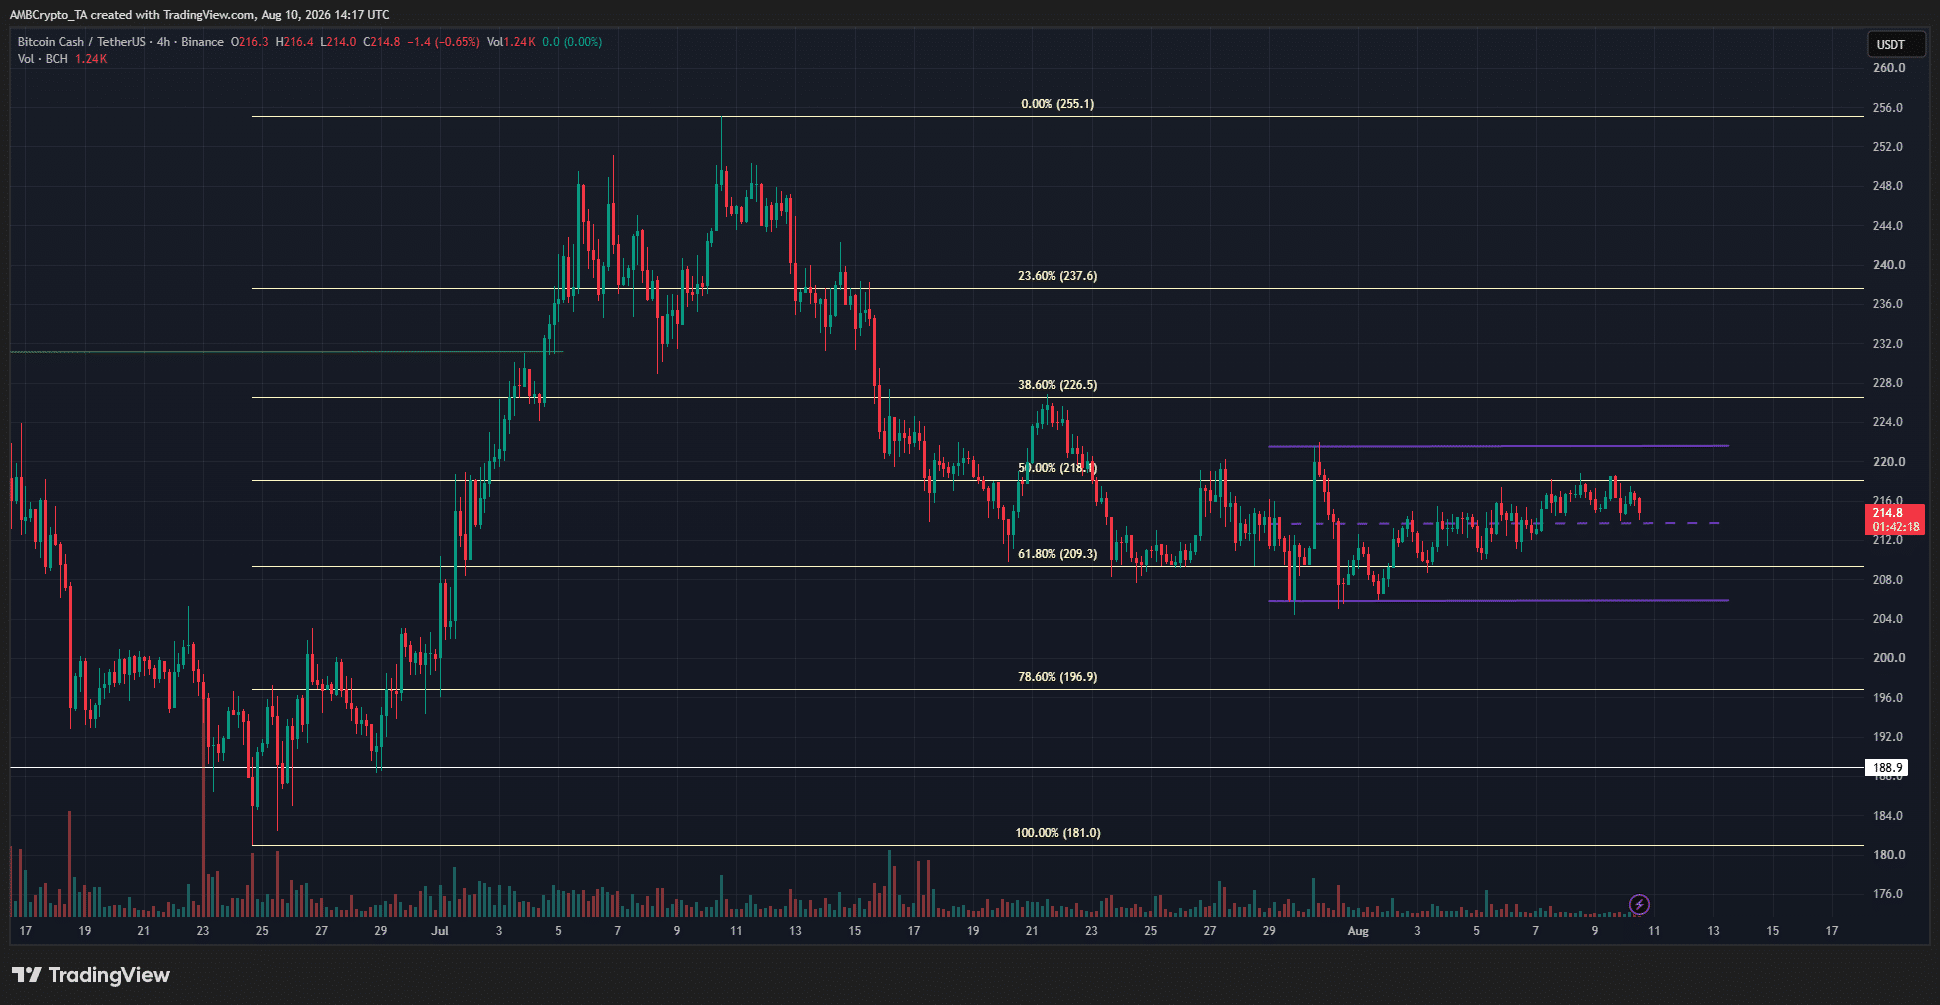
Though the structure on the 4-hour timeframe was bullish, strong demand was missing in recent weeks. The token has been consolidating between $206 and $221 since the end of July.
The path upward is filled with obstacles, but it is likely that the $232 target is met in the coming days and weeks.
Clues from Bitcoin Cash liquidation levels
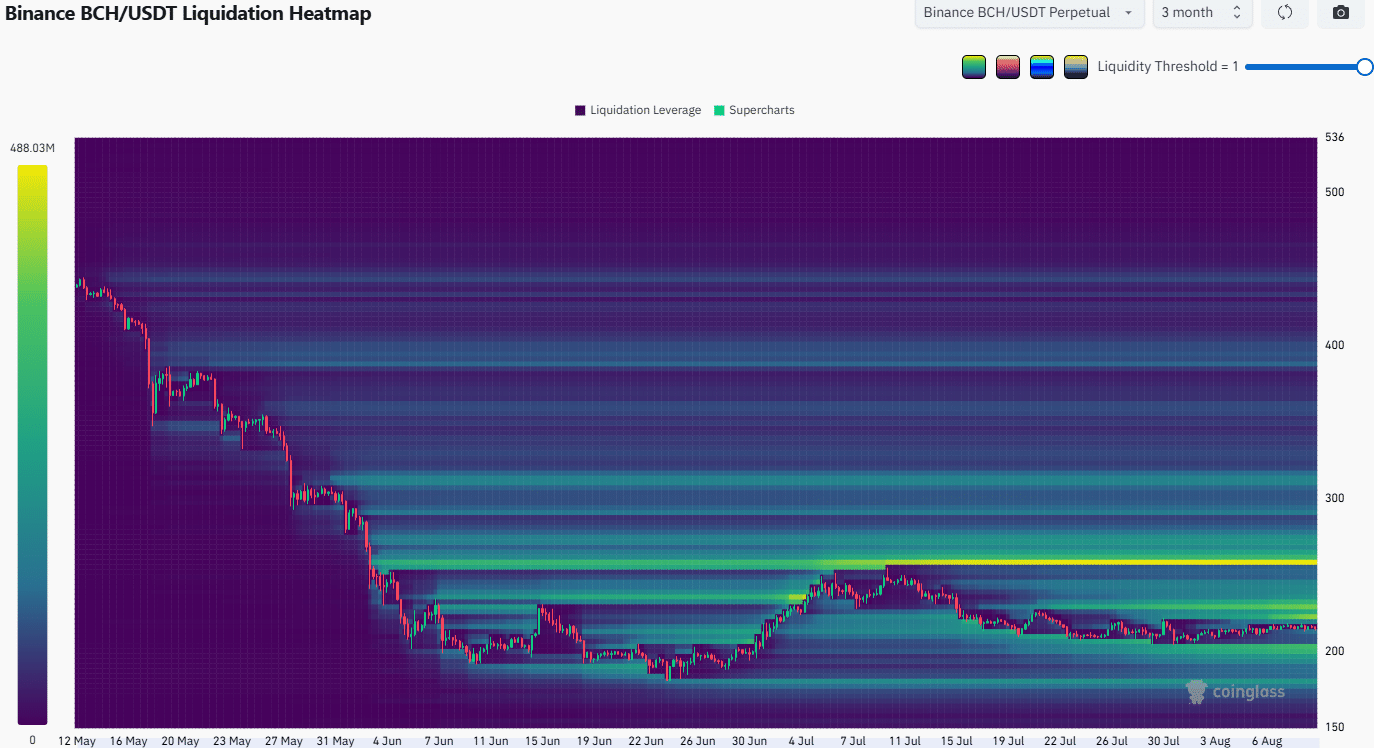
The Bitcoin Cash price action compression around the $214 mark over the past two weeks has resulted in an increasing amount of short liquidation levels building up overhead. The $221-$231 area, in particular, is a nearby magnetic zone to watch out for.
Further north, the $257 area had a much denser cluster of short liquidations. It is possible a sweep of this area would occur before the next bearish long-term move.
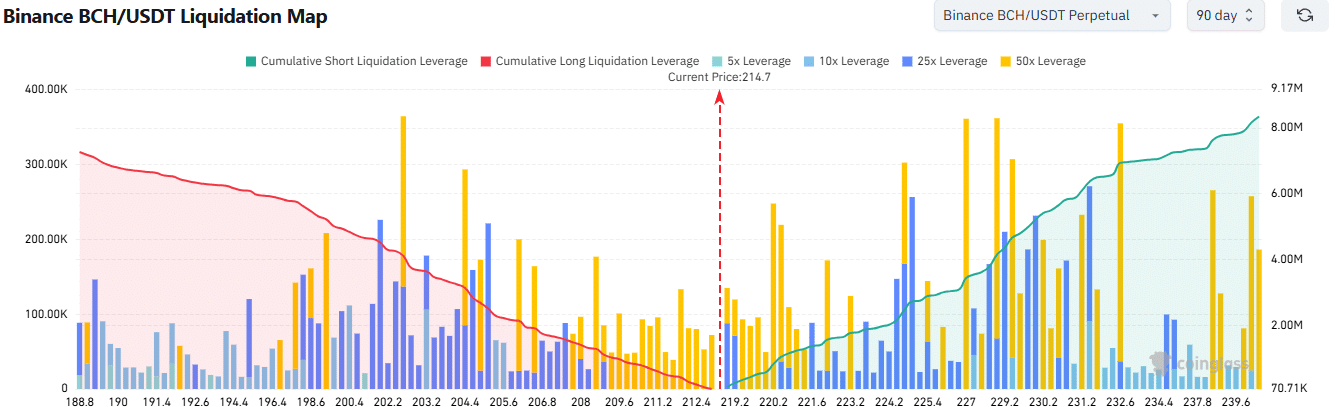
The liquidation map showed that the cumulative short liquidation leverage was higher than the long leverage. The high-leverage positions and their liquidations overhead presented an attractive target for the price in the short-term.
Therefore, a move to $232 in the coming days is feasible.
It remains to be seen if the bears take over immediately after, or wait for a sweep of the $257 magnetic zone too.
Final Summary
- The Bitcoin Cash price action has been constrained within a lower timeframe range over the past two weeks.
- Clues from the liquidation levels data highlighted why a short-squeeze remains the likely path forward.