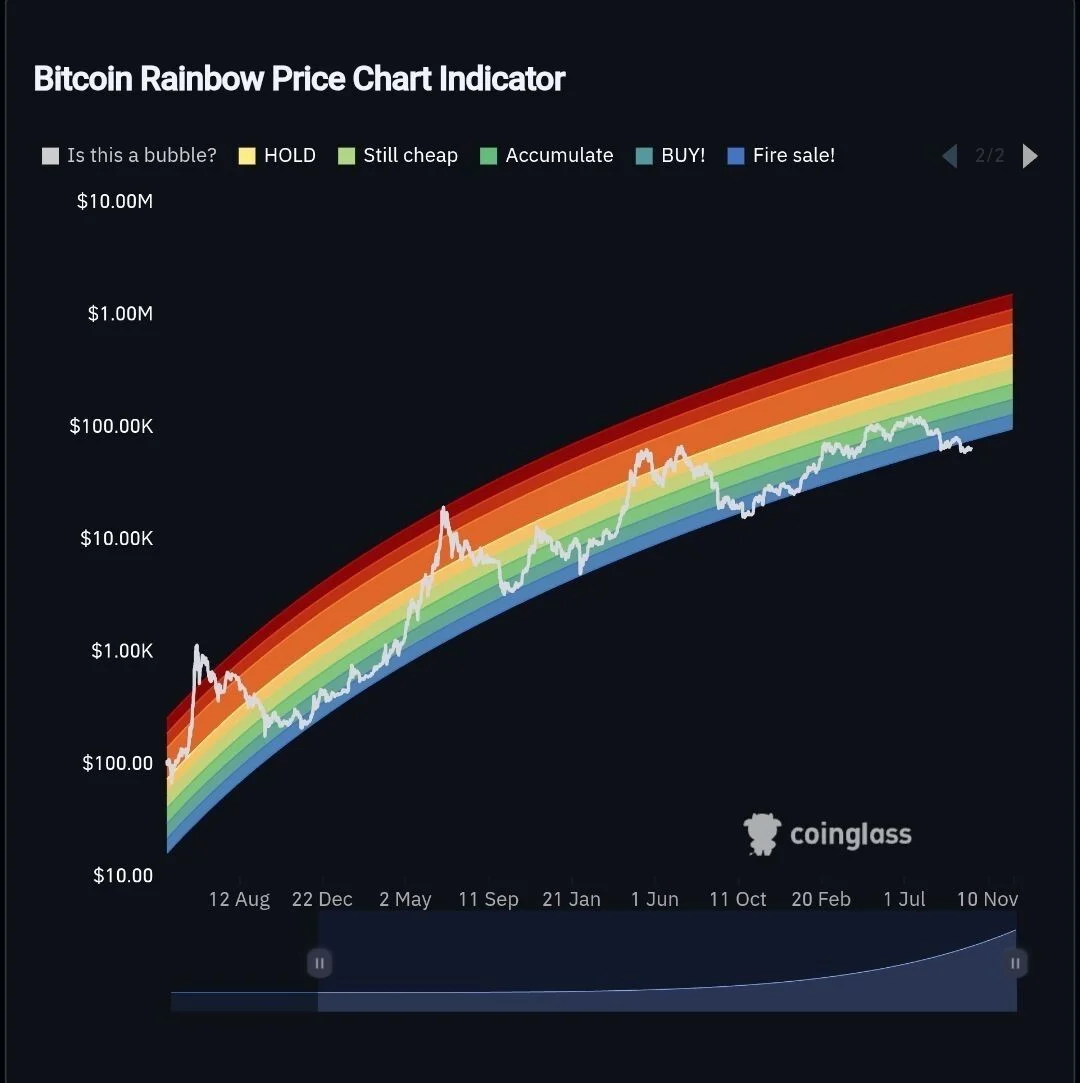
Bitcoin’s [BTC] current valuation sits at the lowest end of the rainbow model, extending a decline that has moved the price below its historical trend. The metric normally categorizes the price of BTC based on valuation bands using the relationship of market price to long-term growth trend.
As the price falls further below that trend, Bitcoin moves through progressively cheaper bands, ending with the “fire sale” zone. At press time, BTC traded 66% below the $186,700 model price, thus placing it beneath that lowest band.
Supporting this deviation, the volatility-adjusted Z-Score has fallen to -2.293, below the 2022 low of -1.979. Simply, this indicates there is a greater chance of discount when considering differences in volatility across cycles.
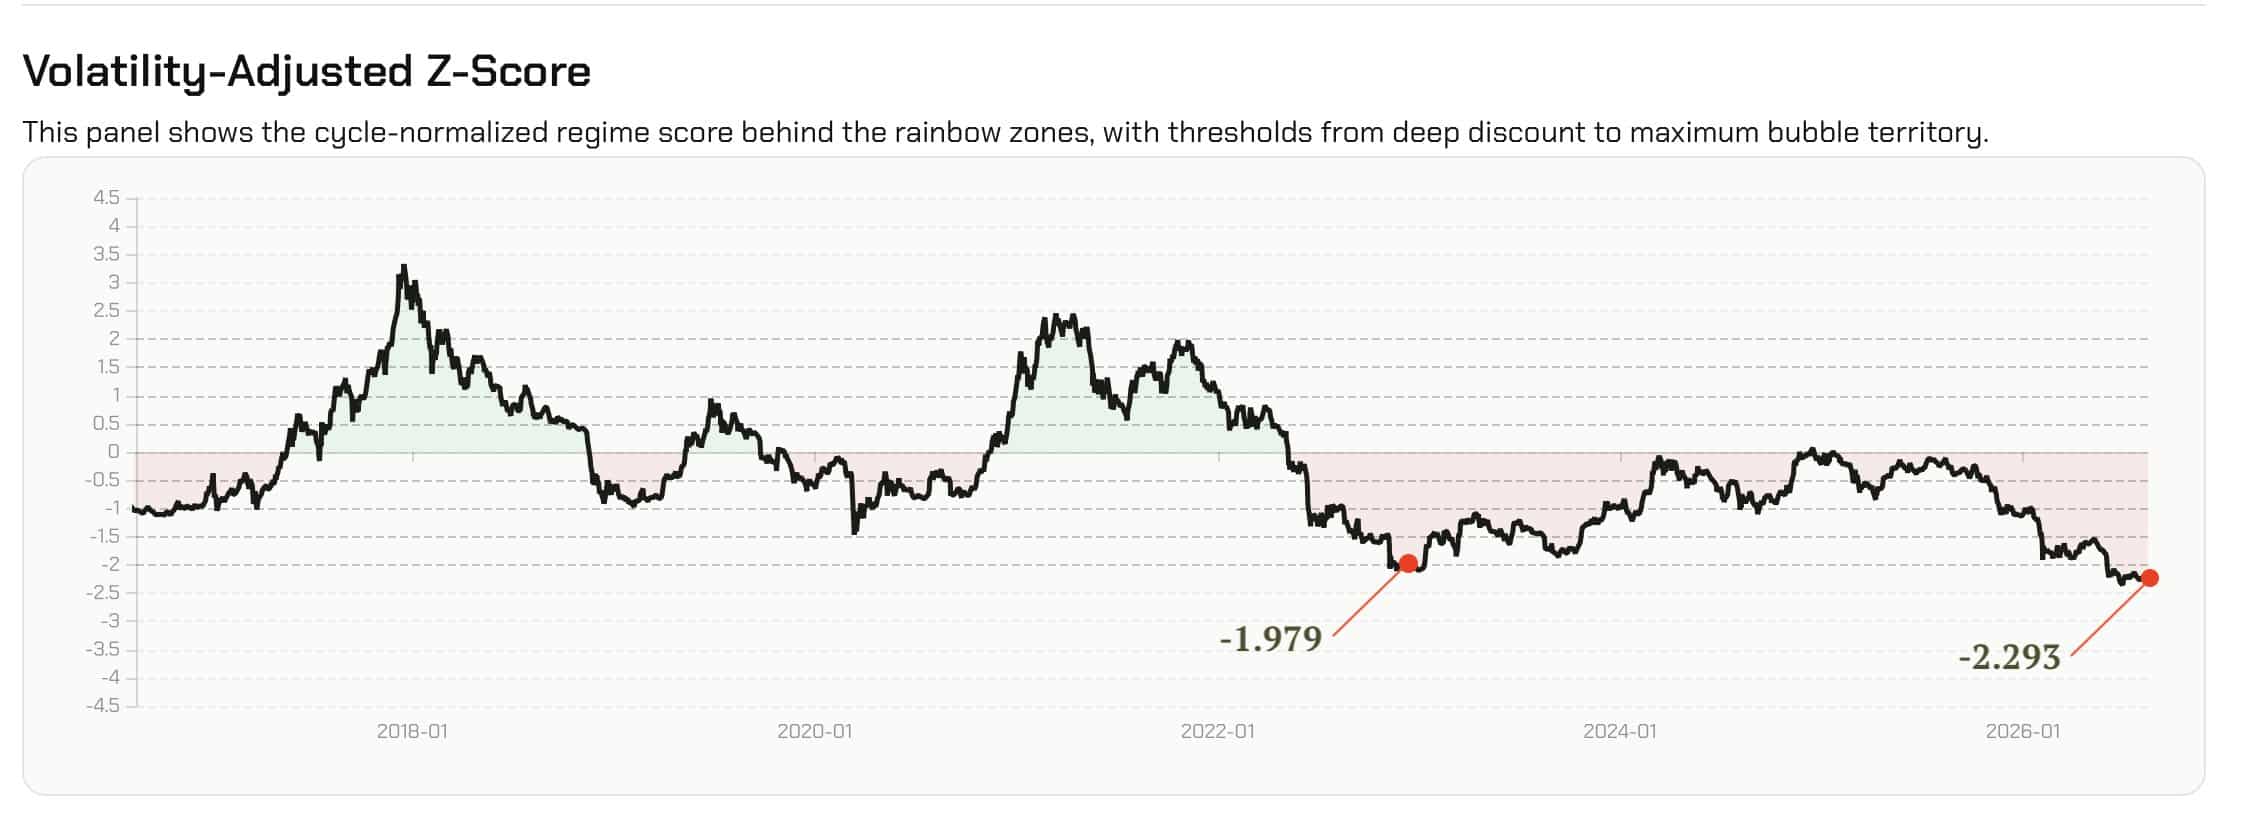
Historically, similar extremes have aligned with accumulation periods. Yet, despite that, they do not technically identify the final bottom. However, a recovery above the lowest band would instead indicate that Bitcoin is beginning to close its valuation gap.
Bitcoin cycle nears previous bottoming windows
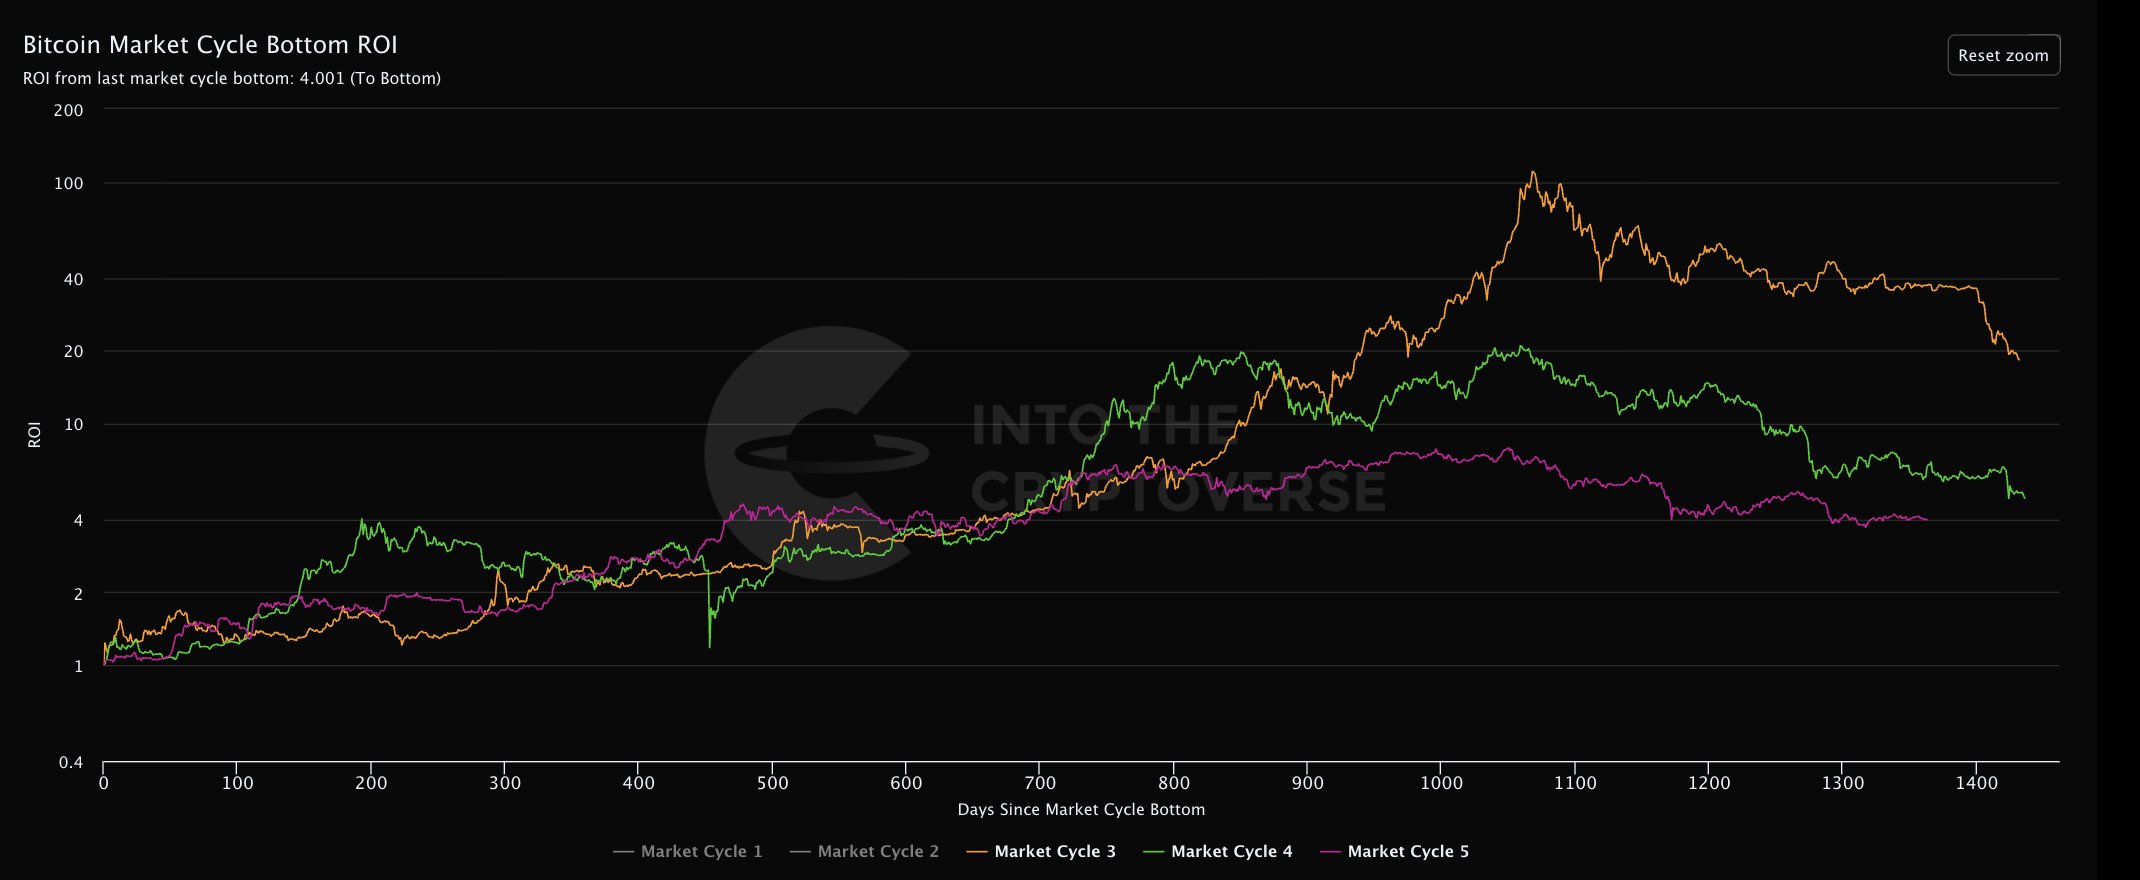
While the Rainbow model shows where Bitcoin sits relative to its long-term valuation trend, cycle duration provides a different perspective. The current cycle has reached day 1,363, while the previous two recorded bottoms around days 1,432 and 1,436.
That said, this places BTC at roughly 69–73 days from matching those cycle lengths even though valuation conditions remain different. Meanwhile, Bitcoin has declined 49–50% from its $126,000 October peak, while Market Value to Realized Value (MVRV) remains near 1.2.
That reading stays above the 1.0 level associated with deeper valuation resets. In simple words, this implies that Bitcoin has become cheaper. Yet, MVRV suggests valuations have not fallen as deeply as during some previous major bottoms.
Hence, the timing increasingly resembles previous cycle durations, while valuation and cost-basis measures have yet to reach comparable levels.
Bitcoin decouples from rising global M2
Although cycle duration is moving in line with the previous bottoming period, the broad liquidity signal no longer follows the same historical relationship. Through 2024 and 2025, Bitcoin and global M2 largely moved higher together before separating sharply in 2026.
Global M2 continued rising toward 144,946, while BTC declined toward $62,795, creating a widening divergence. This shift also appears in the 24-month correlation, which has dropped into negative territory, even though the long-term correlation remains at 0.86.
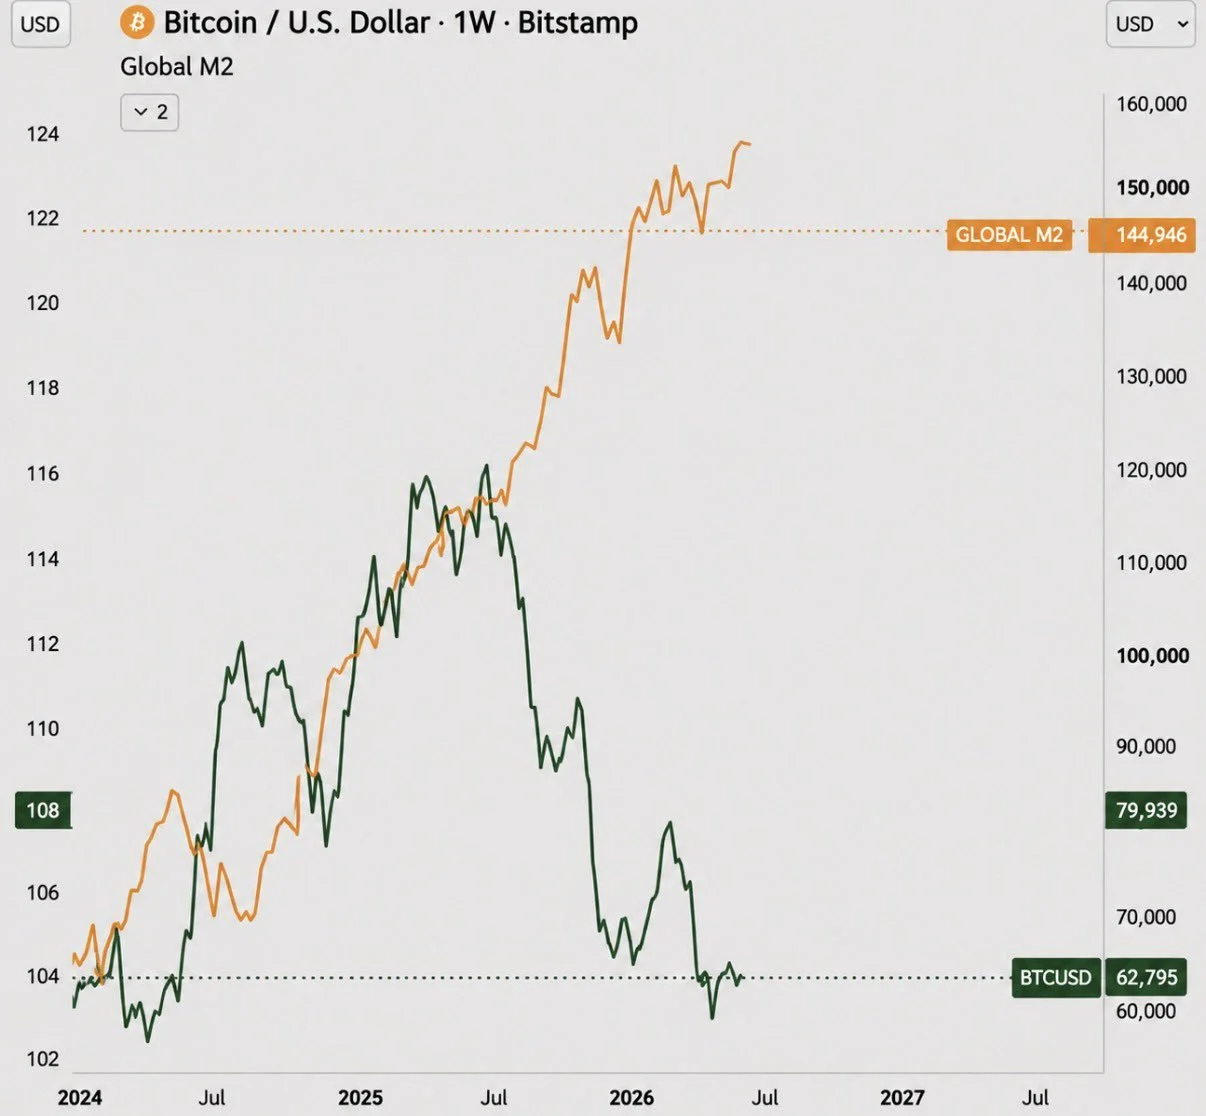
Hence, the increase in liquidity provides little or no directional support for the price of Bitcoin compared to the historical trends. Therefore, that shift weakens M2 as confirmation for the cycle-timing comparison.
A renewed positive correlation would strengthen that confirmatory role. Conversely, further divergence would decrease the confirmatory role of cycle timing comparisons.