

Artificial intelligence-linked blockchain, Bittensor [TAO], has seen one of the most significant rises in the past day, with the asset surging more than 10% within this period.
The chart analysis shows that the price could see further gains if TAO repeats the gains from previous fractal patterns. As it stands, TAO has just reacted off a key support level on the chart between $211.7 and $215.4.
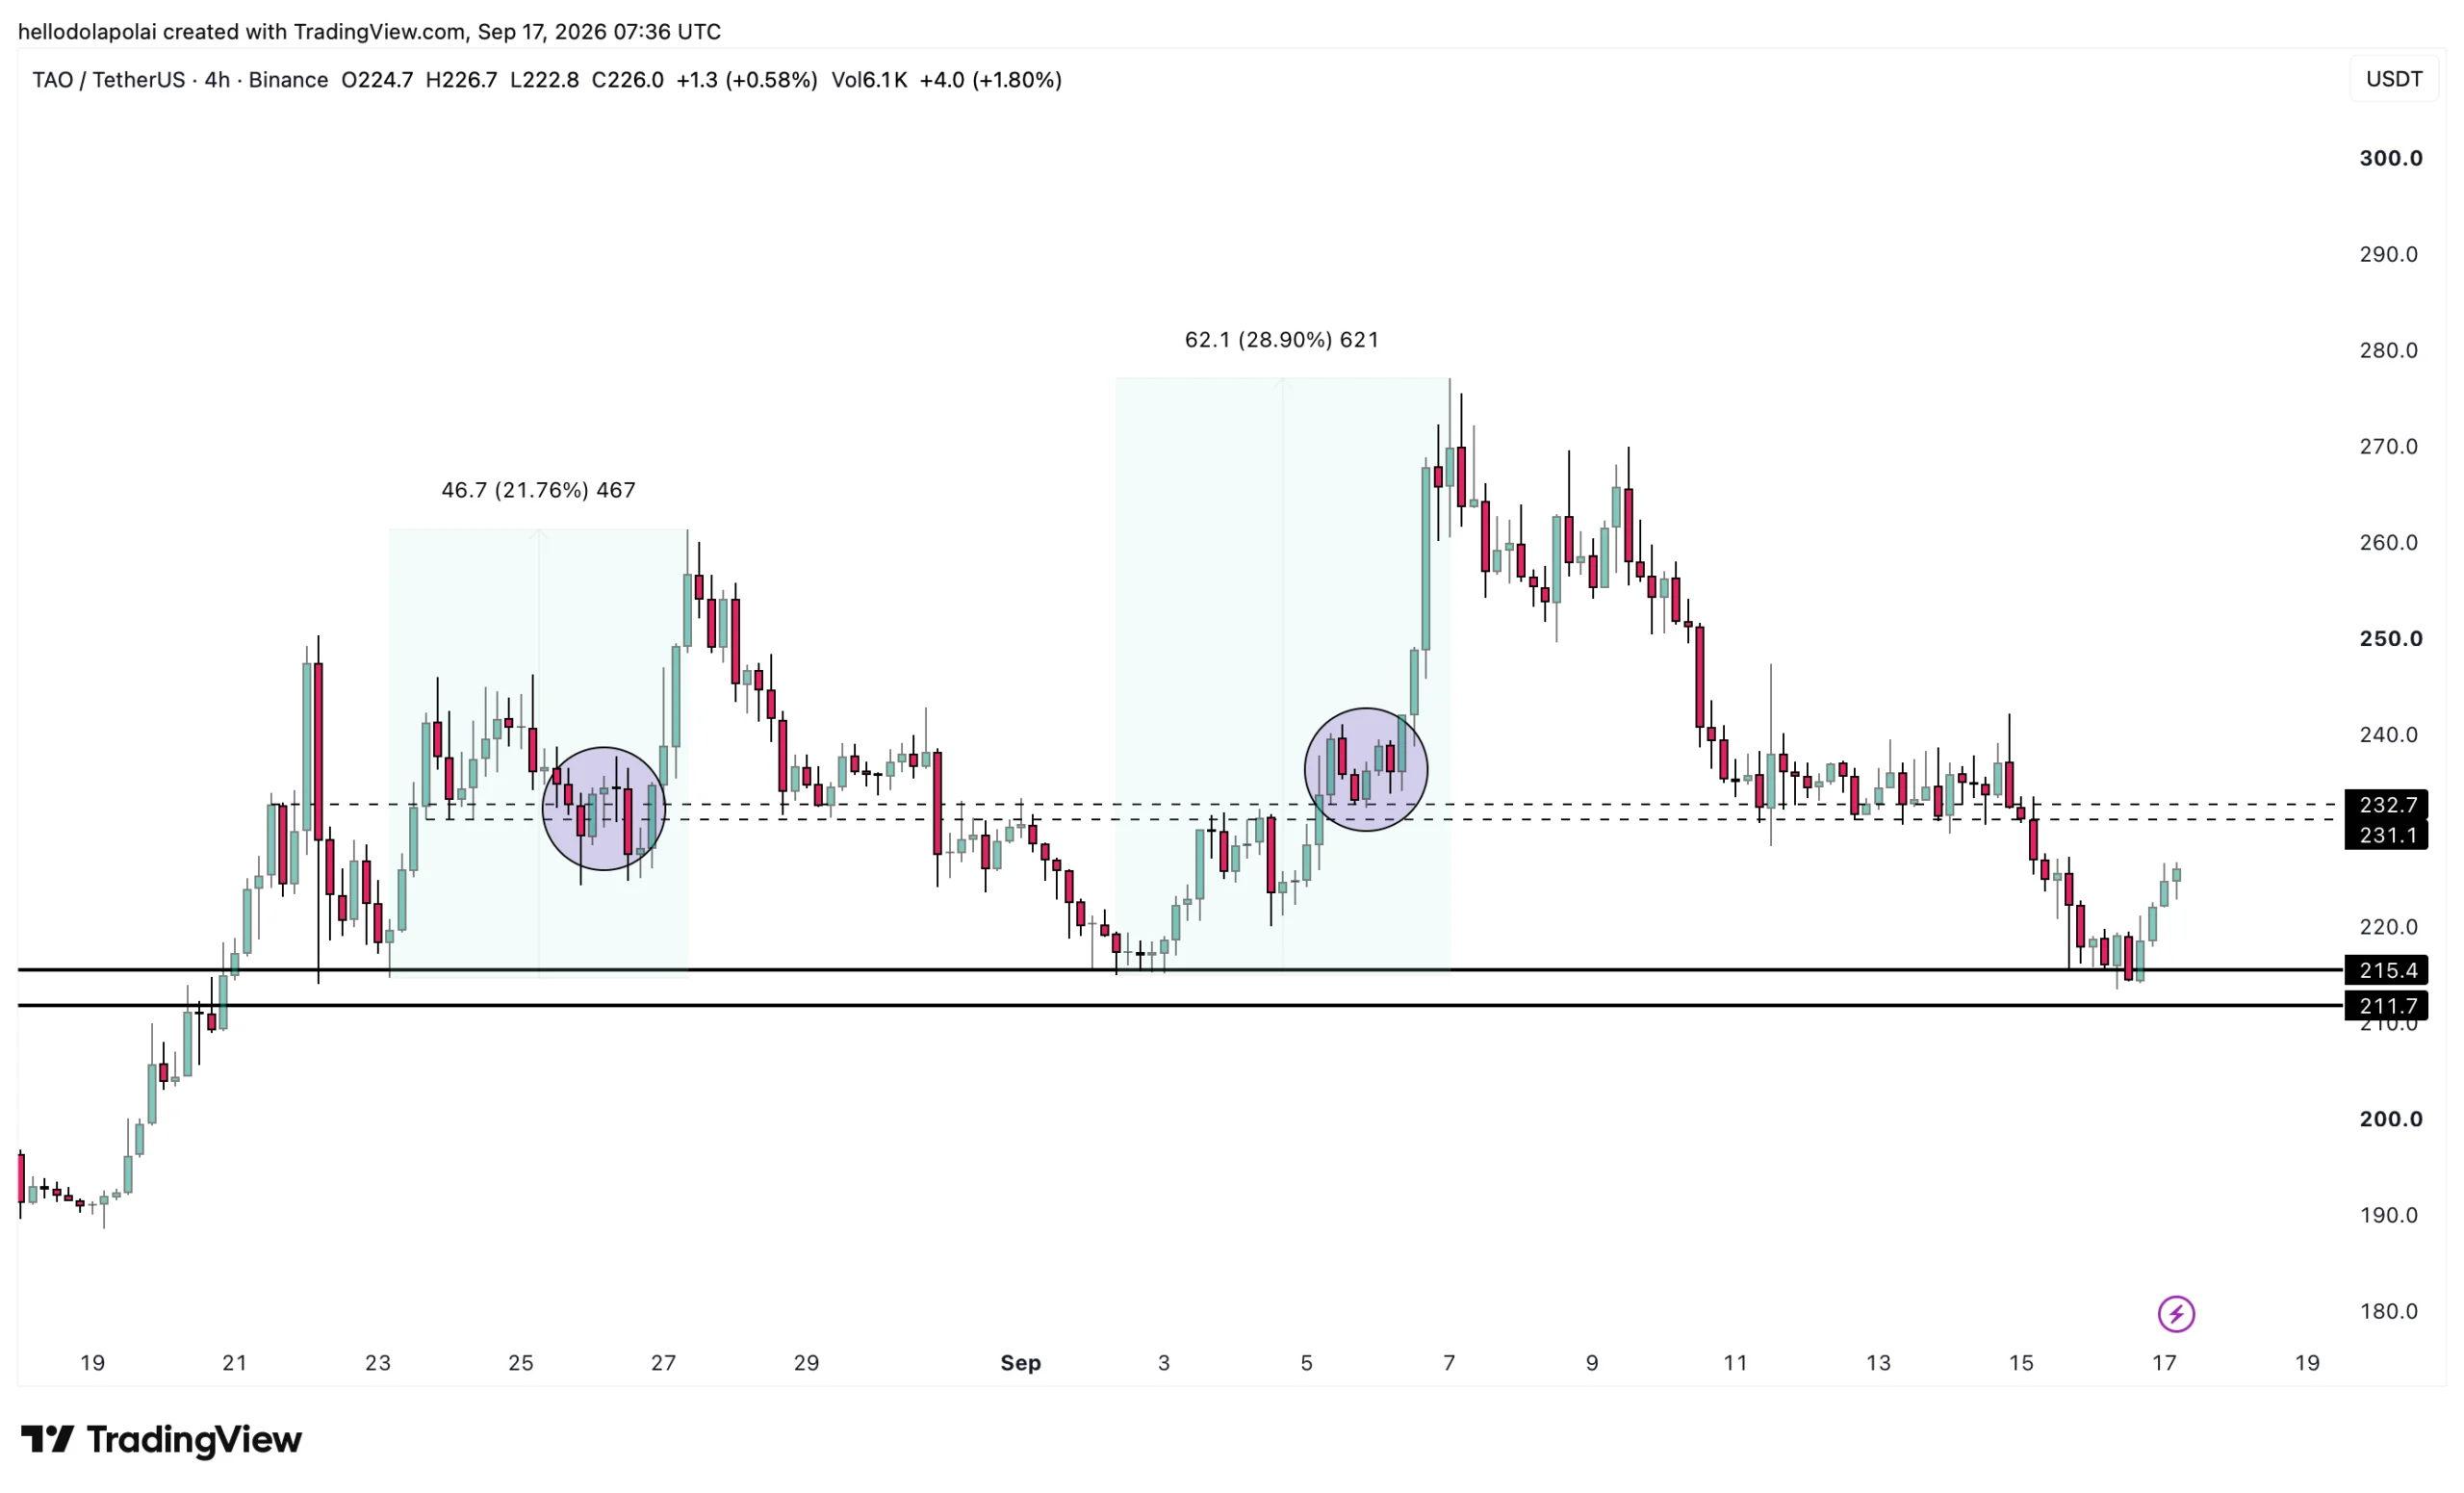
This level has acted as a key catalyst for a major rally on two separate occasions on the chart, with an average gain of 25.33%, according to data from TradingView, a gain that TAO could replicate this time around.
Notably, one major hurdle price has to overcome ahead of establishing this near-term gain would be the resistance level between $231.1 and $232.7, where price tends to consolidate before making a final upswing.
If the gains continue and strong demand supports the momentum, TAO could reclaim the $250 to $270 region on the chart.
Is demand backing the rally?
Indicator analysis shows that demand for TAO isn’t on the high side yet and hasn’t fully given a bullish confirmation signal.
The Bull Bear Power, an indicator that measures whether there are more bulls or bears in the market, shows that the former is more dominant.
The histogram, which tracks this, remains in the red, which suggests that investors are still actively selling their holdings.
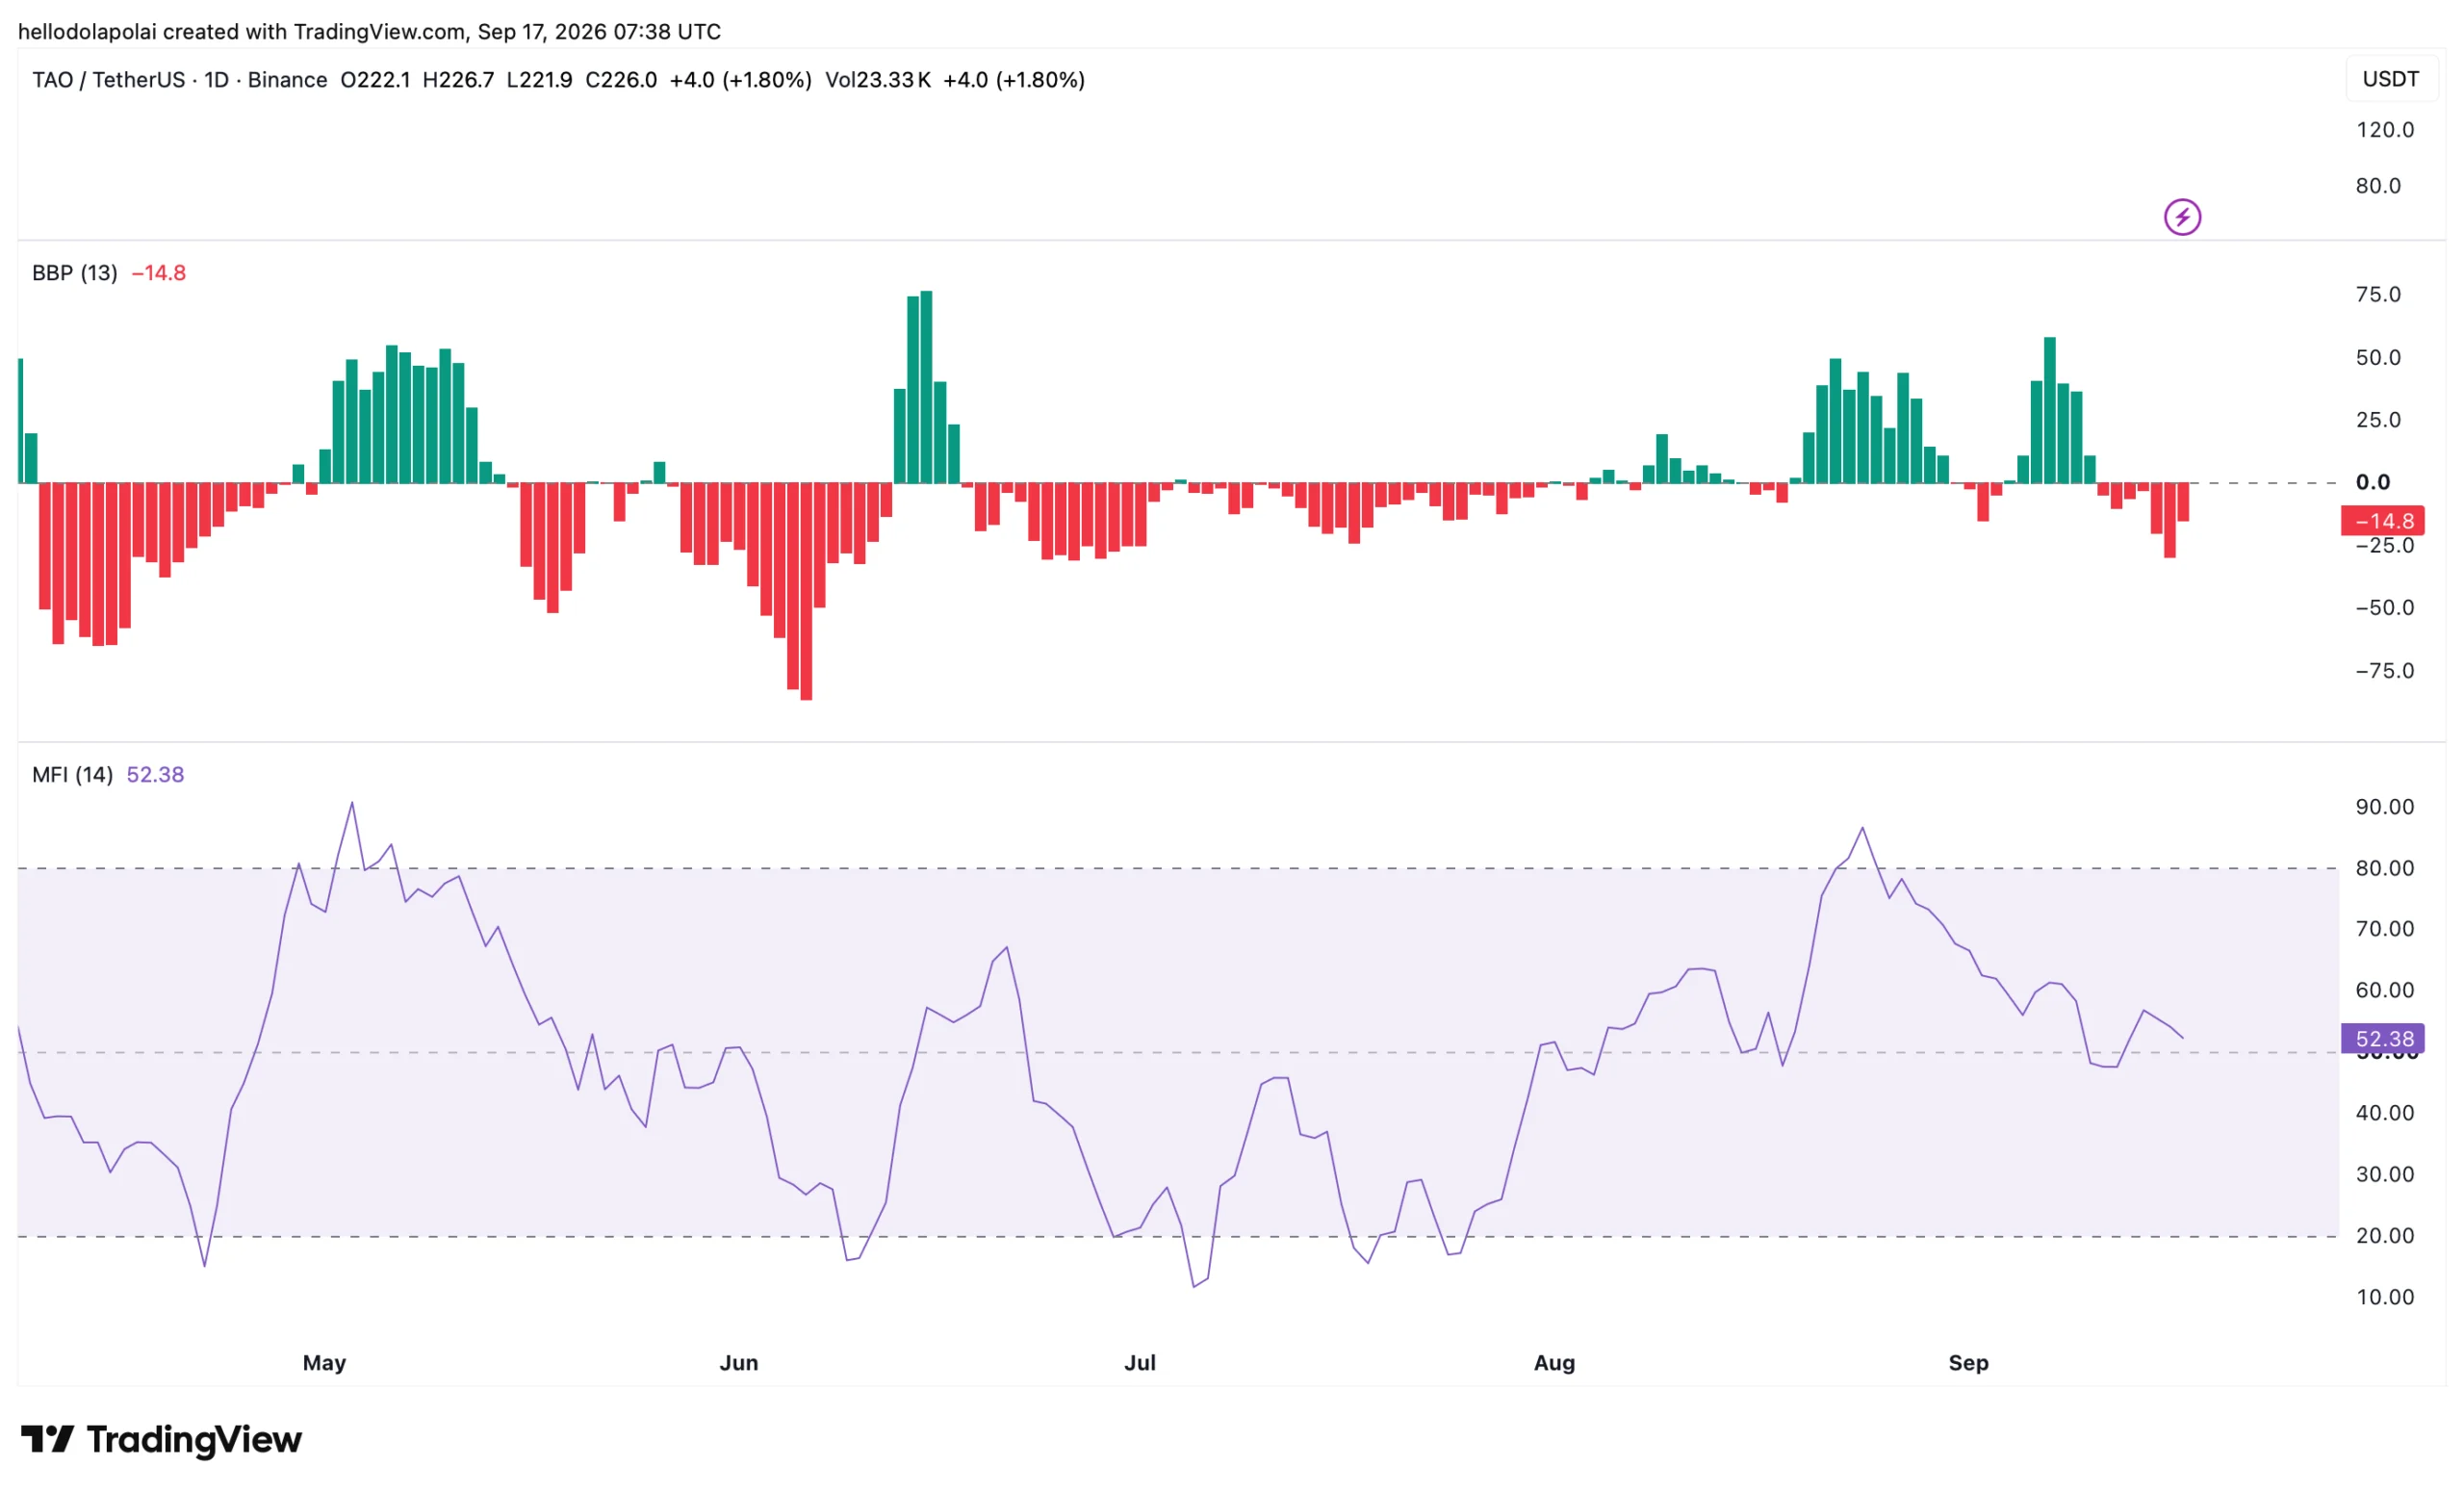
In addition to this outlook is the Money Flow Index (MFI), which tracks the inflow and outflow of capital into an asset, showing that there’s been more outflow in the market, dropping to around 52.88 while the indicator is trending downward.
Should the MFI drop below the 50 mark, it would confirm that there’s been more selling in the market and that TAO risks witnessing a broader decline, as it implies that capital is shrinking and more distribution is taking place.
These bearish signals from the indicators, however, put the potential for a rally, as seen on the chart, at a slimmer chance.
Spot and perp flows raise caution
The Spot Netflow, which measures accumulation or distribution of an asset across cryptocurrency exchanges, suggests that there’s been a flip.
In the past 24 hours, the Spot netflow has remained positive in the market, with a netflow of $24,520, which is a complete flip from the previous day’s performance that had stayed highly negative.
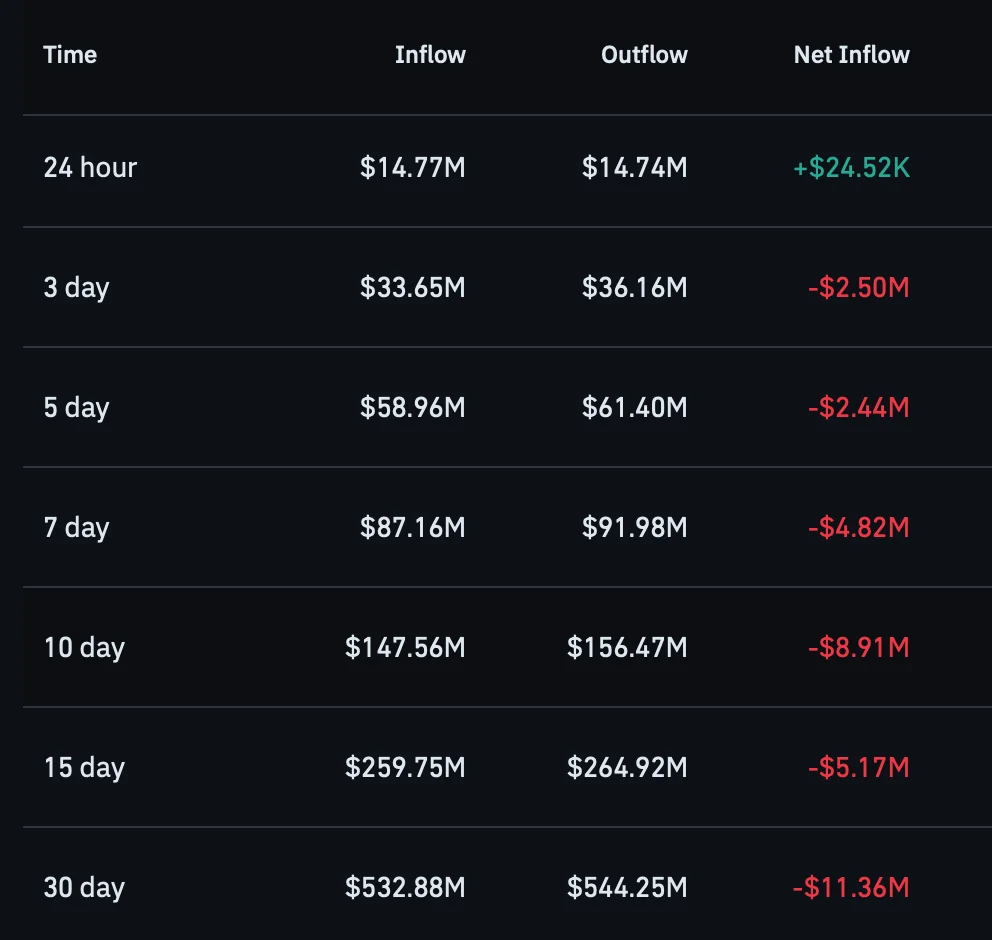
For context, a negative netflow implies that more assets are moving off exchanges into private wallets, suggesting accumulation, while a positive netflow suggests more selling across exchanges.
Additionally, the perpetual flow of capital in the market shows that there’s been a flip in the Funding Rate as well, which has turned negative with a reading of -0.0006% at the time of writing, suggesting that investors now have more short positions than long positions open.
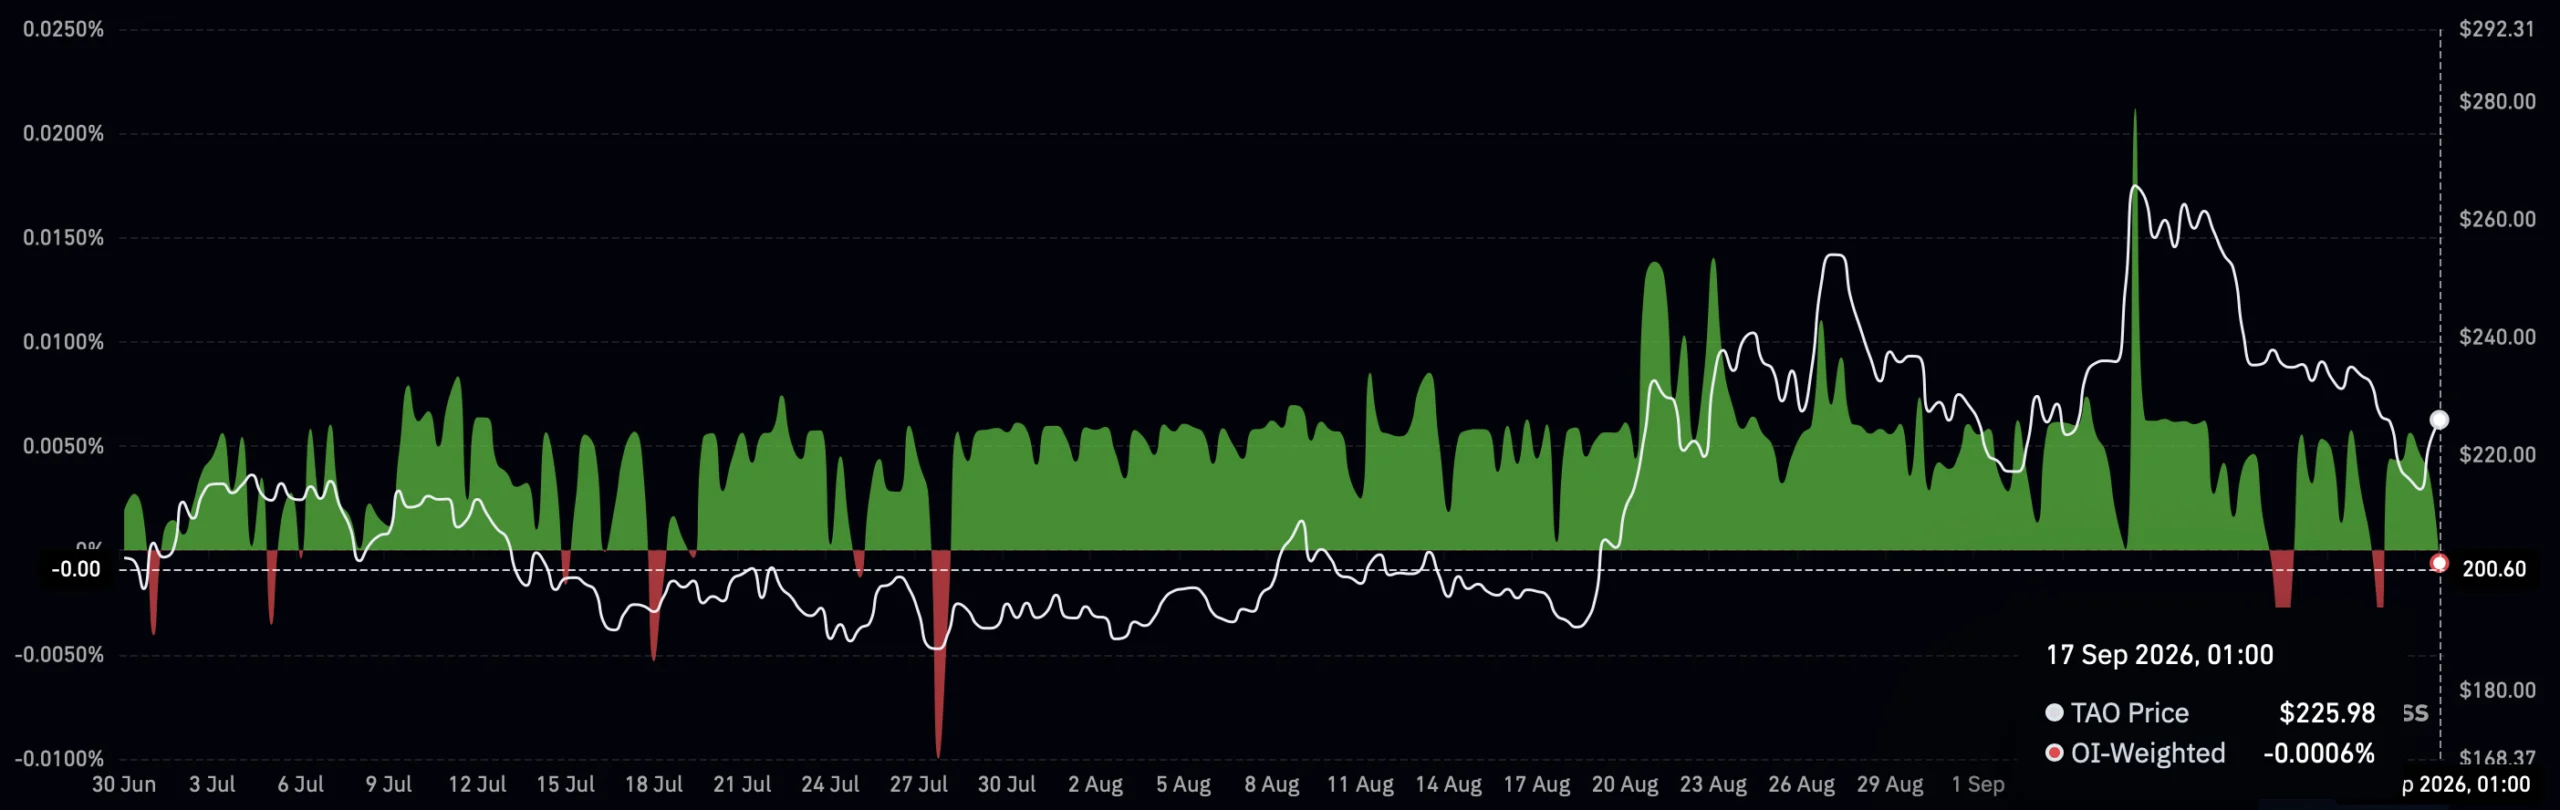
The perpetual and Spot flows indicate that traders should be more cautious now, more than ever, as the chances that the asset risks a decline are on the higher side.
Final Summary
-
TAO surged 45% in 24 hours after reacting from the $211.7–$215.4 support zone, with the pattern pointing to potential gains toward $250–$270.
-
A weakening Money Flow Index and negative Funding Rate show that demand has yet to fully support the rally, leaving TAO exposed to further downside.

![Why is Lighter [LIT] up 18%? Circle Arc DEX integration, whale buying and more...](https://moneyvests.com/wp-content/uploads/2026/09/Why-is-Lighter-LIT-up-18-Circle-Arc-DEX-integration-218x150.png "Why is Lighter [LIT] up 18%? Circle Arc DEX integration, whale buying and more…")
