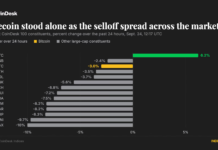
The Graph [GRT] has shed 8.5% in the past 24 hours as Bitcoin [BTC] faced a correction from $87.4k to $83k. Yet, over the past week, the altcoin has rallied 37.7%. The Altcoin Index was at 51 at the time of writing.
Tether Dominance has fallen from 8.5% in mid-August to 6.52% at the time of writing. Notably, Bitcoin Dominance has declined in September, too, pointing to capital flow into altcoins and a risk-on short-term outlook from crypto market participants.
As a result of this bullish sentiment, GRT crypto has made sizable gains since forming the swing low at $0.013 in August. In five weeks, GRT crypto has rallied 90% from the previous month’s swing low.
Has GRT crypto’s long-term trend shifted bullishly?
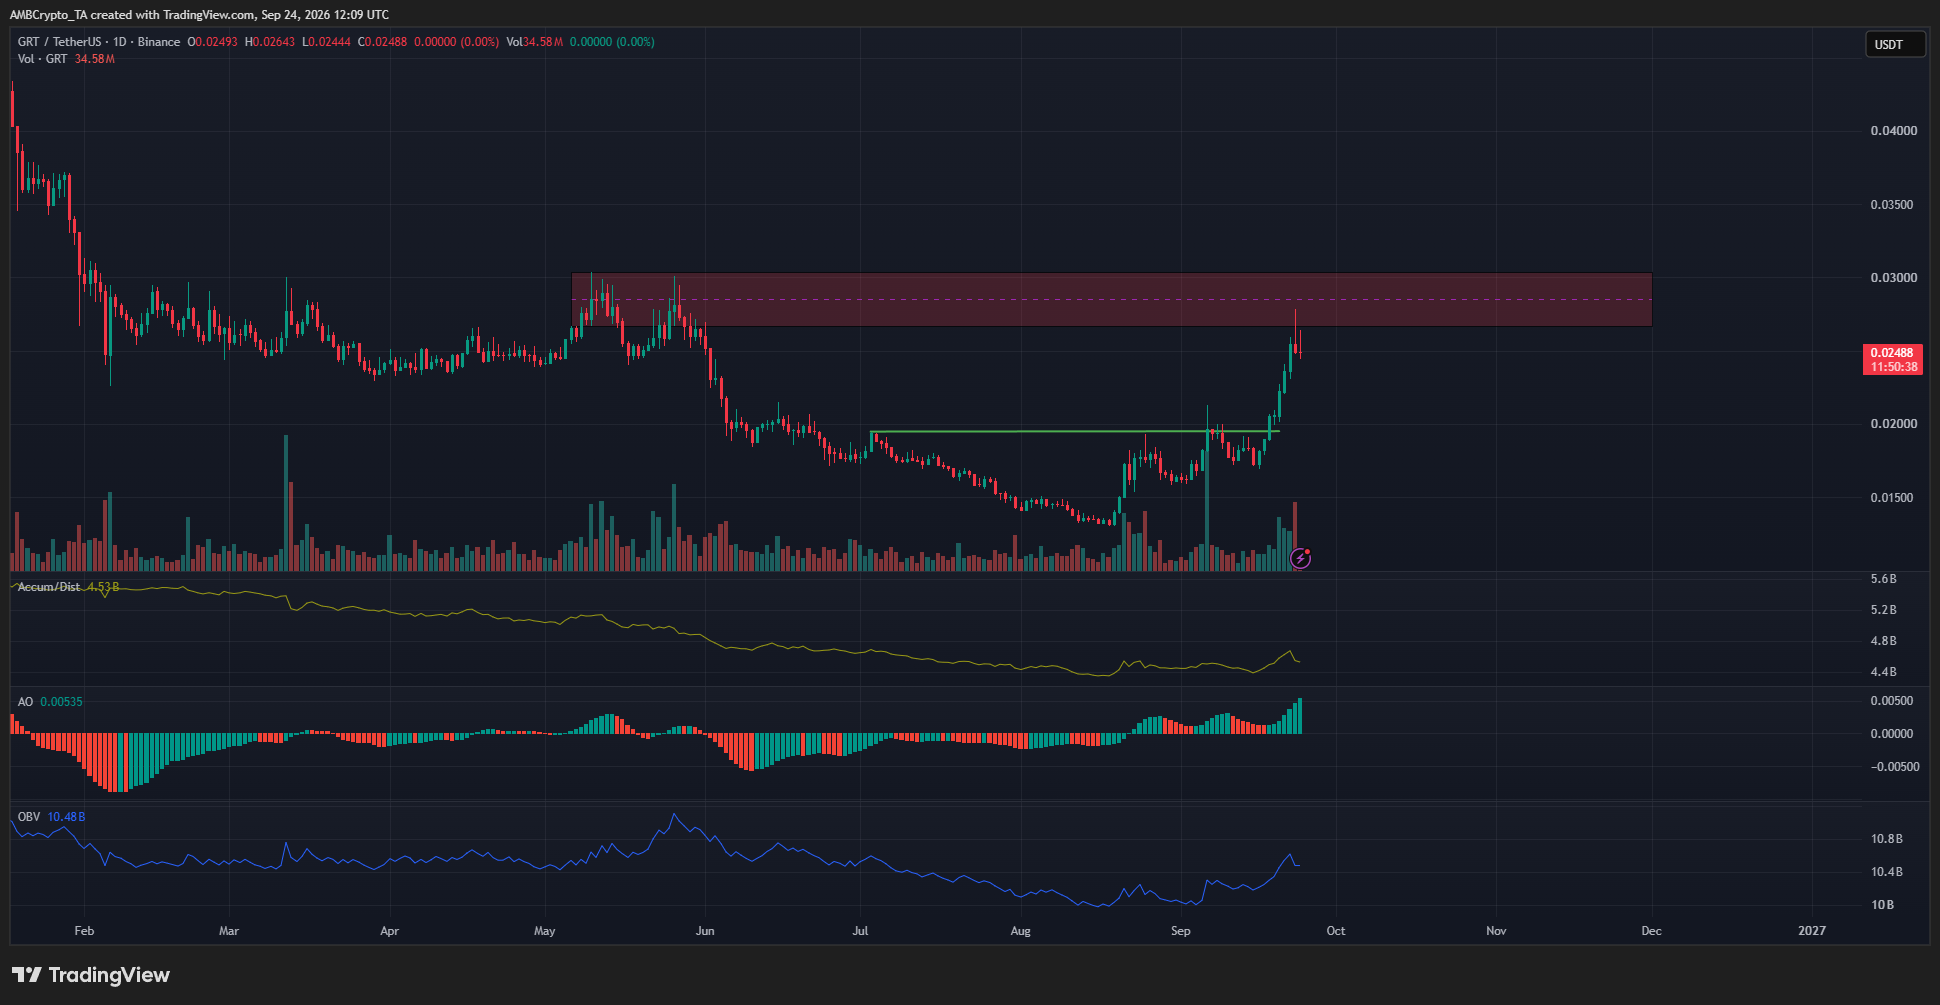
Technically, the GRT crypto trend shifted bullishly when the downtrend’s most recent lower high at $0.01947 (green) was breached on the 6th of September. However, the $0.023-$0.030 area was a consolidation phase from earlier in 2026 that cannot be ignored.
The GRT tokens bought during this consolidation ahead of a recovery would only now be nearing or slightly surpassing their breakeven prices. Hence, it is a particularly strong supply zone.
Moreover, the bearish order block (red) at $0.026-$0.30 is one to watch. A daily session close above $0.030 would be a reliable signal of bullish dominance.
Additionally, the A/D indicator has been rising lately alongside the OBV, reflecting steady buying volume. The Awesome Oscillator also signaled bullish momentum, supported by above-average trading volume.
Should GRT traders buy the dip?
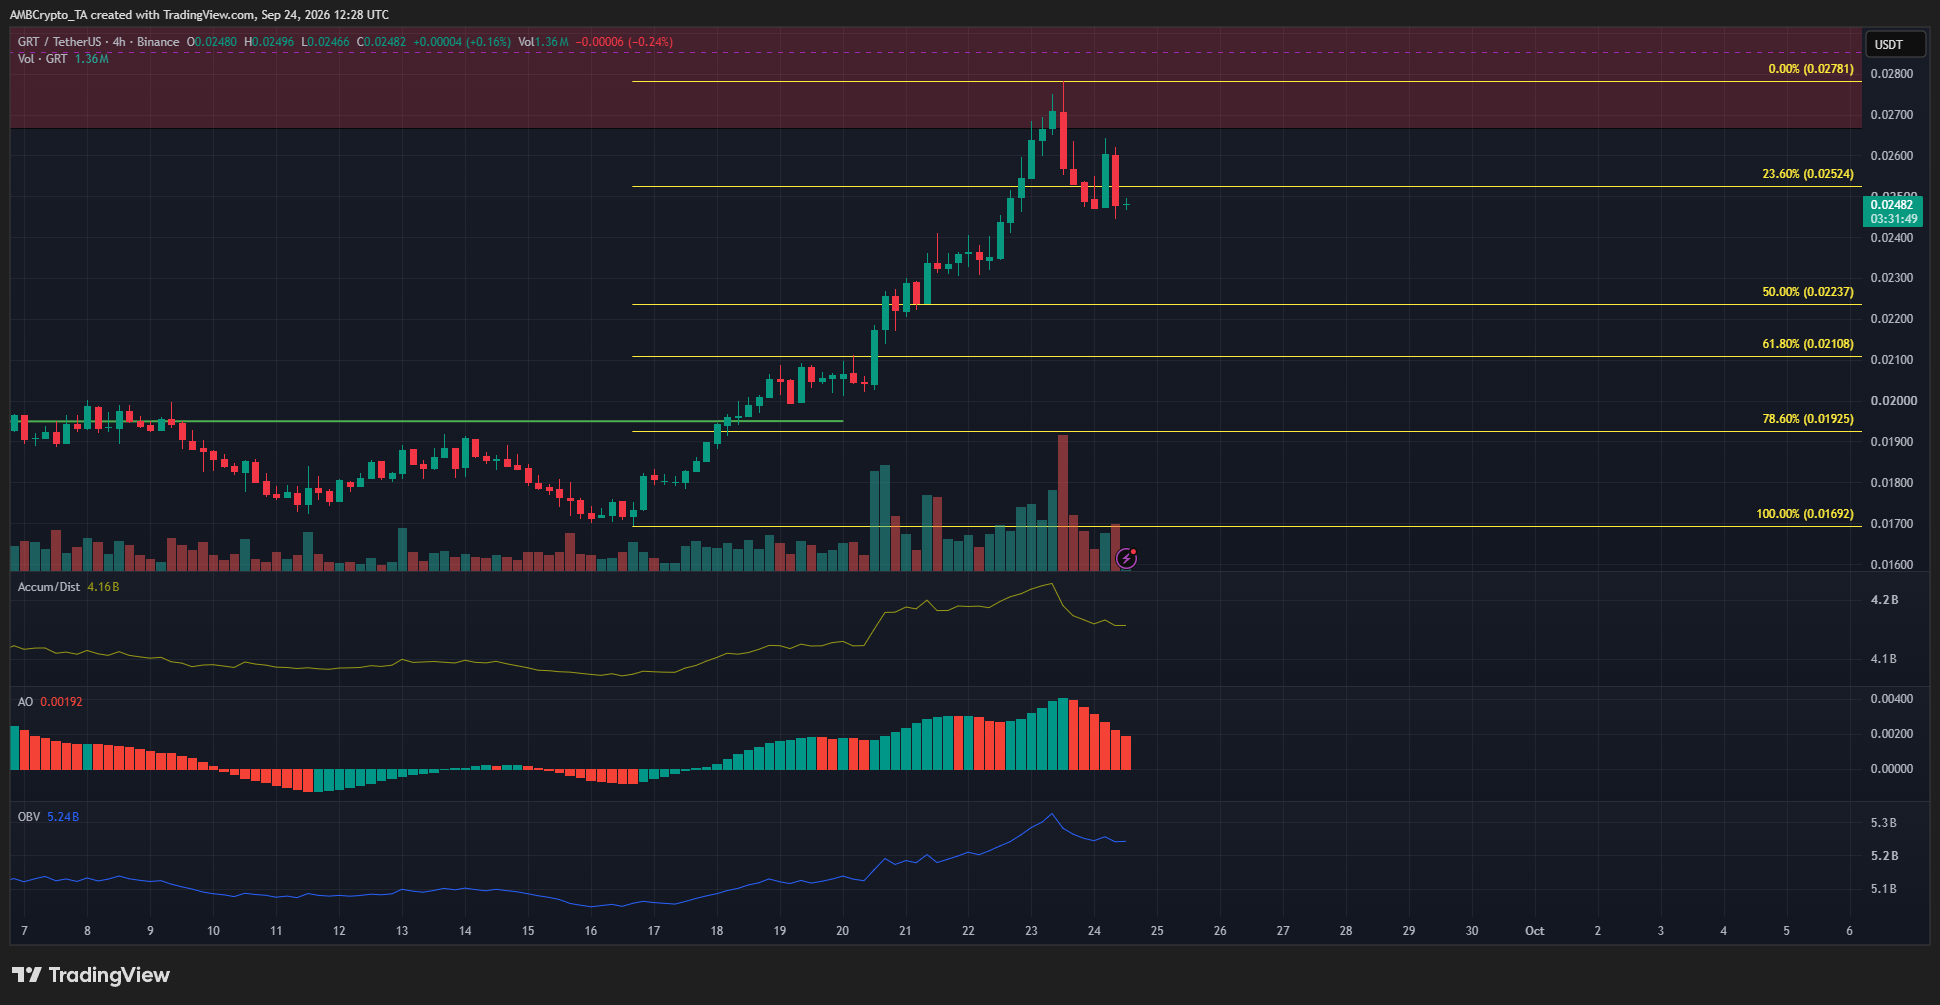
The 4-hour chart highlighted where swing traders can look to buy the dip. The swing structure on this timeframe was clearly bullish, and the Fibonacci retracement levels (yellow) drew attention to the $0.01925-$0.02108 area as the golden pocket.
A dip into this area and a positive reaction would be a good signal of buyer intent. Such a reaction would also depend on Bitcoin’s strength above the $80k-$82k former supply zone, as a deeper sell-off could affect short-term market sentiment.
Final Summary
- The Graph token looked likely to initiate a long-term uptrend after pushing its way to the $0.300 supply zone in a matter of weeks.
- In the coming days, a price dip toward $0.020 appeared likely. Swing traders can gauge the price reaction before looking to go long.