
On the 8th and 9th of November, Ethereum [ETH] witnessed a combined liquidation of $432.34 million worth of leveraged positions. As a result, the ETH price slid from $2,236 to $2,060.
This was the largest wave of liquidations for Ethereum since the 19th of August, when $1.02 billion worth of short positions were taken out in a single day.
At the time of writing, Ethereum was trading just above $2.1k. Swing traders and investors would be keenly watching the $2,000 psychological level to assess if the next wave of selling was upon us.
In other news, Vitalik Buterin presented reasons why Ethereum as a store of value made “more sense to focus on” than ETH as a fee-burning token.
Ethereum sees a notable decline in Open Interest
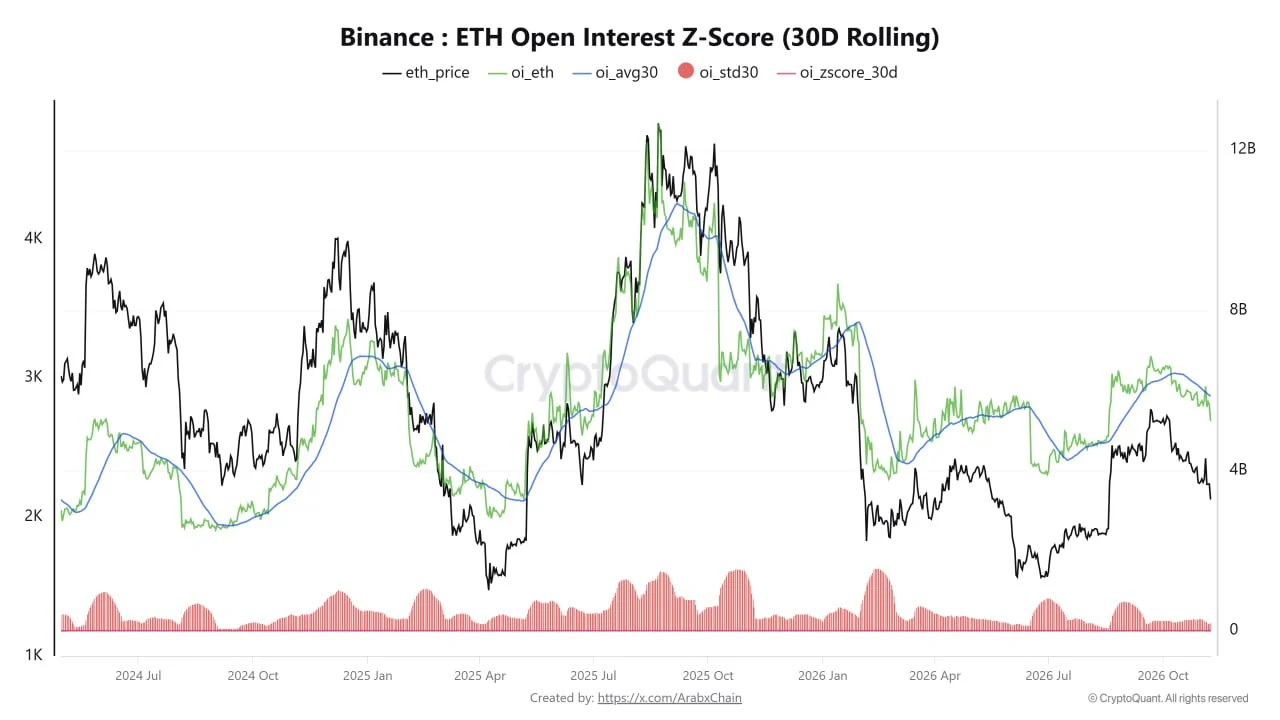
The 30-day rolling Ethereum Open Interest Z-Score fell to -2.87. Using data from Binance, crypto analyst Arab Chain presented data that revealed an unusually sharp decline in Open Interest (OI) behind ETH contracts.
The OI was at $5.236 billion, compared to the 30-day average of $5.850 billion, with a standard deviation of $213.77 million. This meant that the current OI was about 2.87 standard deviations below the 30-day mean.
Meanwhile, persistent selling pressure has pushed the leading altcoin’s price down towards $2,100. Declining OI and downward price pressure could be due to the closure of existing positions, through liquidations or manual exits.
It is not necessarily a sign that there were sizable short positions opened, the analyst wrote.
Will Ethereum prices sink further?
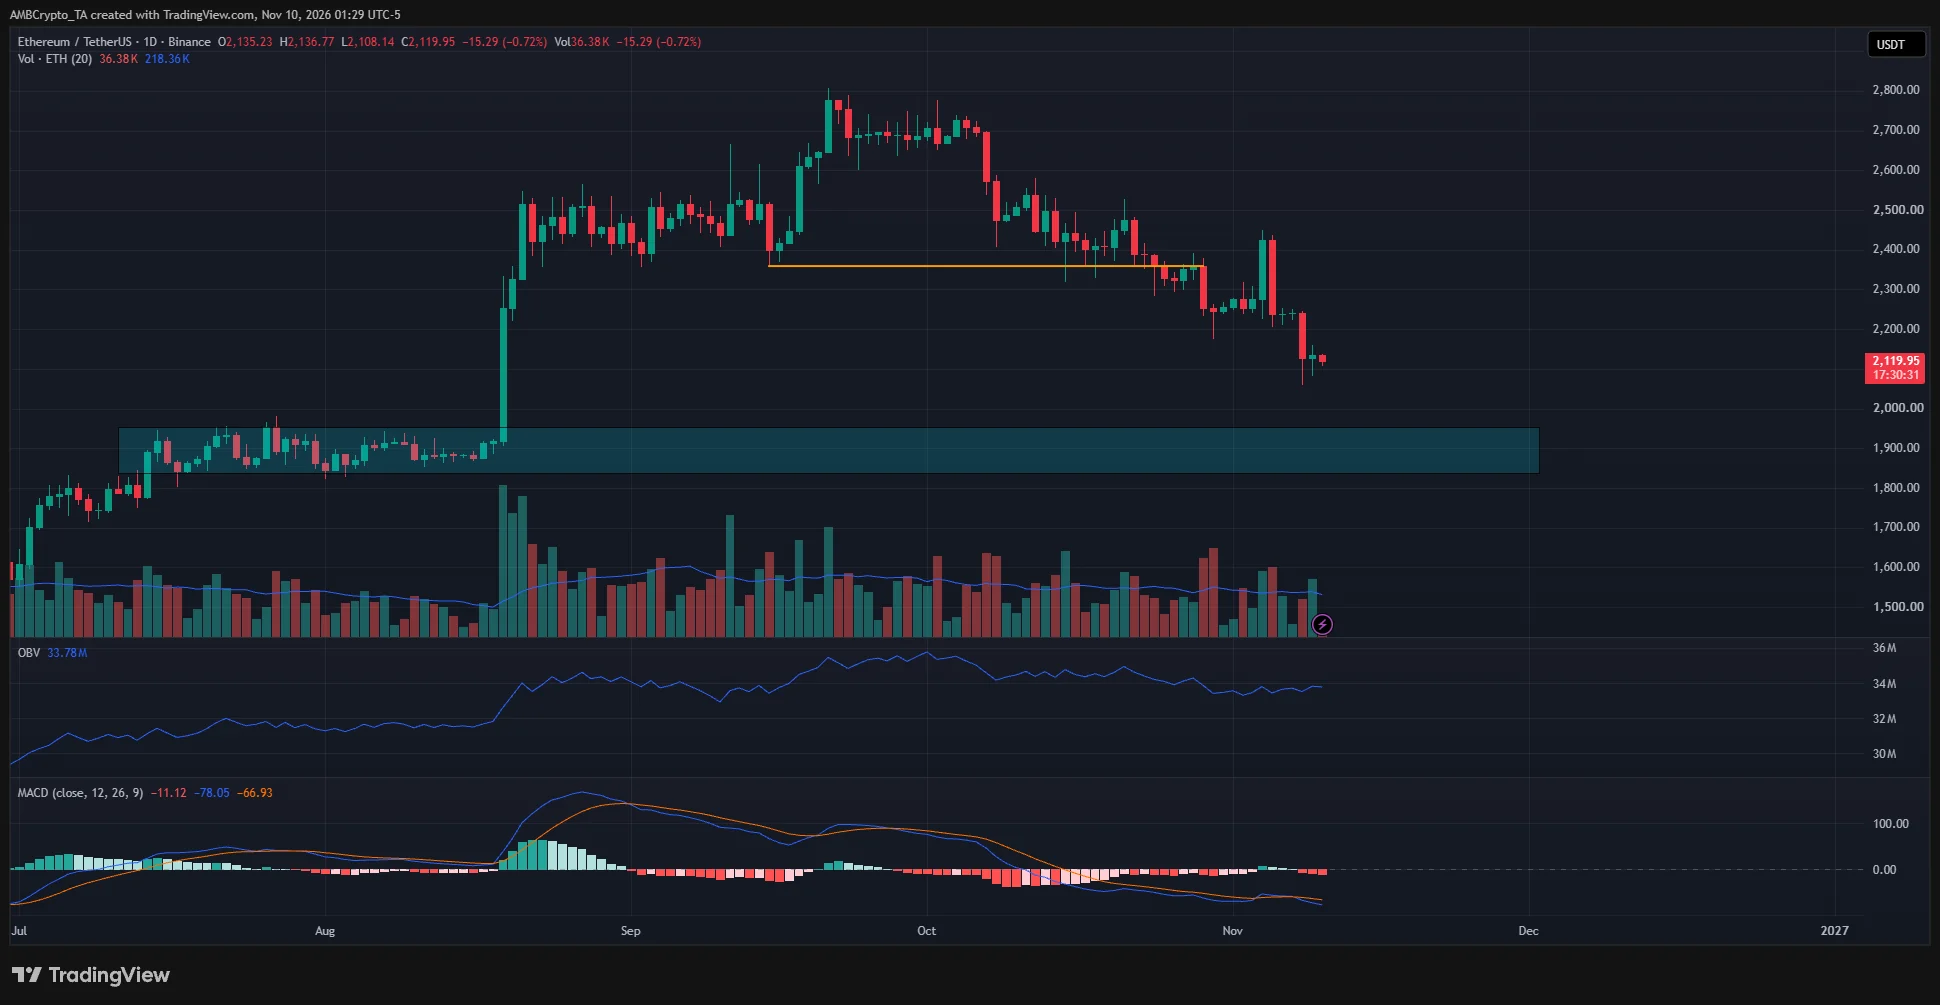
The ETH price structure was bearish after the loss of the swing point at $2,358. The $2,400 area has since been retested as a resistance zone, and the price has reacted bearishly from there in November.
The OBV was relatively flat over the past ten days, but it has been declining slowly since early October. The MACD was also declining and signaled strong bearish momentum at the time of writing.
The $2,000 round-number support was one level to watch. The $1,840-$1,950 area demand zone where ETH consolidated in July and August was also a place investors can wait for a bullish reaction from.
Final Summary
- Ethereum saw its largest liquidation volume since mid-August earlier this week when it dipped from $2,246 to $2,060.
- The Open Interest witnessed an unusually sharp decline compared to its 30-day average, signaling reduced risk appetite and a marked decline in leveraged positioning.