

Helium [HNT] has been among the tokens facing steep outflows as the bear market deepens. In the past few hours, HNT set a new all‑time low, dropping to roughly $0.43 during early trading.
The decline carries a twist, since traders typically pile into shorts on bearish momentum and bet on further downside, yet perpetual traders are doing the opposite.
Table of Contents
Helium distribution deepens as sellers tighten their grip
The case for a further decline still holds, as the indicators point to mounting pressure from the bears. At press time, the Accumulation/Distribution indicator showed heavy offloading of HNT into the market over the past couple of days, which has weighed on the outlook.
The indicator, which was already in negative territory, indicating that sellers dominate HNT’s trading volume, has dropped even lower, highlighting how tightly sellers control the tape.
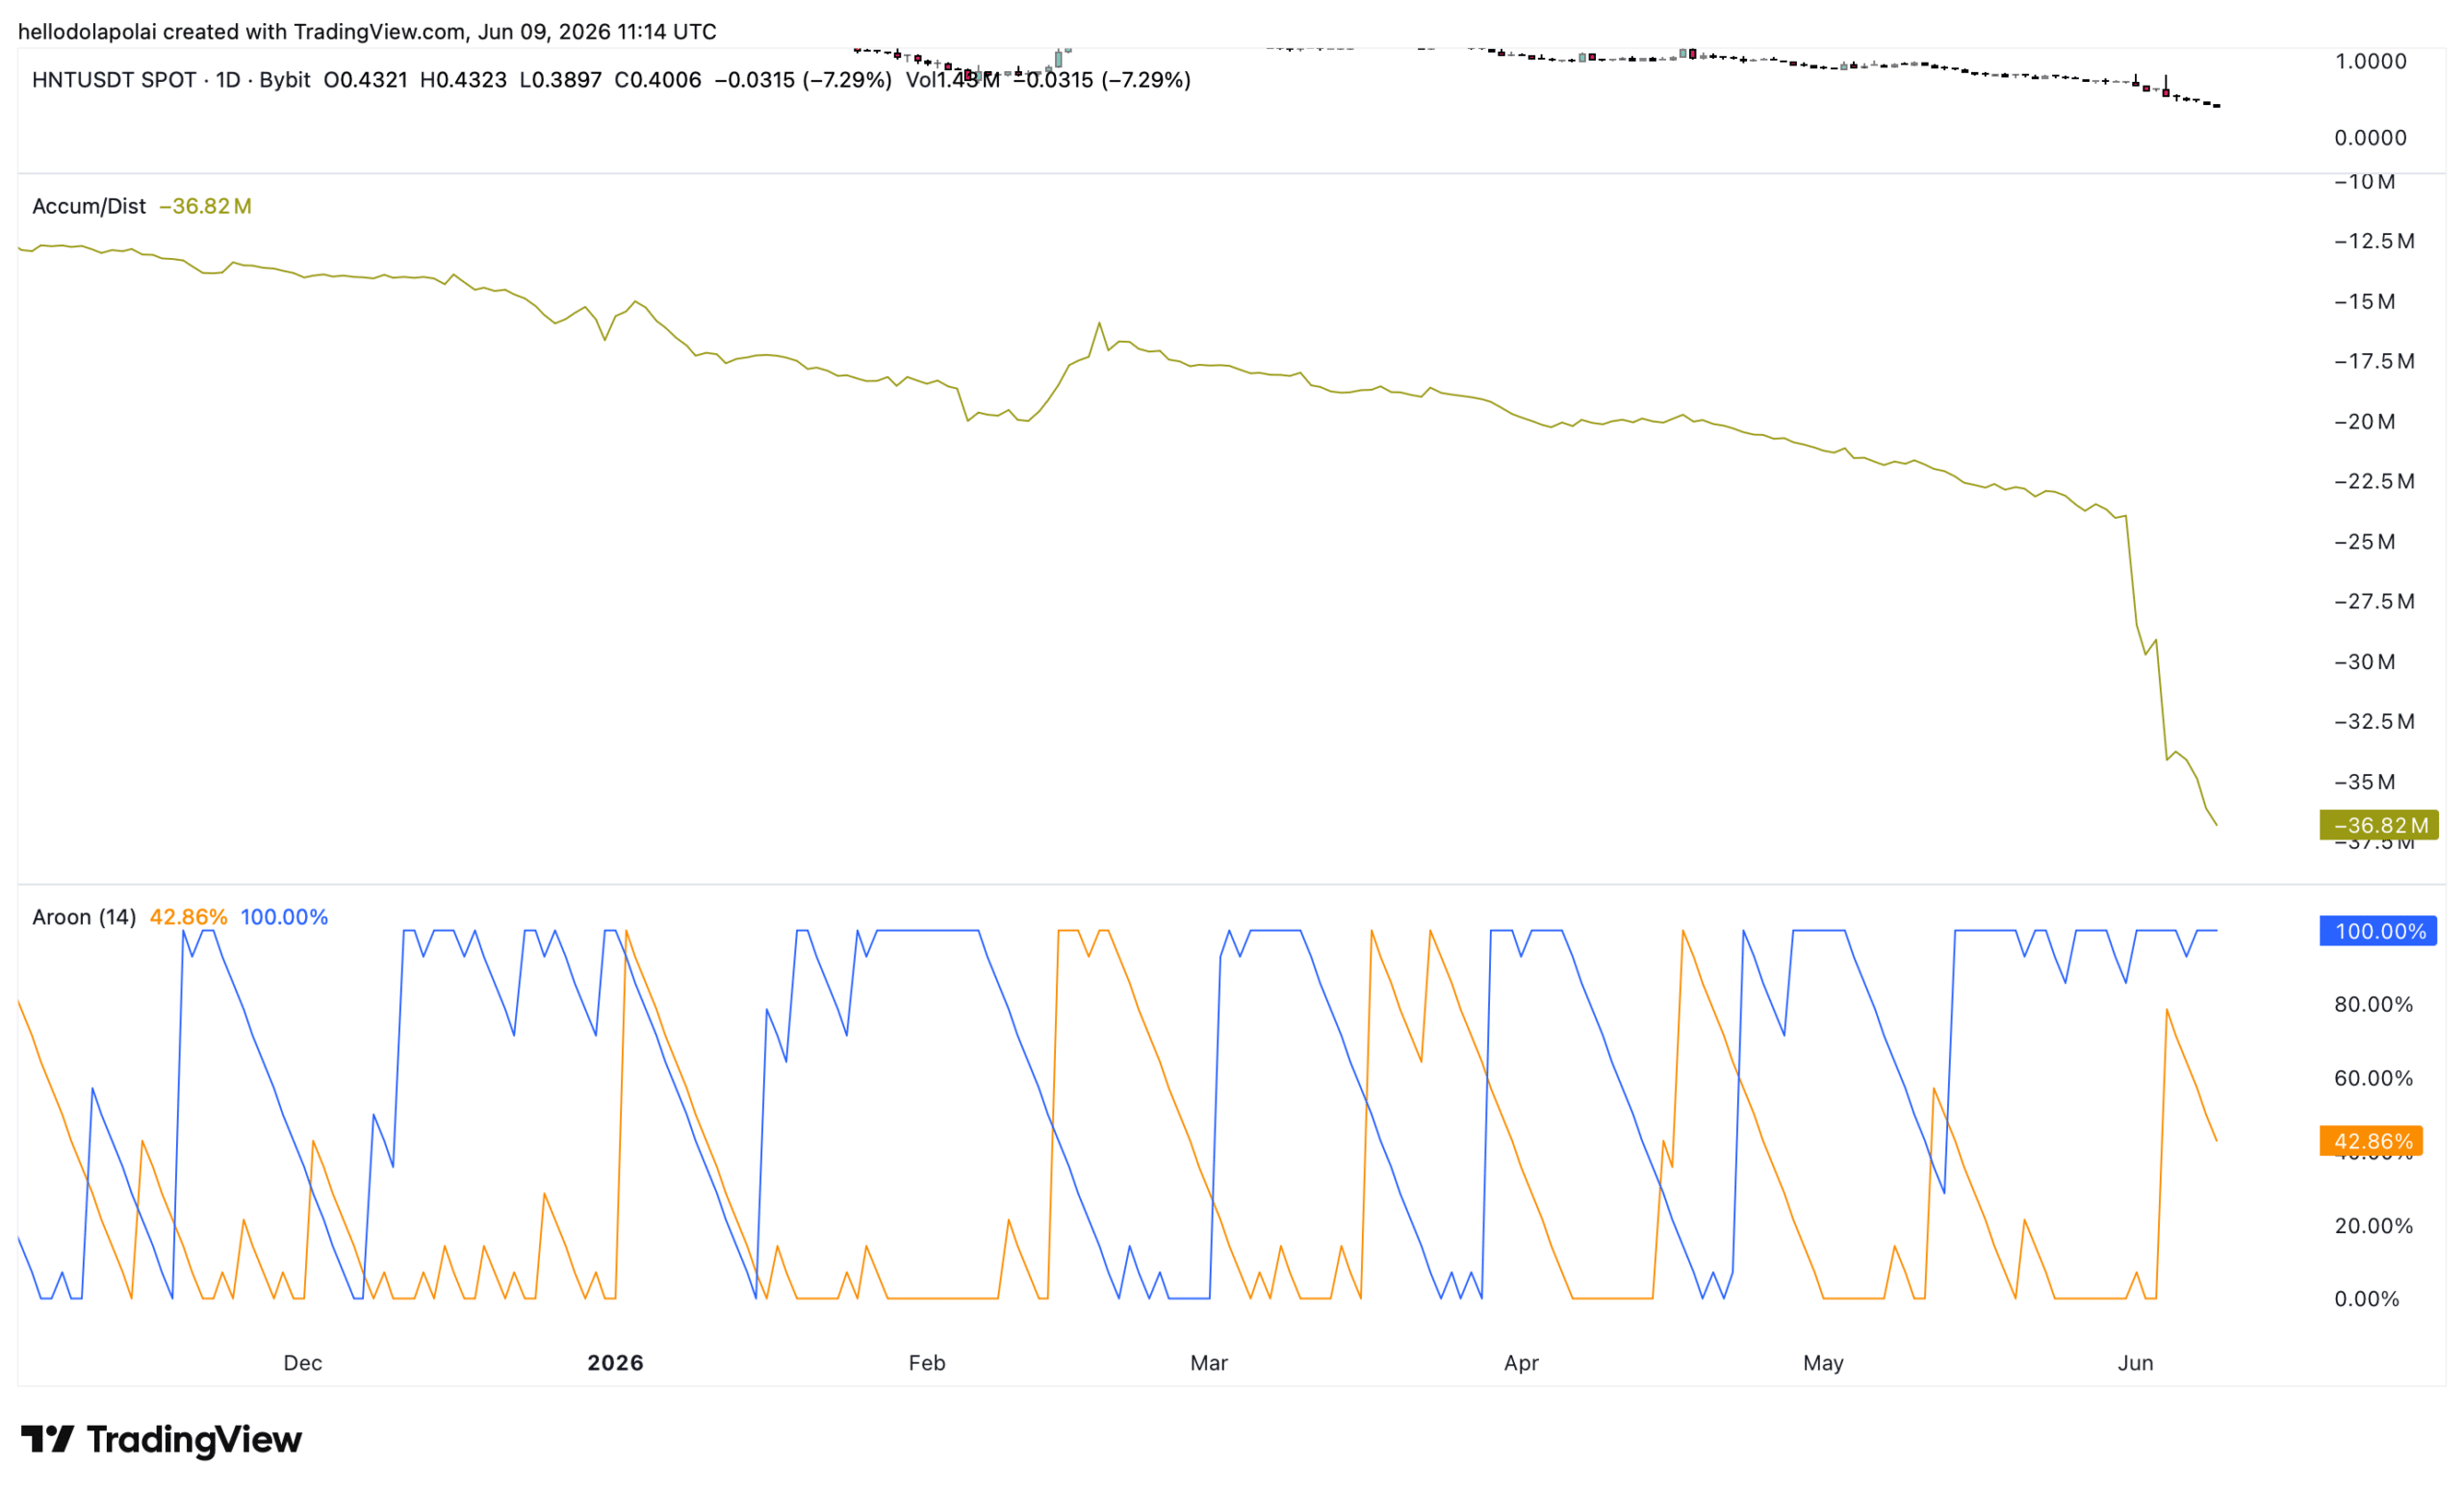
This adds to the bearish reading from the Aroon Indicator, which gauges whether momentum sits with buyers or sellers.
The Aroon Down line (blue) hovered above the Aroon Up line (orange), printing 100.00% and 47.86%, respectively. The setup already signals bearish momentum, and should the gap widen as the Aroon Up line slides further, HNT stands a strong chance of extending its drop down the chart.
Perpetual traders bet against the falling price
This entire move runs against the positioning of perpetual traders, who appear to be buying, anticipating a rally.
At the time of writing, HNT’s Funding Rate had climbed to 0.0100% during the trading session, its highest level for the period. This reflects concentrated capital in HNT perpetuals, signaling a bullish bet as traders anticipate a rebound.
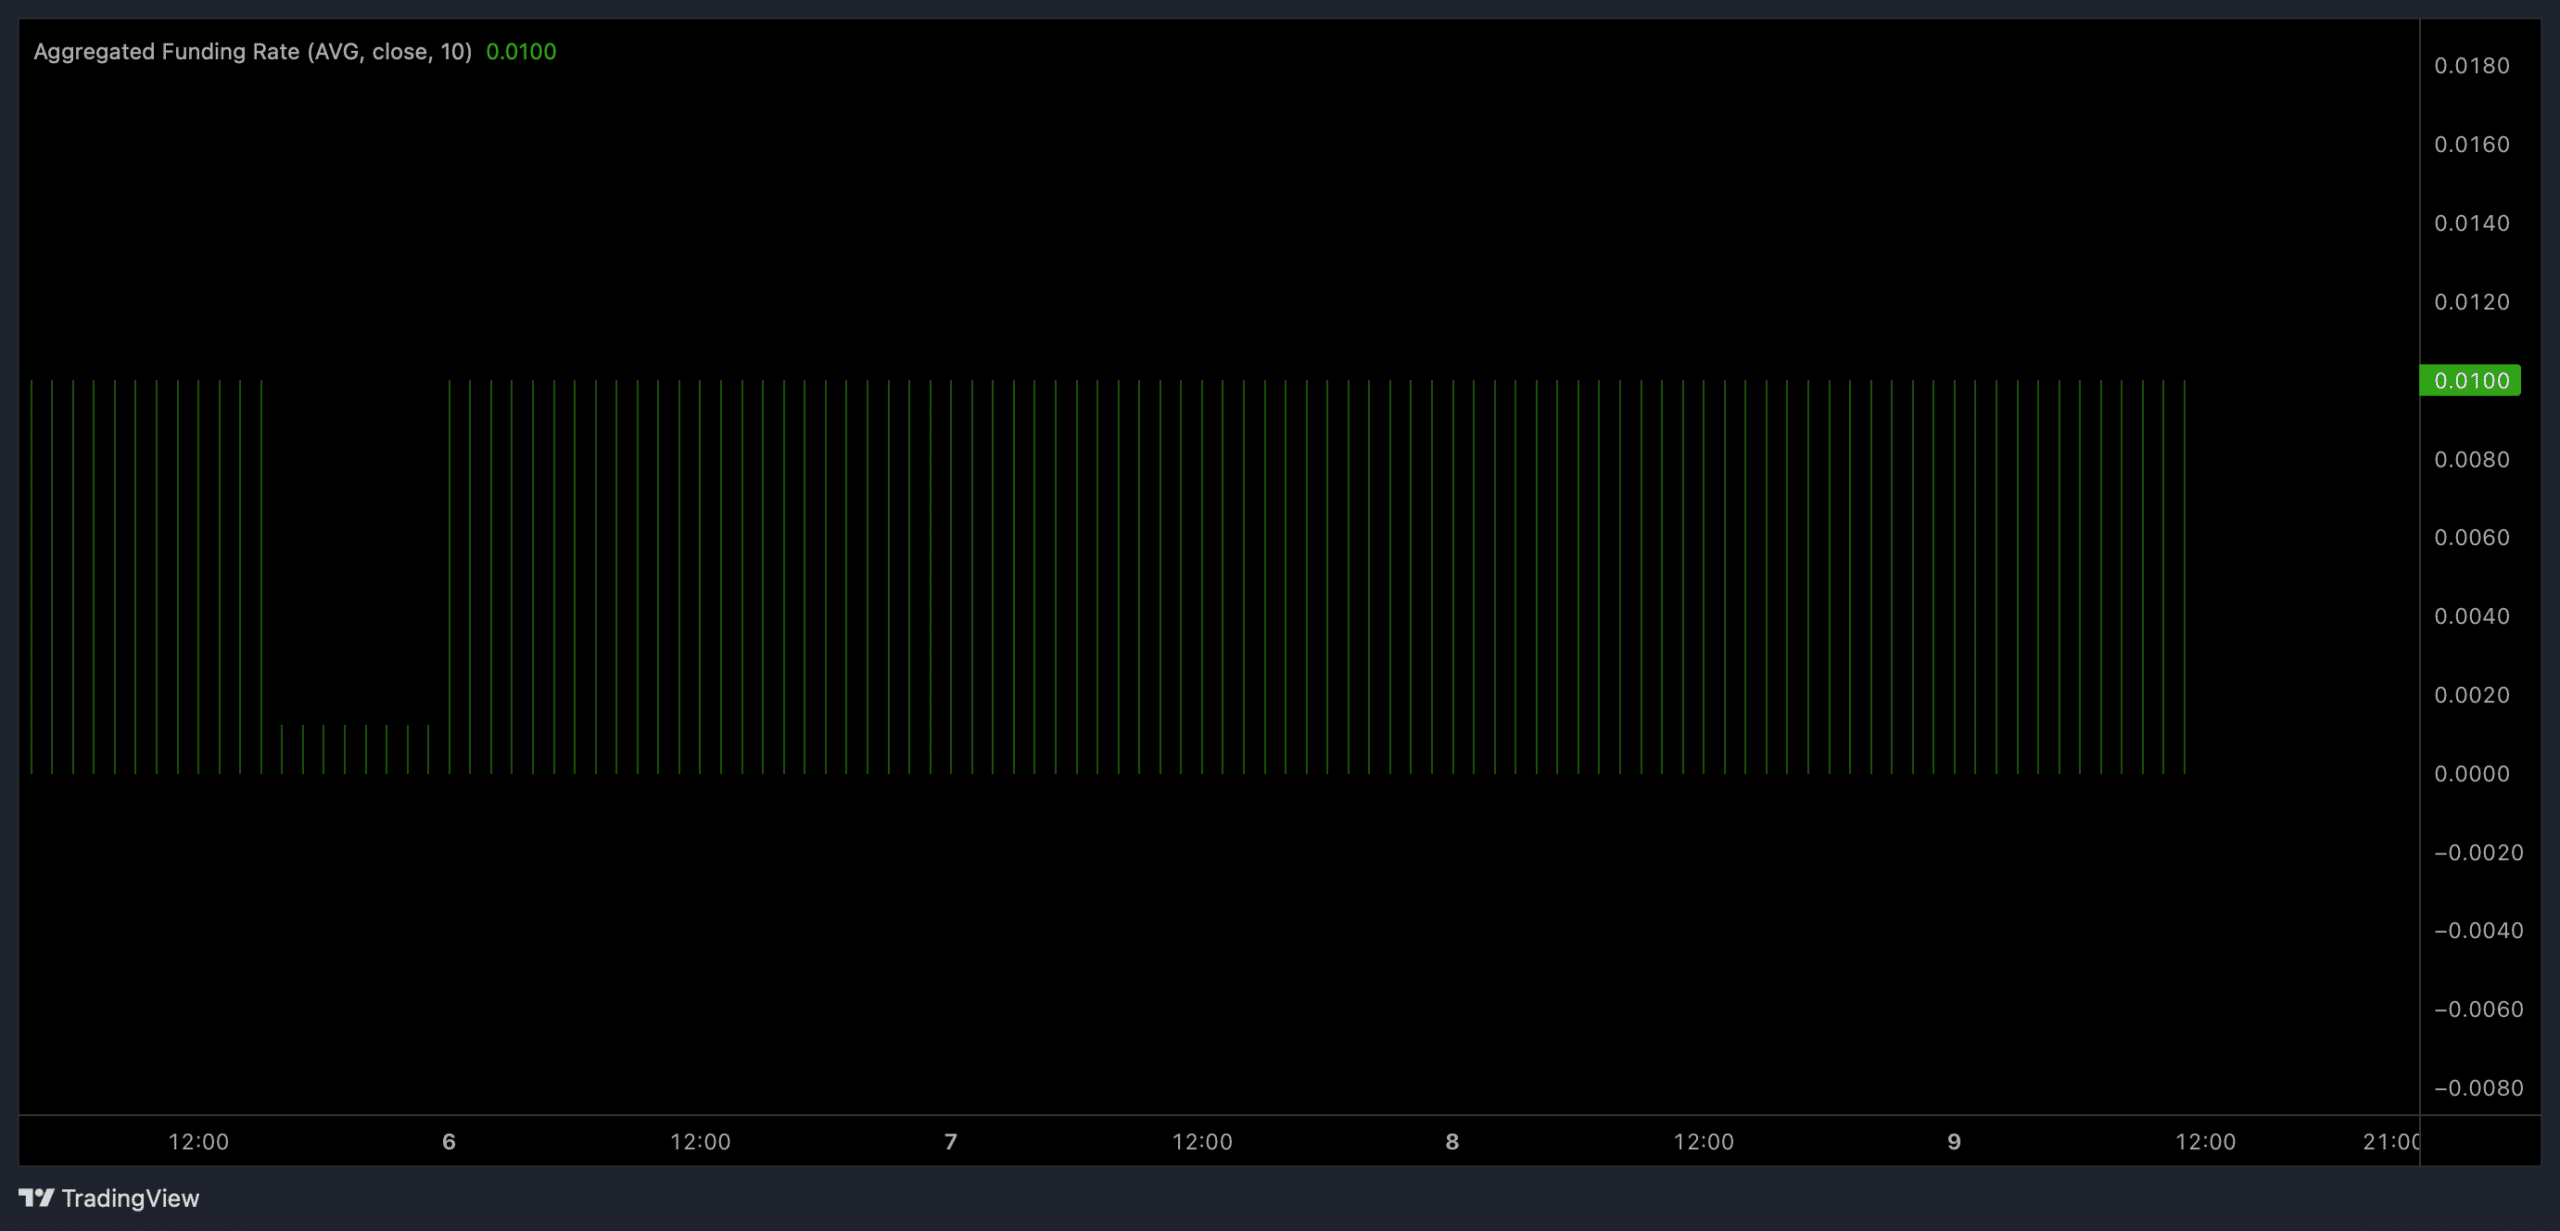
This is not happening in isolation, as volume has surged alongside it, with buying outweighing selling. The Long/Short Ratio stood at 1.12, meaning positioning leans long and points to upward expectations in the perpetual market.
Yet this positioning carries risk, as losses have skewed heavily against the longs; short traders lost nothing over the past day, while longs shed $38,000 across the same period. The data leaves long traders exposed to a sharp decline.
Helium liquidation heatmap leaves both directions in play
HNT is now at a crossroads, as the liquidation heatmap shows no clear directional cut for the asset and leaves the price free to swing either way.
For context, liquidation heatmaps map the spots on the chart where liquidity concentrates, and these zones tend to act as a magnet that pulls price toward them.
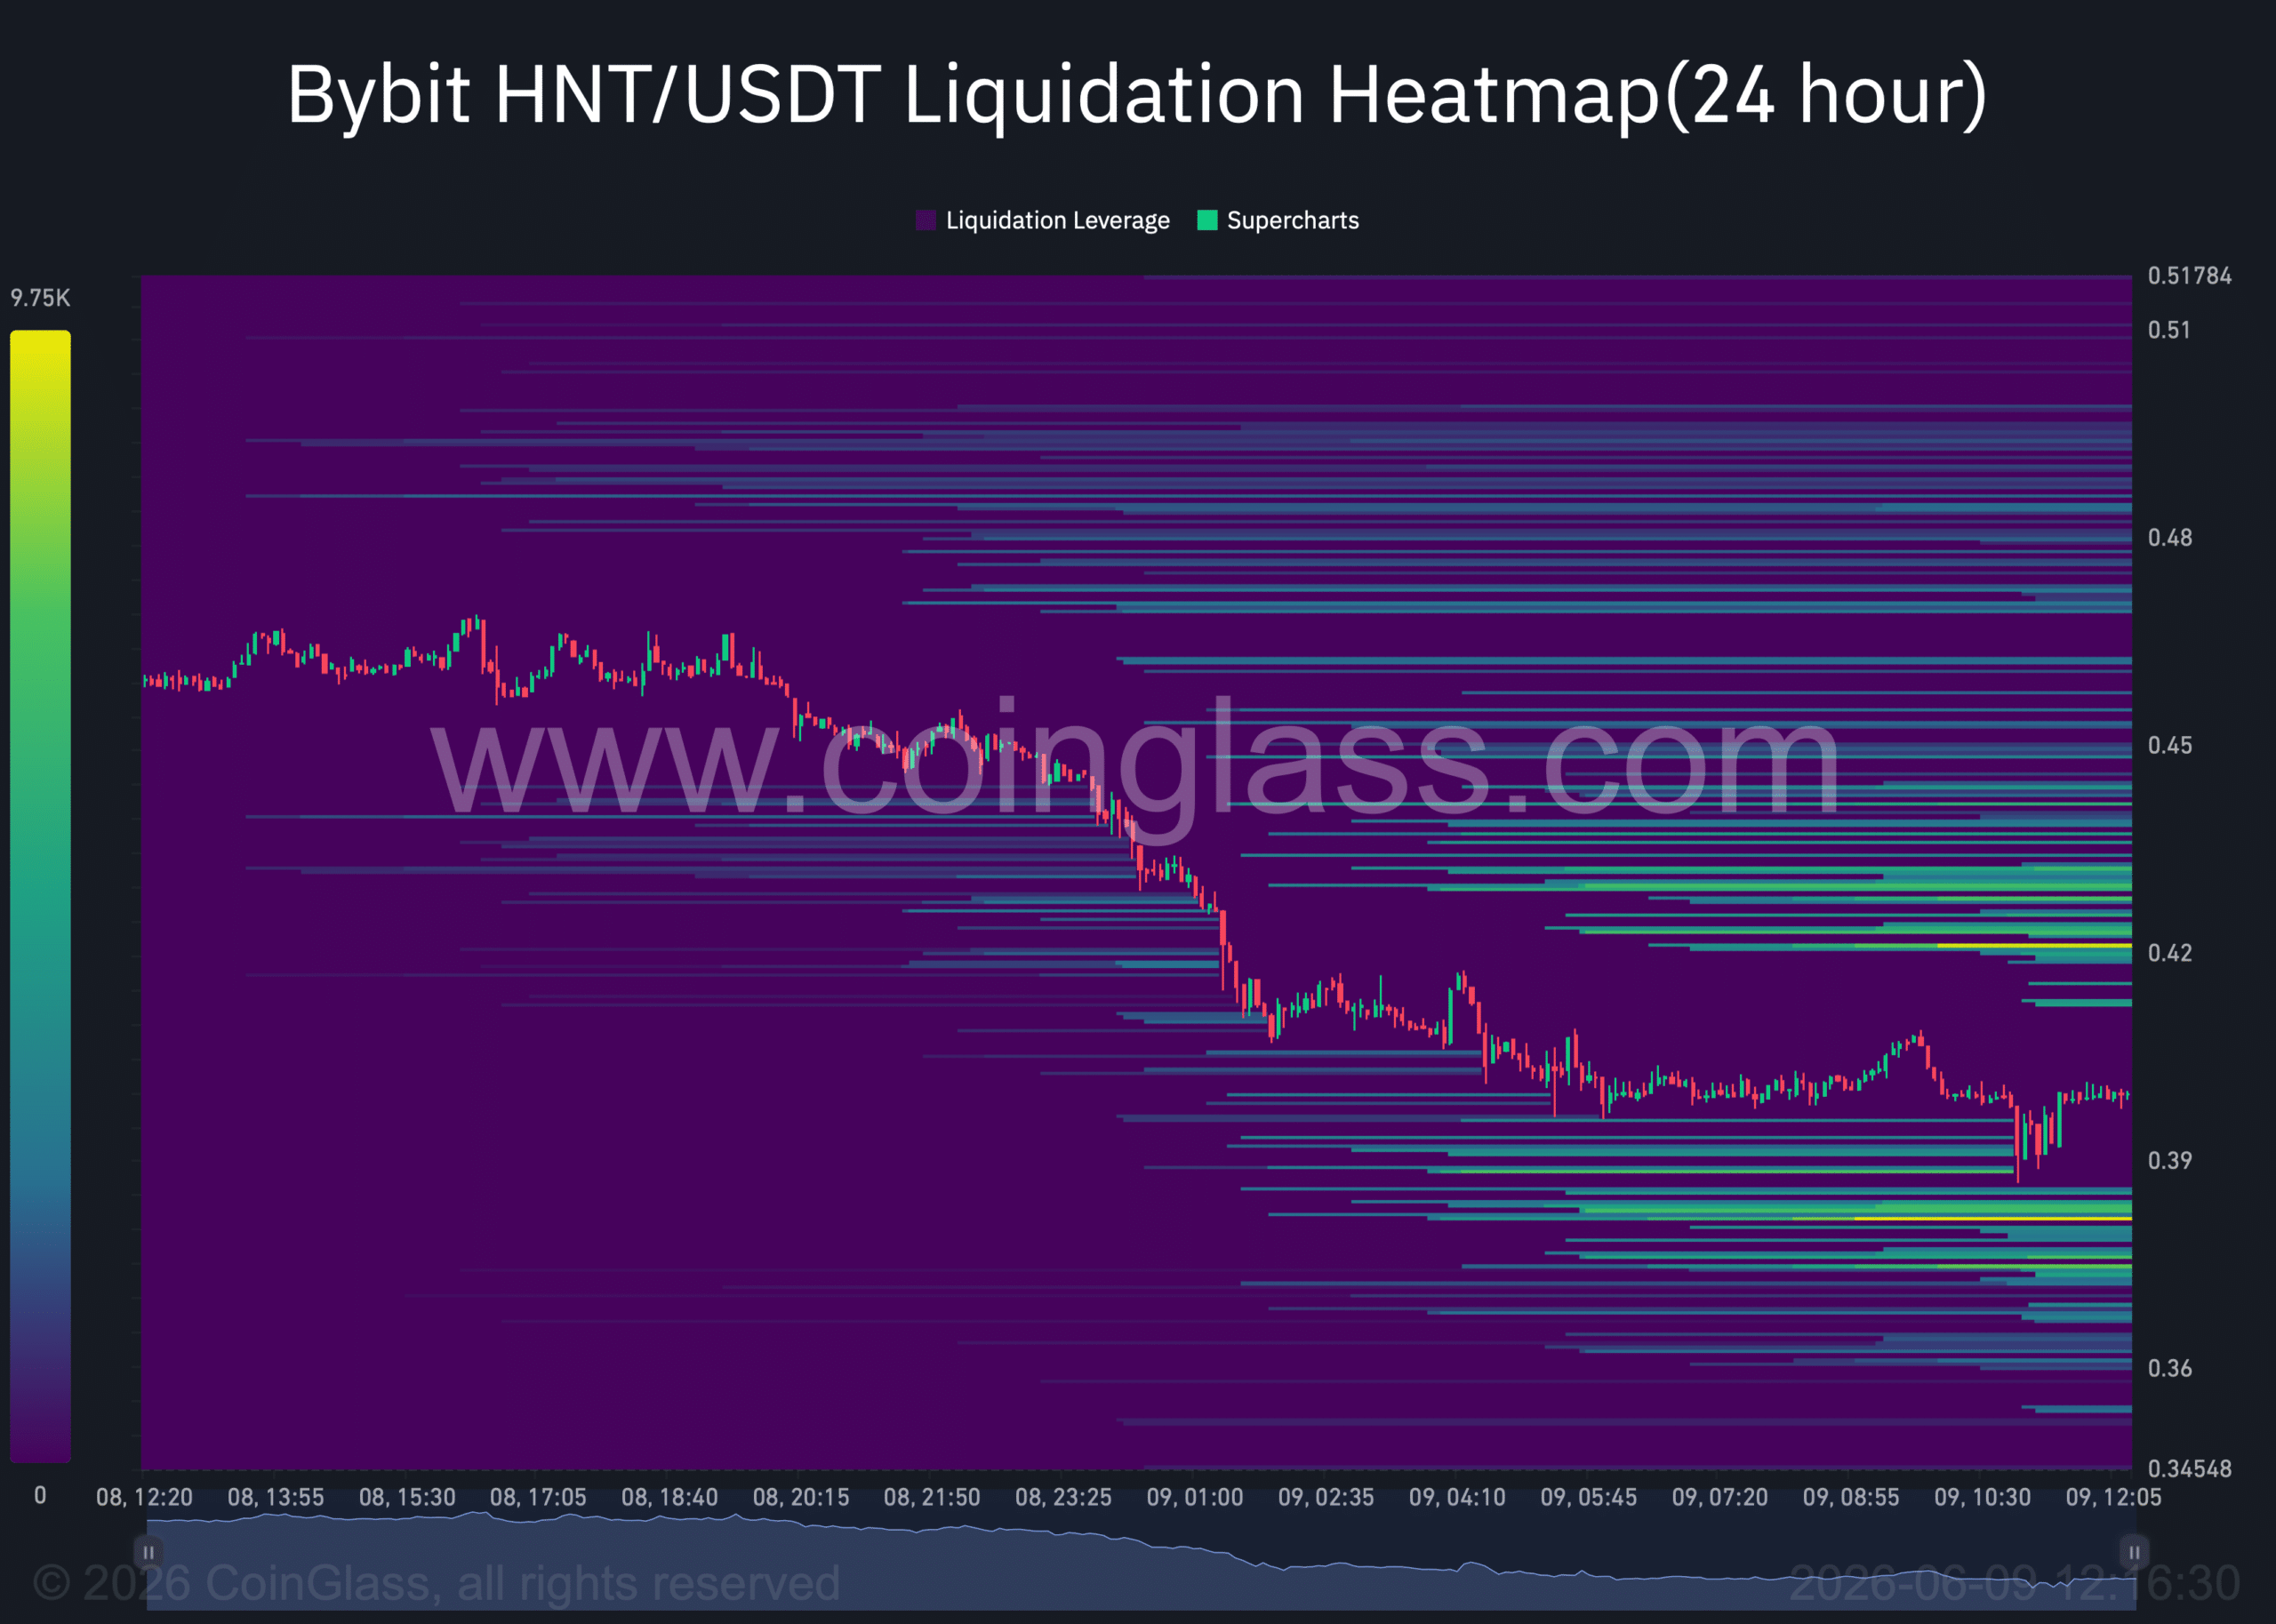
Momentum currently leans toward the bears, and the pull toward the lower clusters remains the likelier path. Either way, the upper cluster stays one to watch, given that the rising funding rate lends support to a rally.
Final Summary
- Helium fell to a fresh all-time low near $0.43 as heavy HNT selling pushed both the Accumulation/Distribution and Aroon indicators into bearish territory.
- Perpetual traders positioned the opposite way, a 0.0100% funding rate and a 1.12 long-to-short ratio show them betting on a rebound.


