

Ethereum Name Service [ENS] has trended lower over the past 24 hours as bearish sentiment and sustained selling pressure dragged the asset down across the market.
The token, which shed 12% within the period, now points to the possibility of a further decline ahead — though its structural setup still leaves room for a major rebound in the near term.
Table of Contents
ENS slides into key demand zone
Market analysis shows that ENS’ decline has pushed the asset into a key demand zone, the final cushion separating it from its recent low of $4.28, which it set on the 6th of June.
The demand zone has historically drawn positive reactions at this level, hinting at a possible relief pump. Currently, the 4-hour chart points to a green candle forming at the zone, a sign that bullish demand is building.
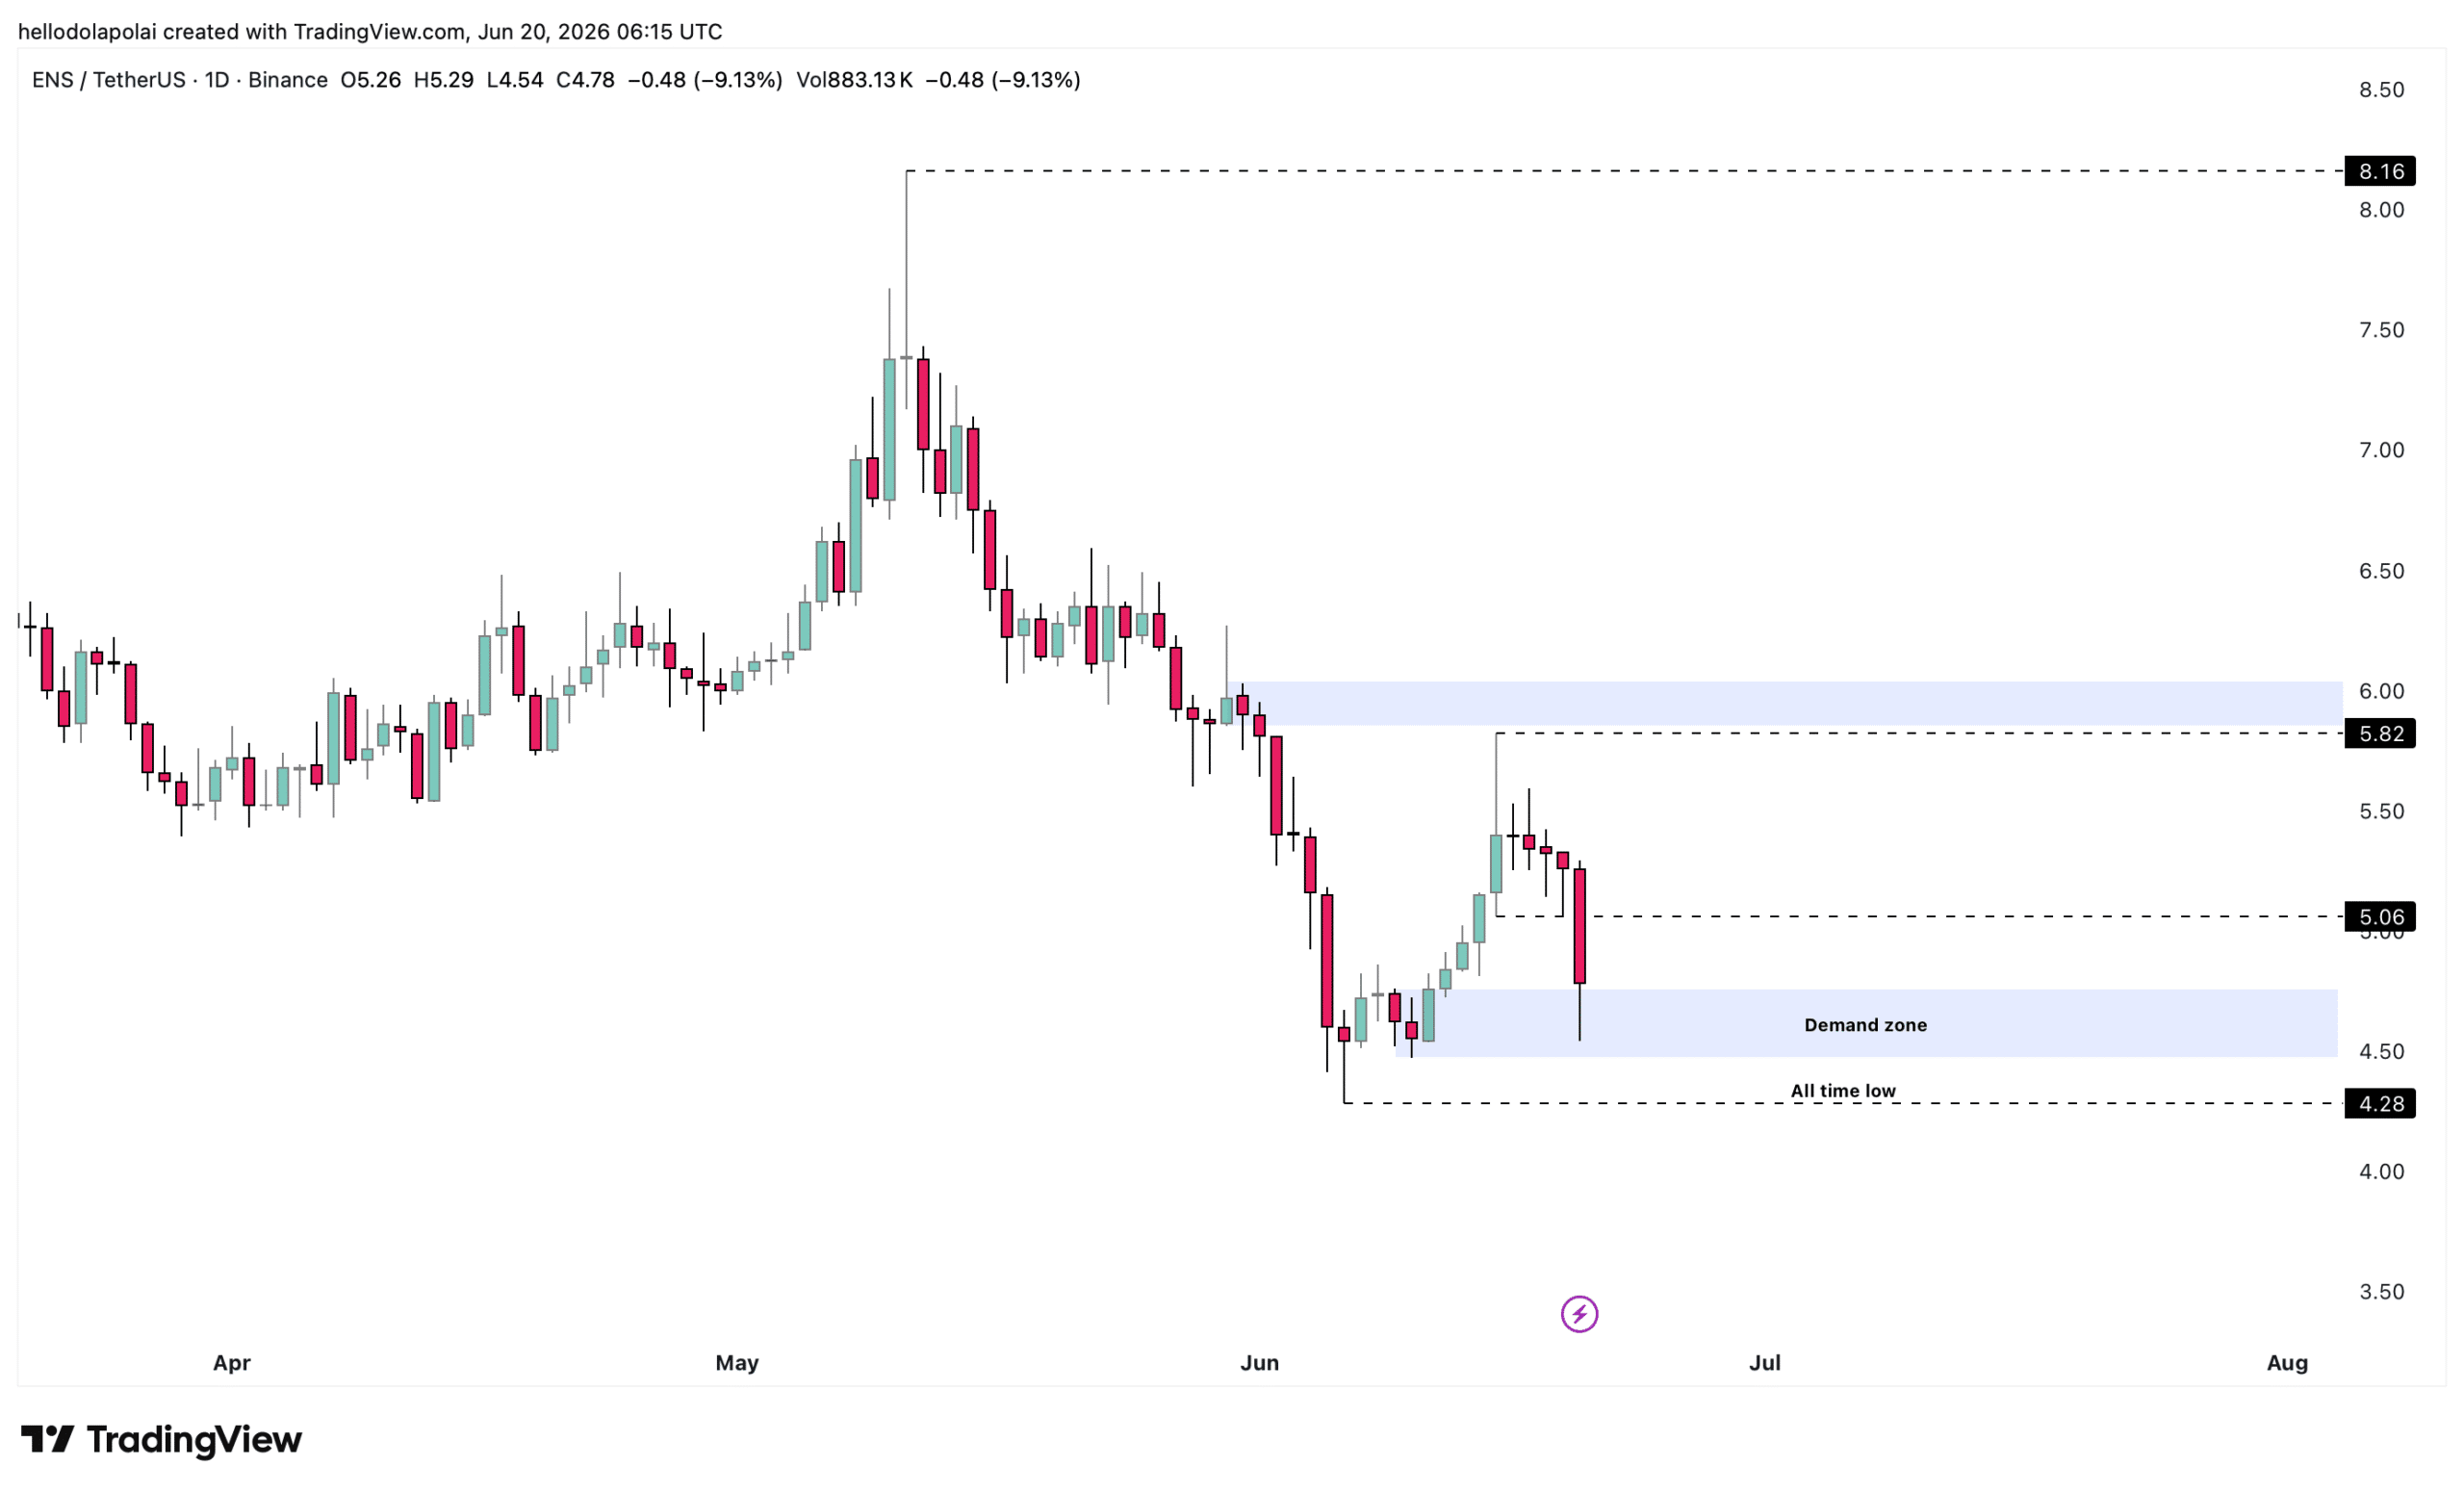
At the time of analysis, the demand zone holds clear upside targets. If buyers respect it, ENS could rally toward the nearest target at $5.06 and the upper target at $5.82.
If sellers keep control, ENS risks swinging lower and extending its slide toward a fresh low, as it did earlier this month.
Indicators point to further ENS pressure
The Bollinger Bands, which gauge whether an asset is trading at overextended highs or lows relative to its recent range, show ENS reaching the mid-band, a level that has since flipped into resistance.
A rejection off this mid-band typically forces the asset toward the lower band, in this case sitting at roughly $4.32 — slightly above the lower price target.
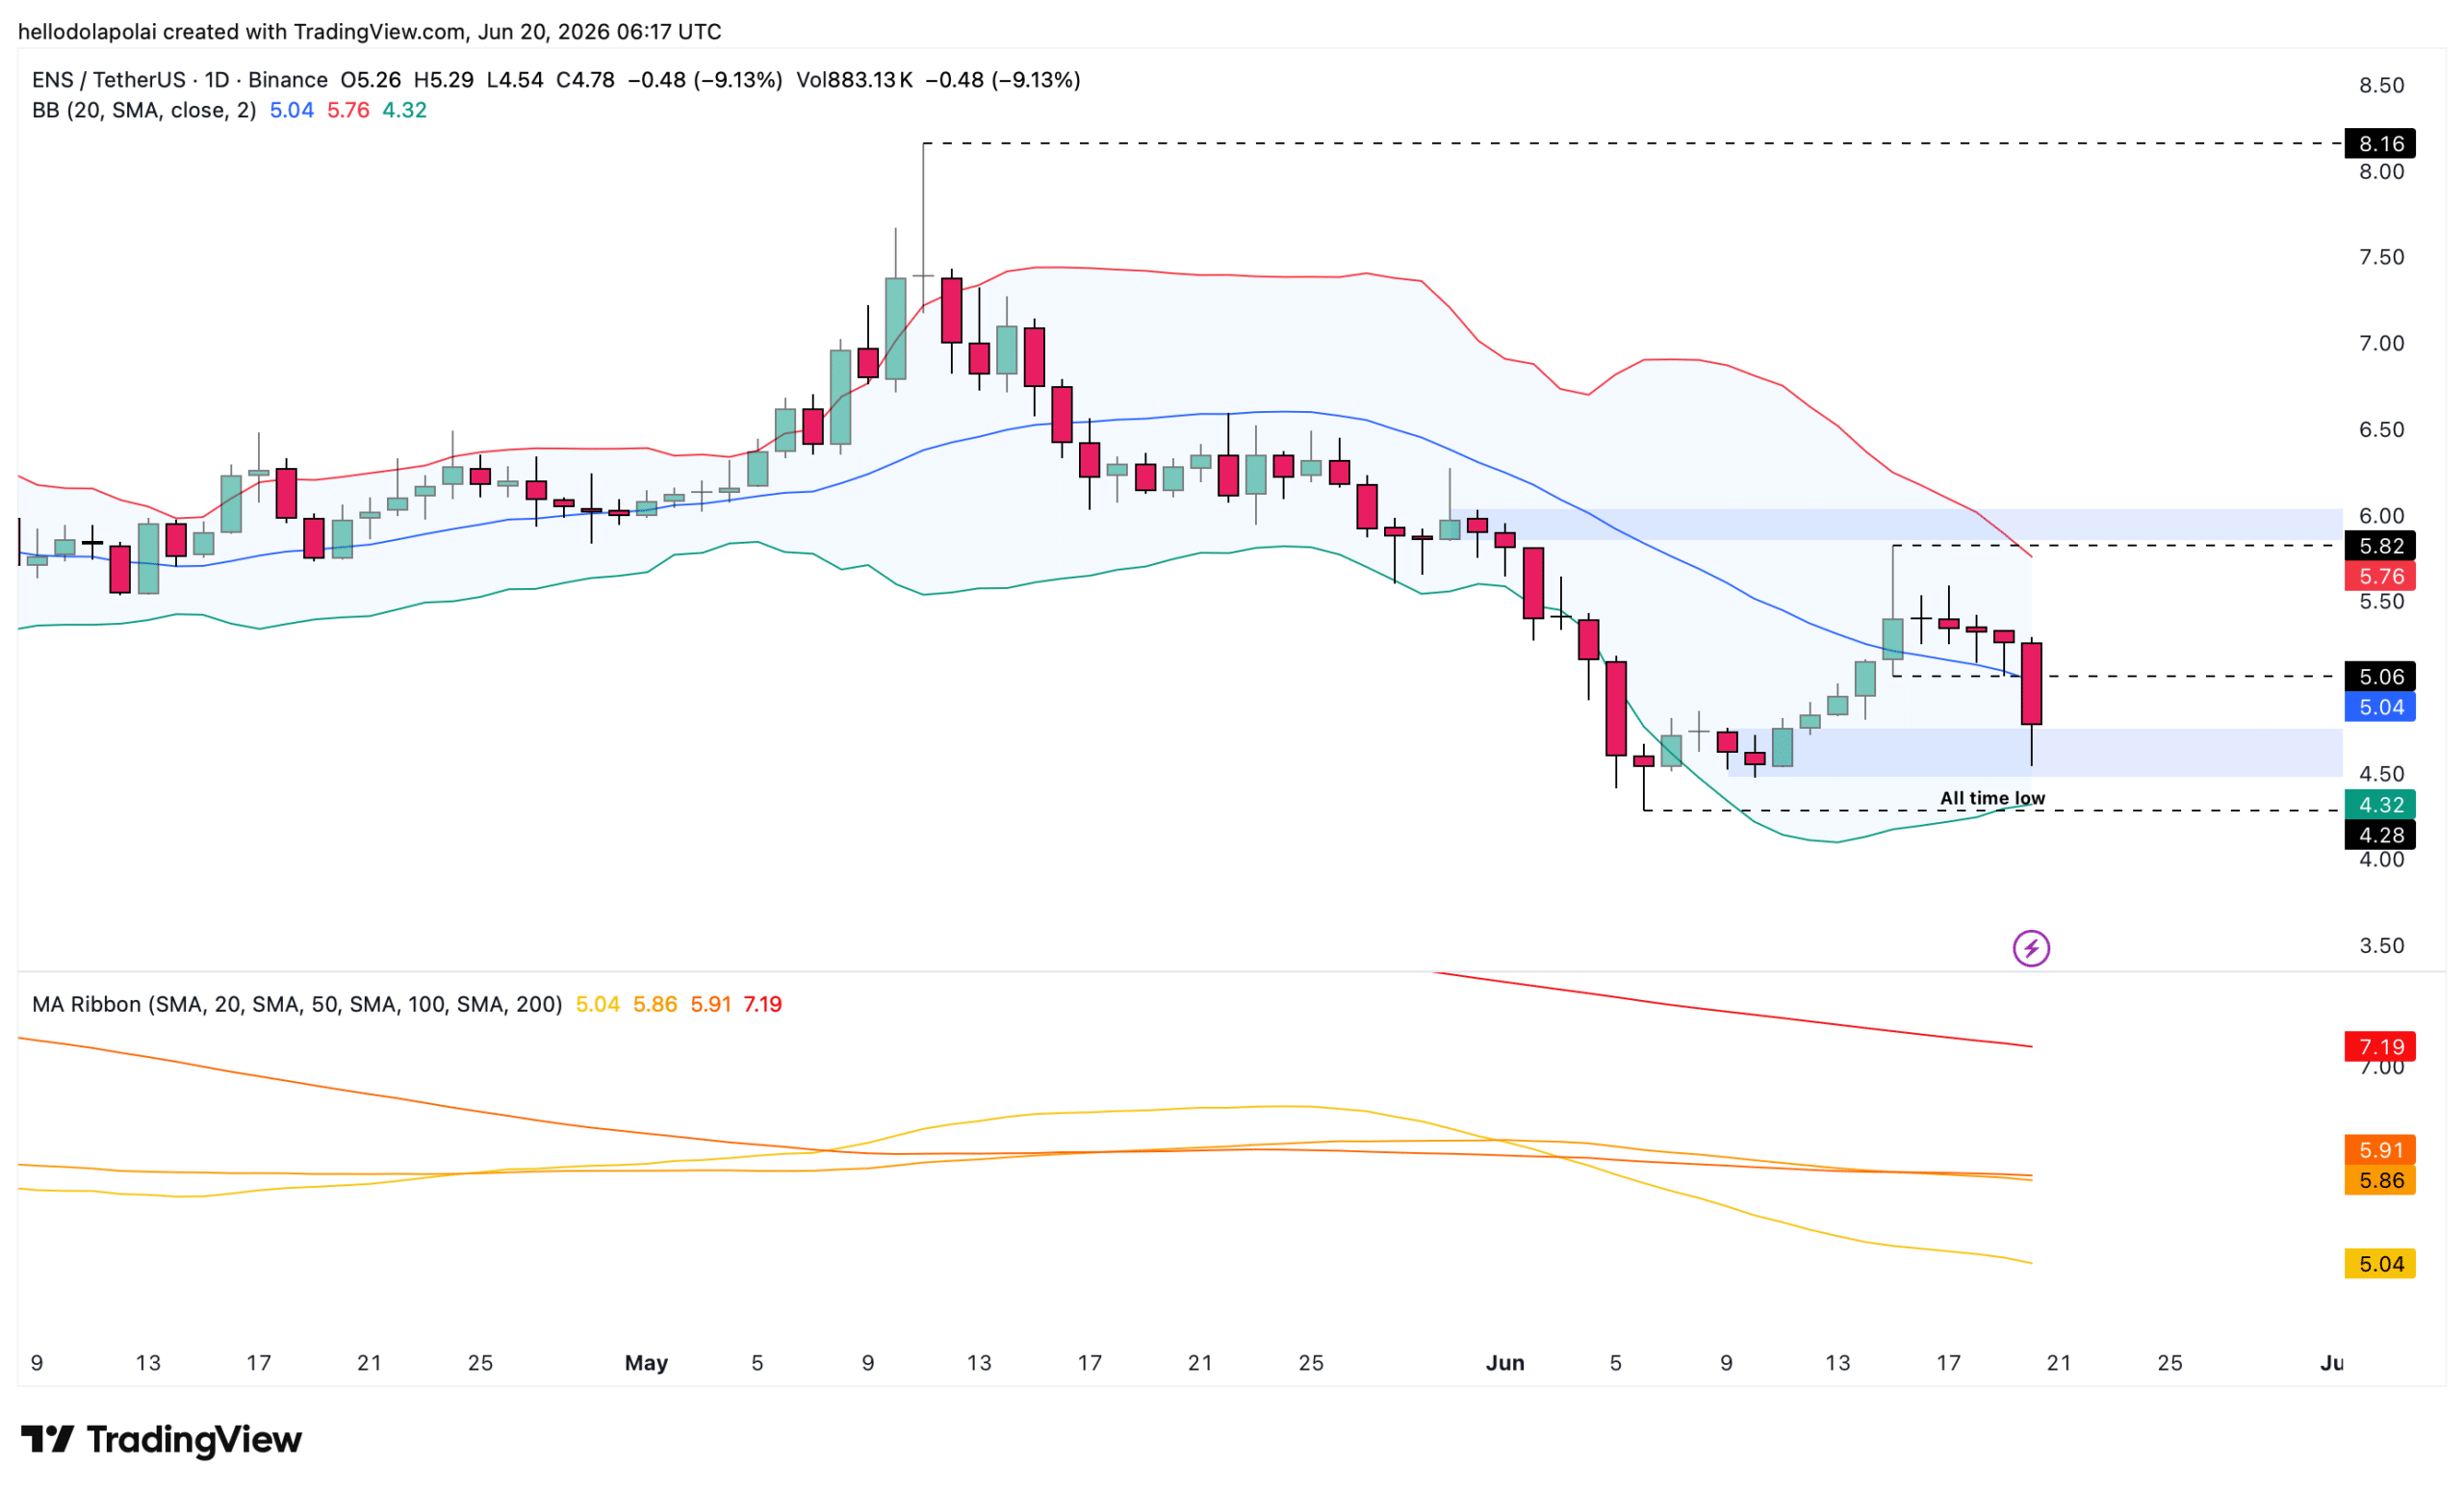
The Moving Average Ribbon, which combines the 20, 50, 100 and 200 SMAs, shows a crossover that reinforces the bearish move. At the time of writing, the SMA 50 had just crossed below the SMA 100, a classic bearish signal.
The SMA 200 also remains elevated well above the other averages while the SMA 50 sits at the lowest level, a configuration that confirms the bearish setup.
Together, even with the demand zone in play, ENS could drop further toward either the lower Bollinger Band or its previous low before staging a rebound.
ENS Spot netflow signals accumulation
CoinGlass’ Spot netflow data for ENS shows investors buying far more of the asset than they have sold across the market.
The netflow registered roughly $2.3 million more in buying than selling, the widest accumulation gap recorded for the asset to date.
The reading tracks how much ENS investors have moved off cryptocurrency exchanges and into private wallets, a pattern that often signals bullish, longer-term conviction and supports a higher trend.
If the netflow keeps favouring buyers, ENS stands a strong chance of holding its ground and resisting a deeper decline.
Final Summary
- After a 12% drop, ENS has fallen to a price level where buyers have stepped in before, raising hopes of a short-term bounce toward $5.06 to $5.82.
- Momentum still favours sellers, so ENS could slip to a fresh low near $4.28 before any meaningful recovery takes hold.


