
Is the market’s resilience approaching a breaking point?
So far, both monthly and quarterly momentum continues to trend upward, with Bitcoin up over 10% and its highest wick stretching all the way up to $66k, potentially setting the stage for a move toward the $70k-$75k range by the end of the quarter.
However, nearly 90% of these gains came in July, clearly showing that August momentum has been much weaker so far.
And if we look at a key technical pattern around Bitcoin, this weakness could just be getting started.
As the chart below shows, BTC closed March and April up over 1.84% and 11.8%, respectively. But as momentum started to weaken, BTC closed May and June down over 3% and 20%, respectively.
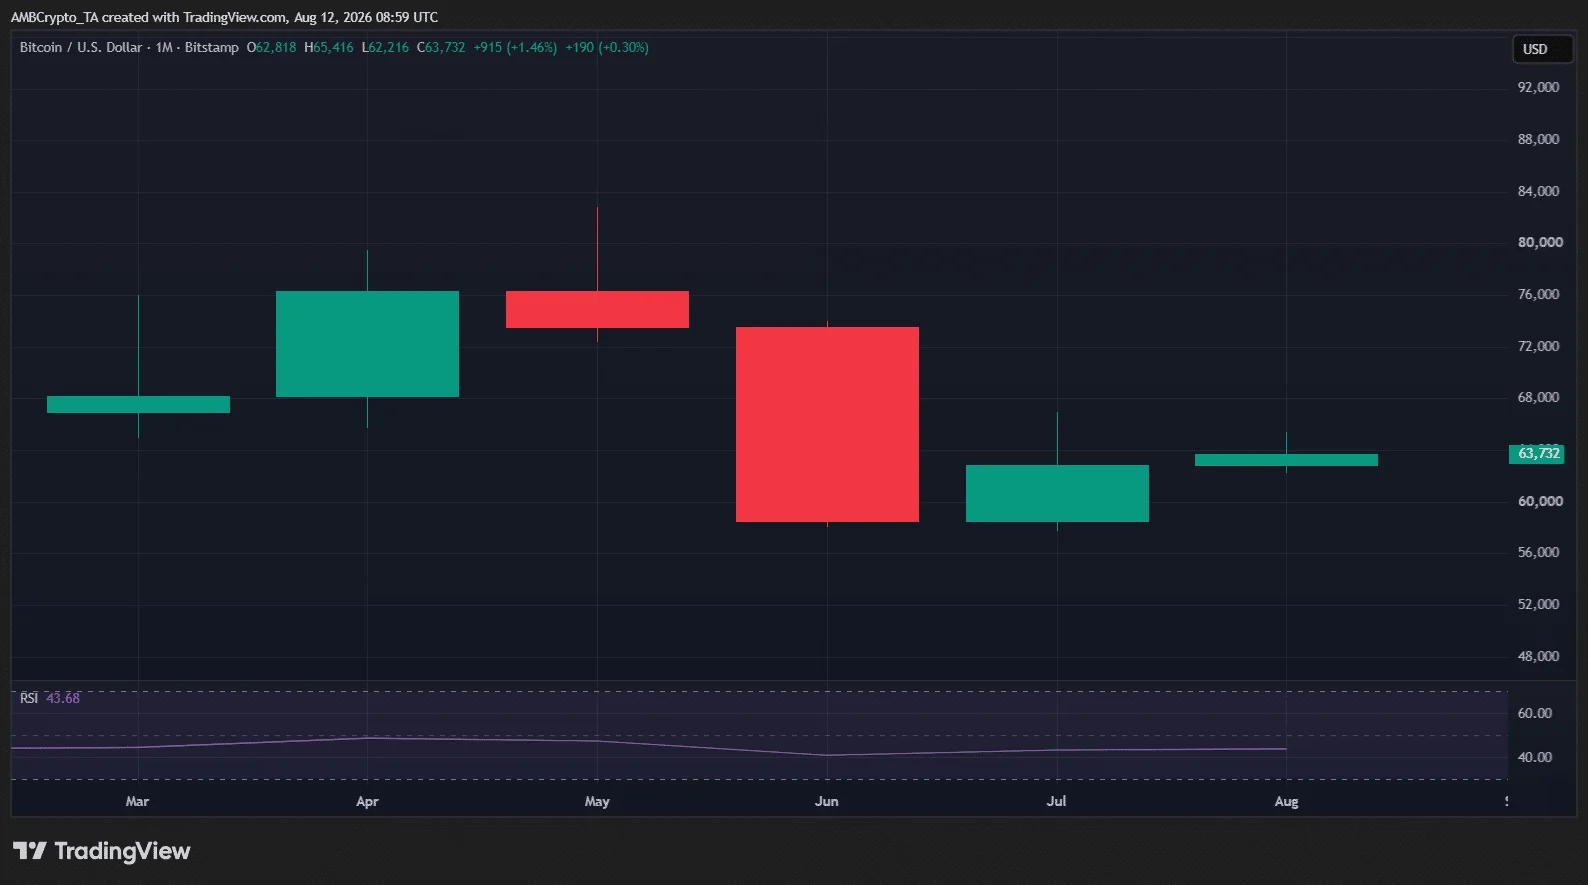
If this pattern repeats, Bitcoin could see a similar loss of momentum through the rest of Q3 and into Q4.
Notably, the on-chain data is already hinting at a similar setup.
Could rising Bitcoin Open Interest trigger another correction?
One analyst pointed out that while Bitcoin’s Open Interest continues to rise, spot demand remains weak. This suggests that the current price action is being driven more by leverage than spot buying, similar to what we saw during the March cycle.
If spot demand fails to pick up, a liquidity unwind could put BTC at risk of another late-Q2 style correction.
And when we look at Bitcoin [BTC] ETF flows and institutional positioning, the chances of this setup playing out don’t look far-fetched either.
U.S. buying pressure fades as Bitcoin ETF flows turn bearish
The lack of aggressive buying from the U.S.-based investors is putting BTC’s resilience to the test.
According to CryptoQuant data, Bitcoin’s Coinbase Premium Index has dropped over 160% this week alone, marking its sharpest decline in August so far. This shows that U.S. buying pressure is fading, which could make it harder for BTC to maintain its upside momentum, a trend further supported by Bitcoin ETF flows.
Despite the earlier Bitcoin ETF momentum, the trend now seems to be turning bearish.
As the chart below shows, Bitcoin ETFs have seen over $140 million in net outflow, marking the largest daily outflow of August so far. This suggests that institutional demand could be losing steam, adding more pressure on BTC as it tries to hold current levels.
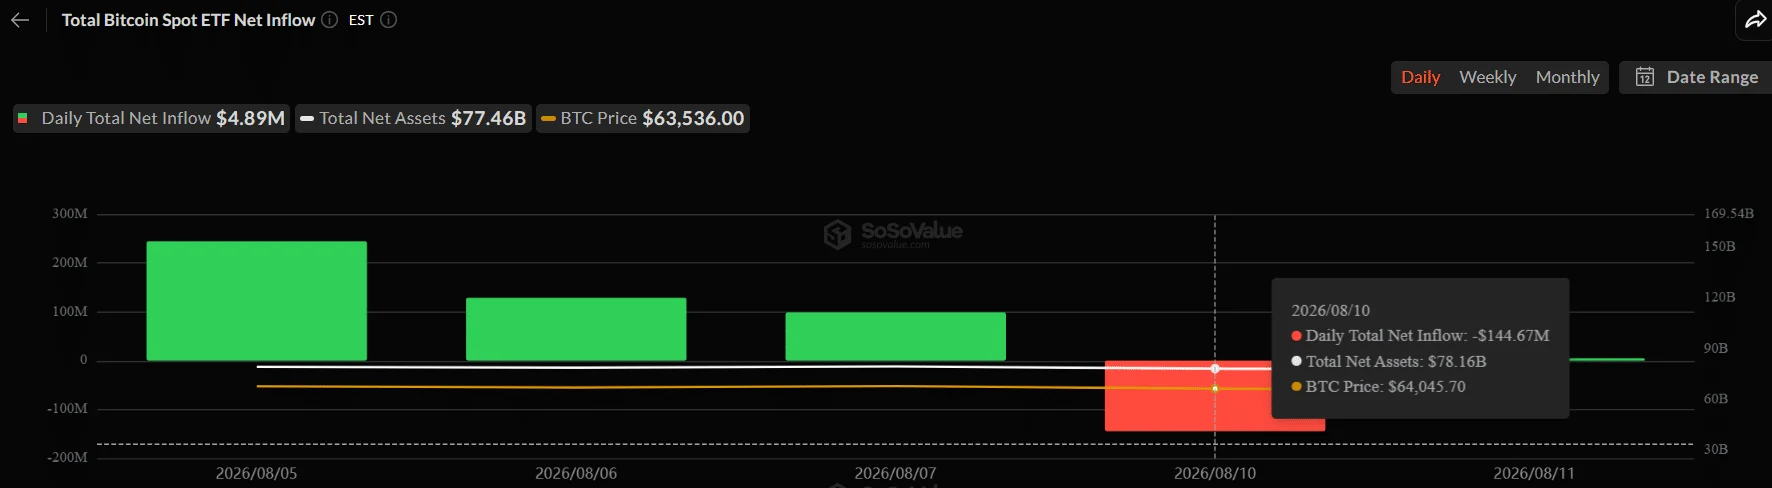
Given BTC’s technical setup, Bitcoin ETF flows may not be random after all.
With the current setup pointing to a potential repeat of the March and April style pullback, this positioning could be an early warning sign that Bitcoin may see another May and June style breakdown in August.
That makes Bitcoin ETF flows a key metric to watch as Bitcoin moves through one of its more challenging months.
Final Summary
- Bitcoin’s spot demand and U.S. buying are fading, while Open Interest remains high.
- Bitcoin ETF outflows are adding pressure, putting BTC at risk of late Q2 style breakdown.