
Artificial Superintelligence Alliance [FET] was not excluded from the broader crypto market’s decline over the past day.
At the time of writing, FET’s decline amounted to roughly 12%, and the intensity of the bears clearly continued to pressure the market in ways that show a likely tendency toward more downtrend.
However, there is still spot involvement, which could impact the outlook and skew it away from the bears.
Table of Contents
FET’s perpetual market bleeds capital
A clear capital outflow in FET’s perpetual market has sparked the decline witnessed recently.
The outflow saw a roughly 5% decline that brought Open Interest (OI) down to roughly $71 million, putting the market at major risk.
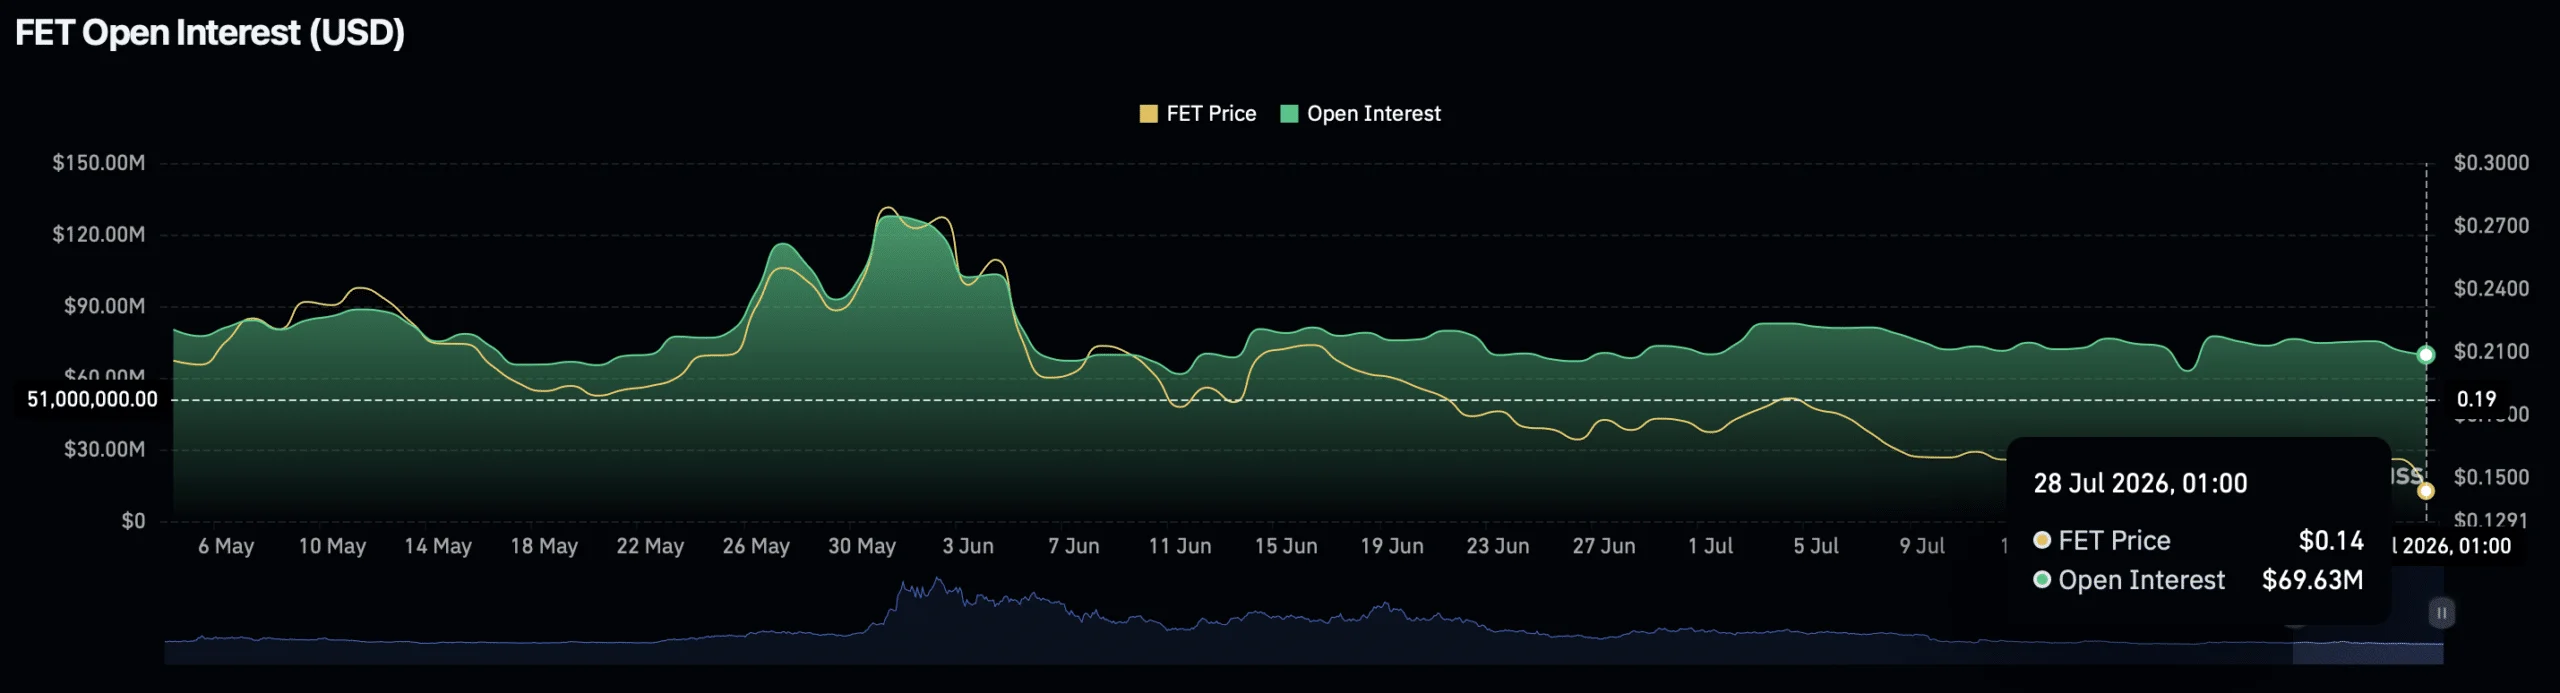
Strong market momentum is clearly driving the selloff, with volume spiking 97% from the previous day to $162 million.
The rise in volume at a time when price and open interest are simultaneously declining for an asset often suggests there will be more capital outflow ahead, as the bears continue to dominate the market.
Spot buyers keep accumulating FET
Spot traders in the market are not letting go easily, as the group of investors has continued to accumulate the token over the past day. At press time, spot market activity shows there was more buying than selling of FET across the market.
Net purchases over the last day amounted to $8.9 million, while net inflow dropped to a negative -$1.15 million, a figure that represents the difference between sales and purchases.
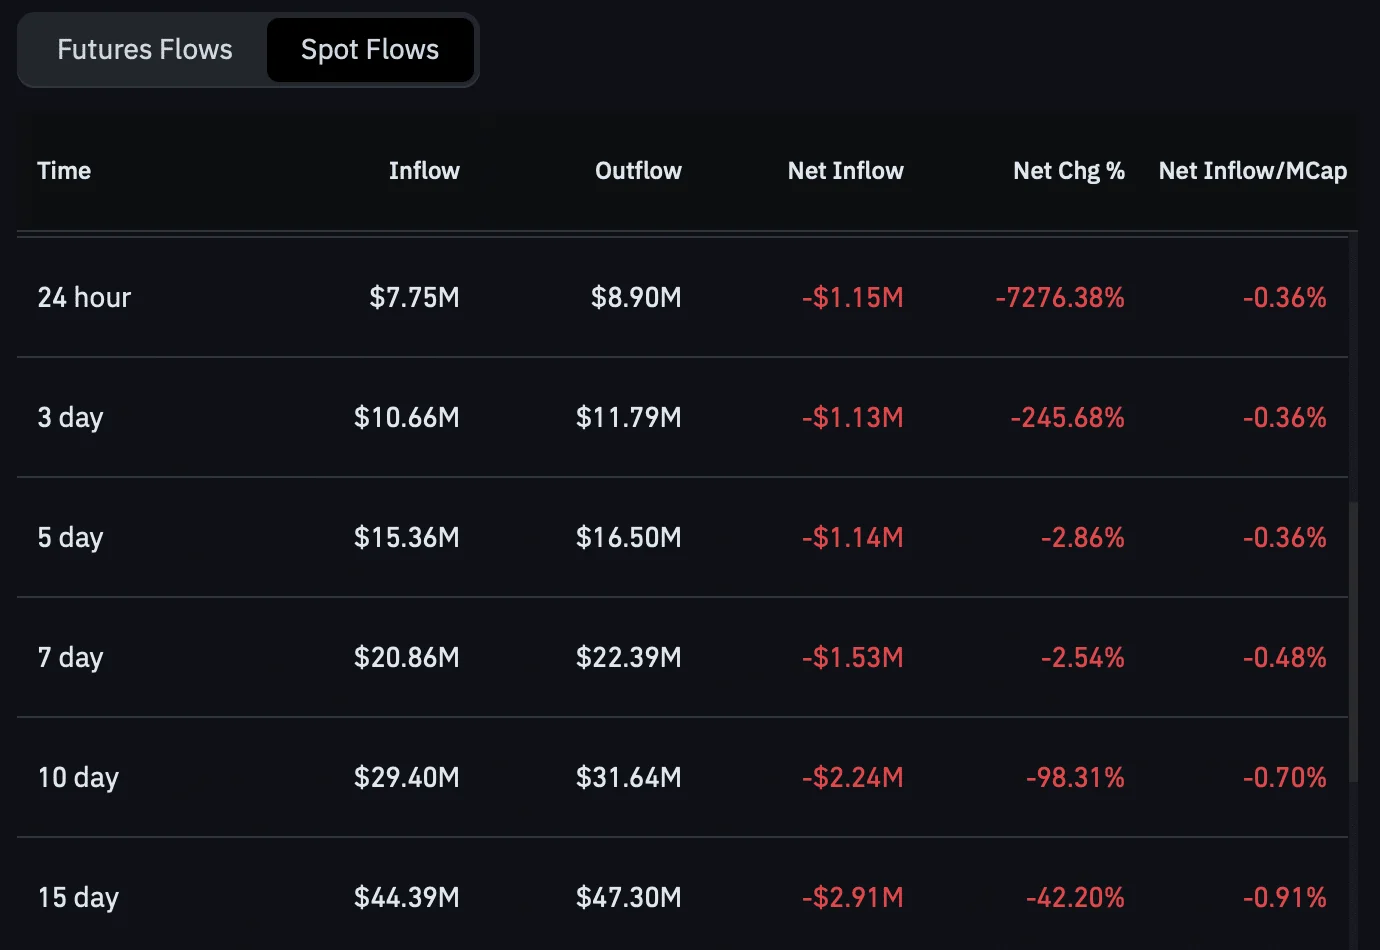
Buyers stepping up at a time when price declines this significantly often imply massive interest, and they see the recent decline as a discount for acquiring FET at a much lower price level. The accumulation trend has steepened into a clear pattern that has unfolded over several days now.
According to the netflow chart above, cumulative FET purchases have climbed to roughly $47.3 million worth of the asset in fifteen days, while the netflow confirms net buying at -$2.9 million.
The Long/Short Ratio in the perpetual market also hinted at more buy volume than sell volume on the account level, showing a reading slightly above 1.02.
Whale positioning points to more downside
All indicators show whales are responsible for driving FET lower than it would otherwise sit, as they likely deleveraged.
For context, over the past 24 hours, traders who stayed in long positions lost $1.13 million, while shorts recorded no losses.
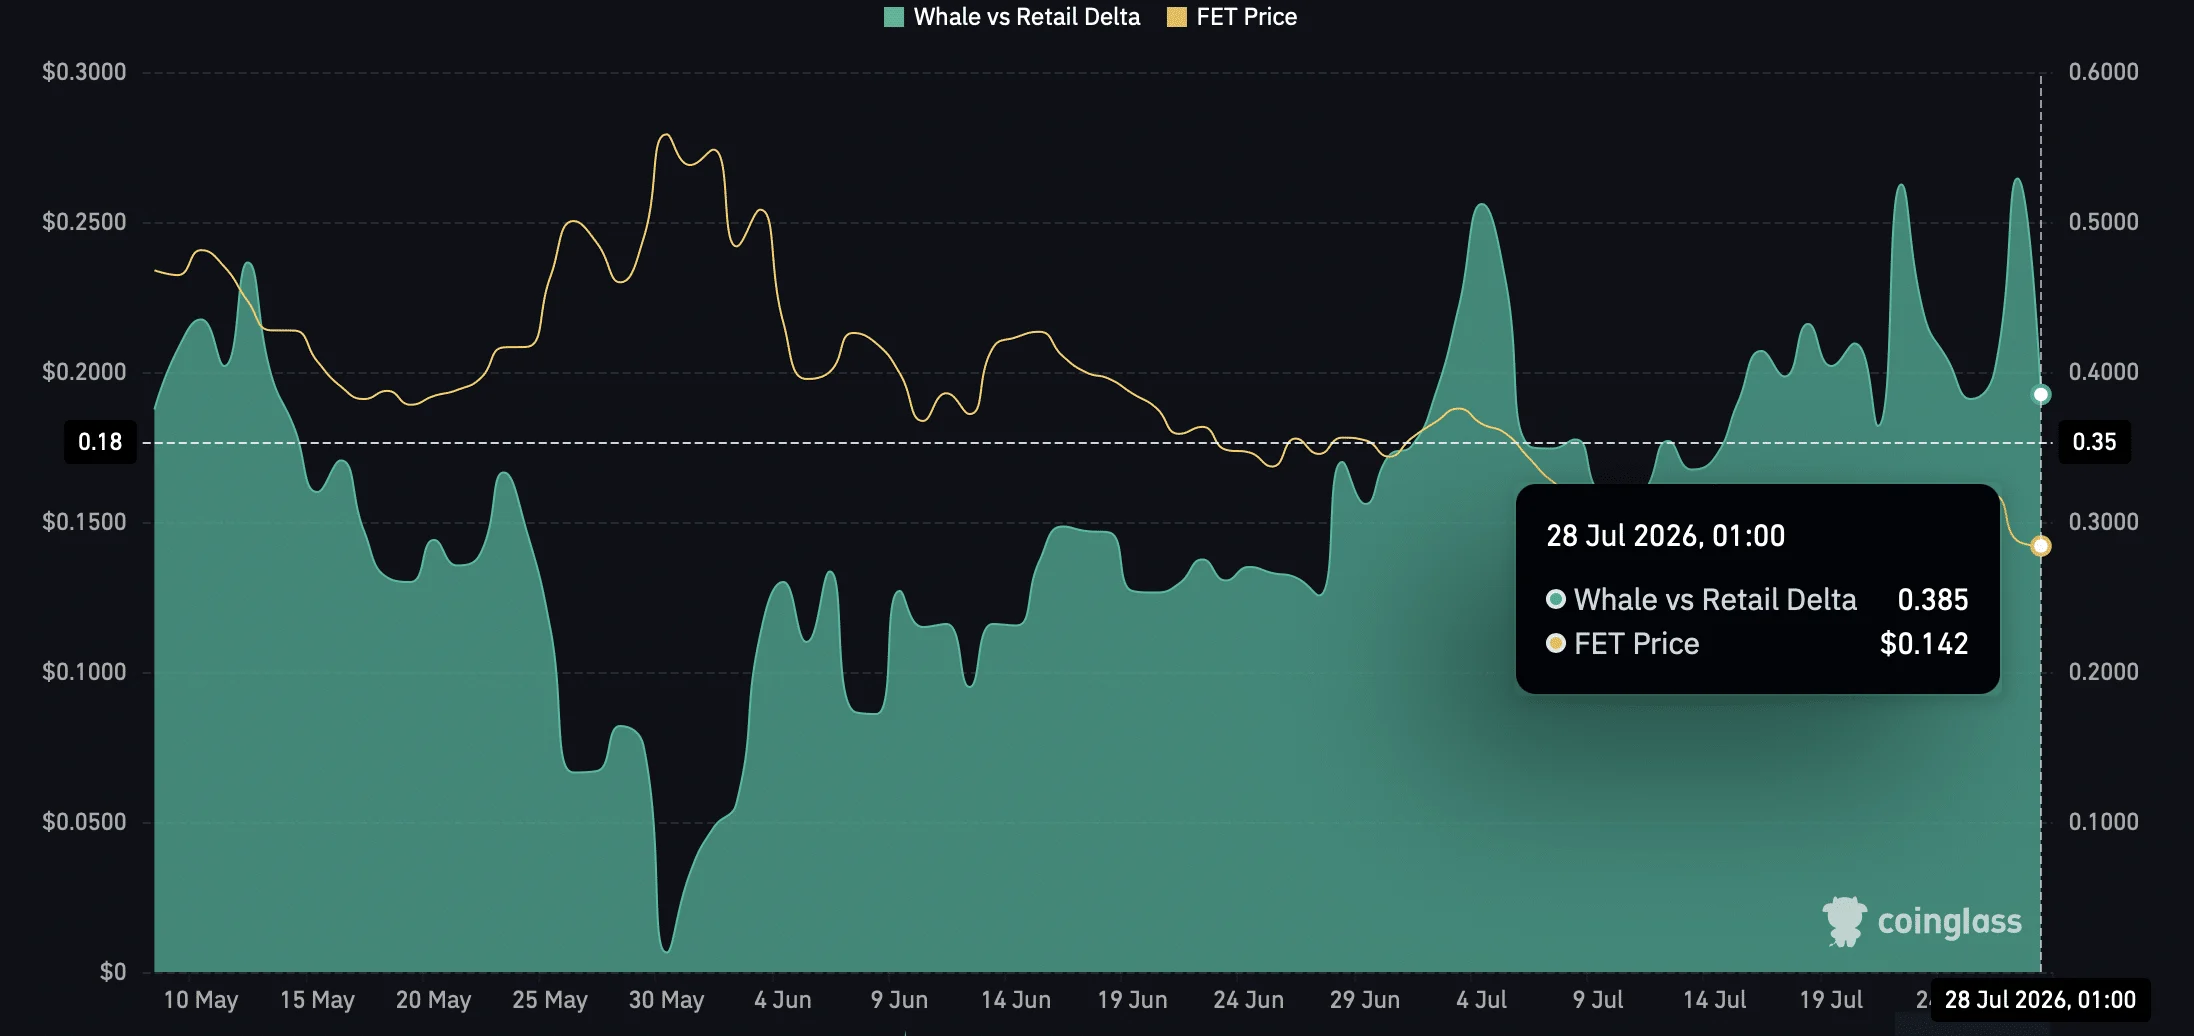
At the time of writing, the Whale/Retail Ratio surged to roughly 0.385 on the chart, indicating the group still maintains dominance.
Notably, the Funding Rate was extremely bearish, pointing to more risk of a downside as it confirms these whales are perfectly positioned for a selloff in the market.
Final Summary
- FET shed roughly 12% over the past day as a capital outflow in the perpetual market and a spike in selling pressure handed control to the bears.
- Spot traders leaned the other way and kept buying through the drop, a pattern that could soften the downtrend if the accumulation holds.