Home Blog Page 273

Polymarket takes next step in U.S. comeback with margin trading plan

0
Polymarket takes next step in U.S. comeback with margin trading plan

Prediction market Polymarket applied for a license to offer U.S. users margin trading, enabling them to place bets with less upfront capital, Bloomberg reported Thursday.

Polymarket’s U.S. affiliate, Coming Home GBA LLC, filed for a futures commission merchant license with the National Futures Association, Bloomberg said, citing a company representative. Polymarket will also require authorization from the Commodity Futures Trading Commission (CFTC) for changes to its rulebook that would allow trading without fully collateralized positions.

Prediction market platforms like Polymarket and Kalshi offer yes-or-no wagers on the outcomes of events, such as weather, sports and elections. Margin trading lets investors open positions with less upfront capital, a practice common in traditional markets. Kalshi received clearance to offer margin trading in March.

Polymarket’s application comes as prediction markets continue to grow. Volumes hit $51 billion last year and are on pace to reach about $240 billion in 2026. Wall Street broker Bernstein recently said it expects volume to rise to $1 trillion by 2030 as the sector evolves from niche wagering into wide-based “information markets” spanning sports, crypto, politics and the economy.


Source link

If you invested $10,000 in Bitcoin, Trump meme coin, and gold when Trump took office, here’s what you’d have today

0
If you invested $10,000 in Bitcoin, Trump meme coin, and gold when Trump took office, here's what you'd have today


January 20, 2025. Donald Trump walks back into the White House. Bitcoin is touching $109,000. Gold is steady at $2,697 an ounce. And a meme coin bearing the president’s name is a few days old and trading around $35, already down sharply from its launch peak of $74.

Six months on, those three assets have gone in three completely different directions. Here is what $10,000 in each one looks like today.

Bitcoin: $10,000 becomes $5,880

On inauguration day, Bitcoin opened around $102,000. A $10,000 investment bought roughly 0.098 BTC. Today, with Bitcoin trading near $60,000, that position is worth approximately $5,880, a loss of just over 41%.

The irony runs deep. Trump entered office as the most crypto-friendly president in U.S. history. He signed executive orders supporting the industry, established a Strategic Bitcoin Reserve, and pushed through the GENIUS Act for stablecoins.

Bitcoin still lost nearly half its value on his watch. Rising Treasury yields, institutional profit-taking, and selling pressure tied to Strategy’s $14 billion unrealized loss position have weighed heavily throughout his term.

Related: SpaceX moves Bitcoin amid possible market crash

Gold: $10,000 becomes $15,248

Gold was the quiet winner nobody put in their inauguration-day portfolio. At $2,697 per ounce on January 20, $10,000 bought 3.71 ounces. Today gold trades around $4,110, making that position worth approximately $15,248, a gain of about 52%.

The driver is everything Trump’s presidency brought with it: tariff wars, geopolitical tension, U.S.-Iran military strikes, and persistent inflation keeping the Fed cautious. Every time uncertainty spiked, gold climbed. The metal hit an all-time high of $5,597 in January 2026 before pulling back. For an asset dismissed as boring, it has been the standout trade of the cycle.

Trending on TheStreet Roundtable

Trump Coin: $10,000 becomes $430

The TRUMP meme coin launched two days before inauguration day and peaked at $74.27 within 48 hours. By January 20 it had already crashed to around $35. A $10,000 investment bought roughly 285 coins. Today those coins are worth approximately $430, a loss of 96%.

Nearly one million people bought the coin. Analytics firm Nansen found that their combined losses total $3.81 billion. Trump himself cleared more than $635 million from the same token. The trade worked out for one side of the table.


Source link

Rebound or liquidation? SOL at a make or break point!

0
Rebound or liquidation? SOL at a make or break point!


Solana [SOL] traders are openly losing confidence in the market. However, another set of long positions may still be open. Hence, the question: Will SOL rebound or fall and experience further downside?

Solana sentiment and trading activity at YTD lows

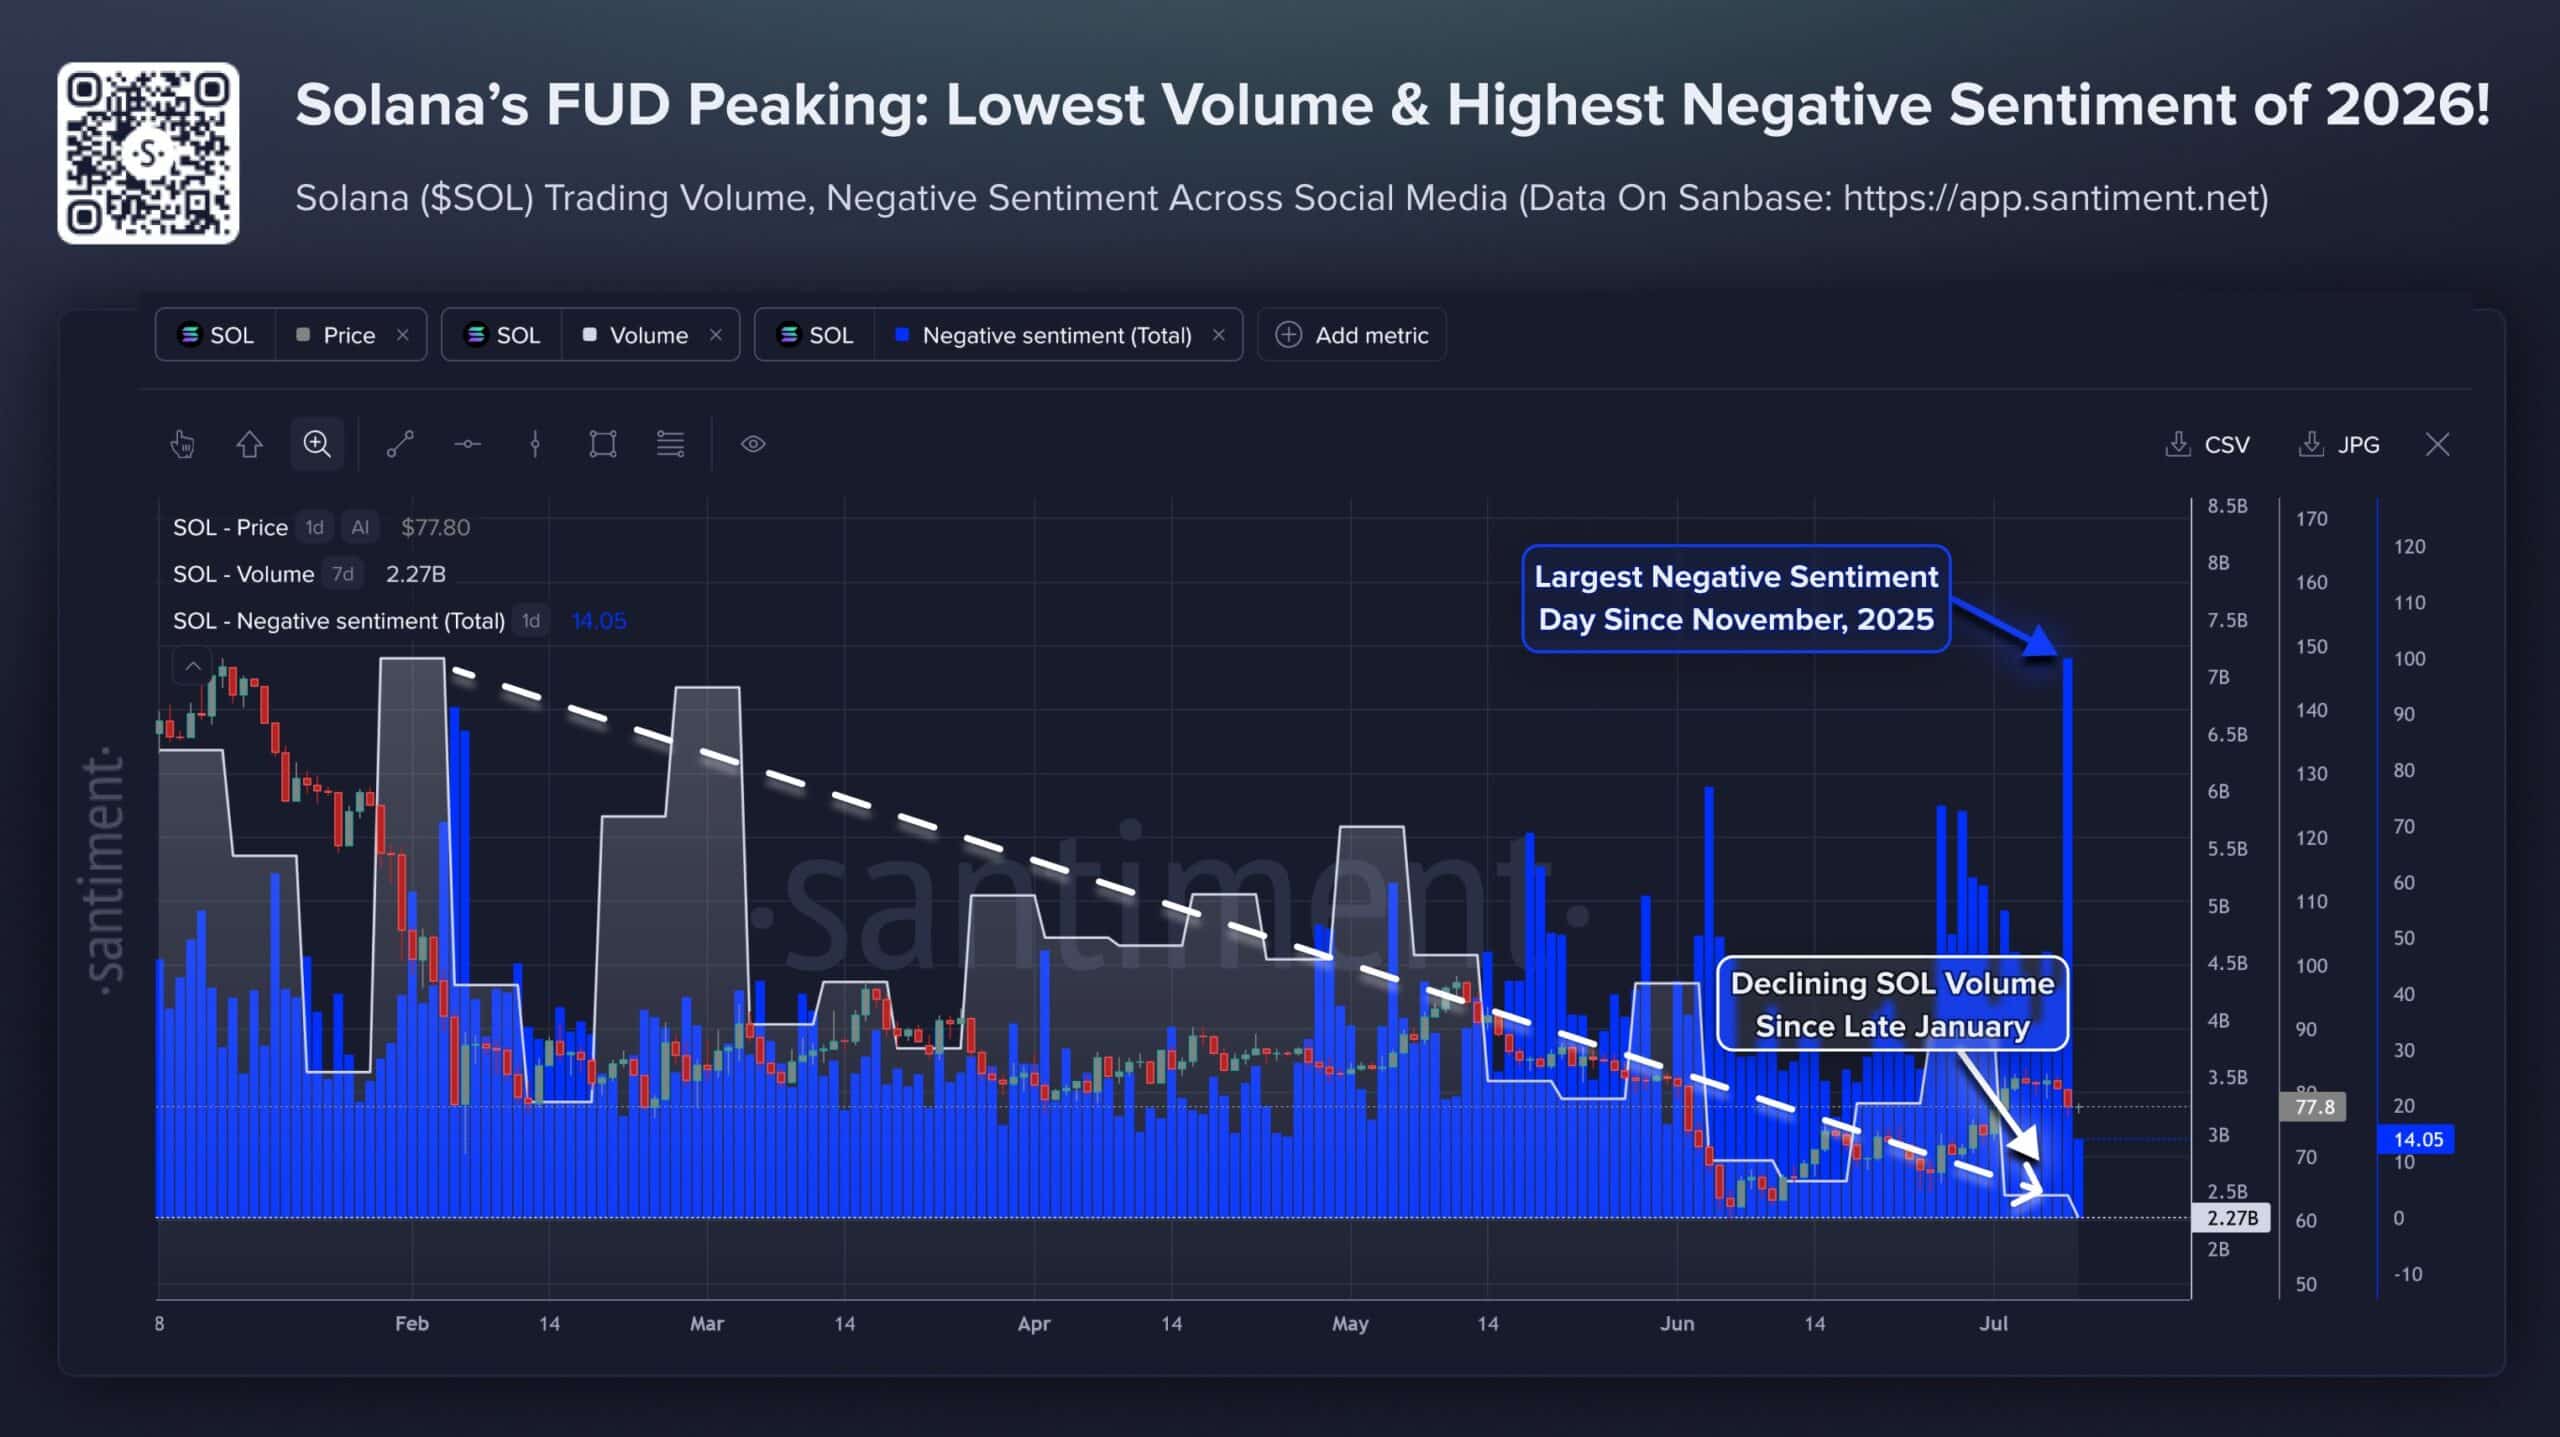
At the time of writing, SOL’s trading volume had fallen to around $2.27 billion – Its lowest level in 2026. Meanwhile, the negative sentiment score also shot up to 14.05.

This has been the biggest wave of negativity around the token since November 2025.

solana
Source: Santiment Intelligence

Much of the frustration comes from the gap between Solana’s growing ecosystem and its price performance. Despite pickup around the tokenized stocks and RWA narratives, traders are yet to see light.

Note that extreme negativity can sometimes make room for an unexpected move up. As it stands, even a modest return of demand could lead to a positive price move.

There’s a catch though!

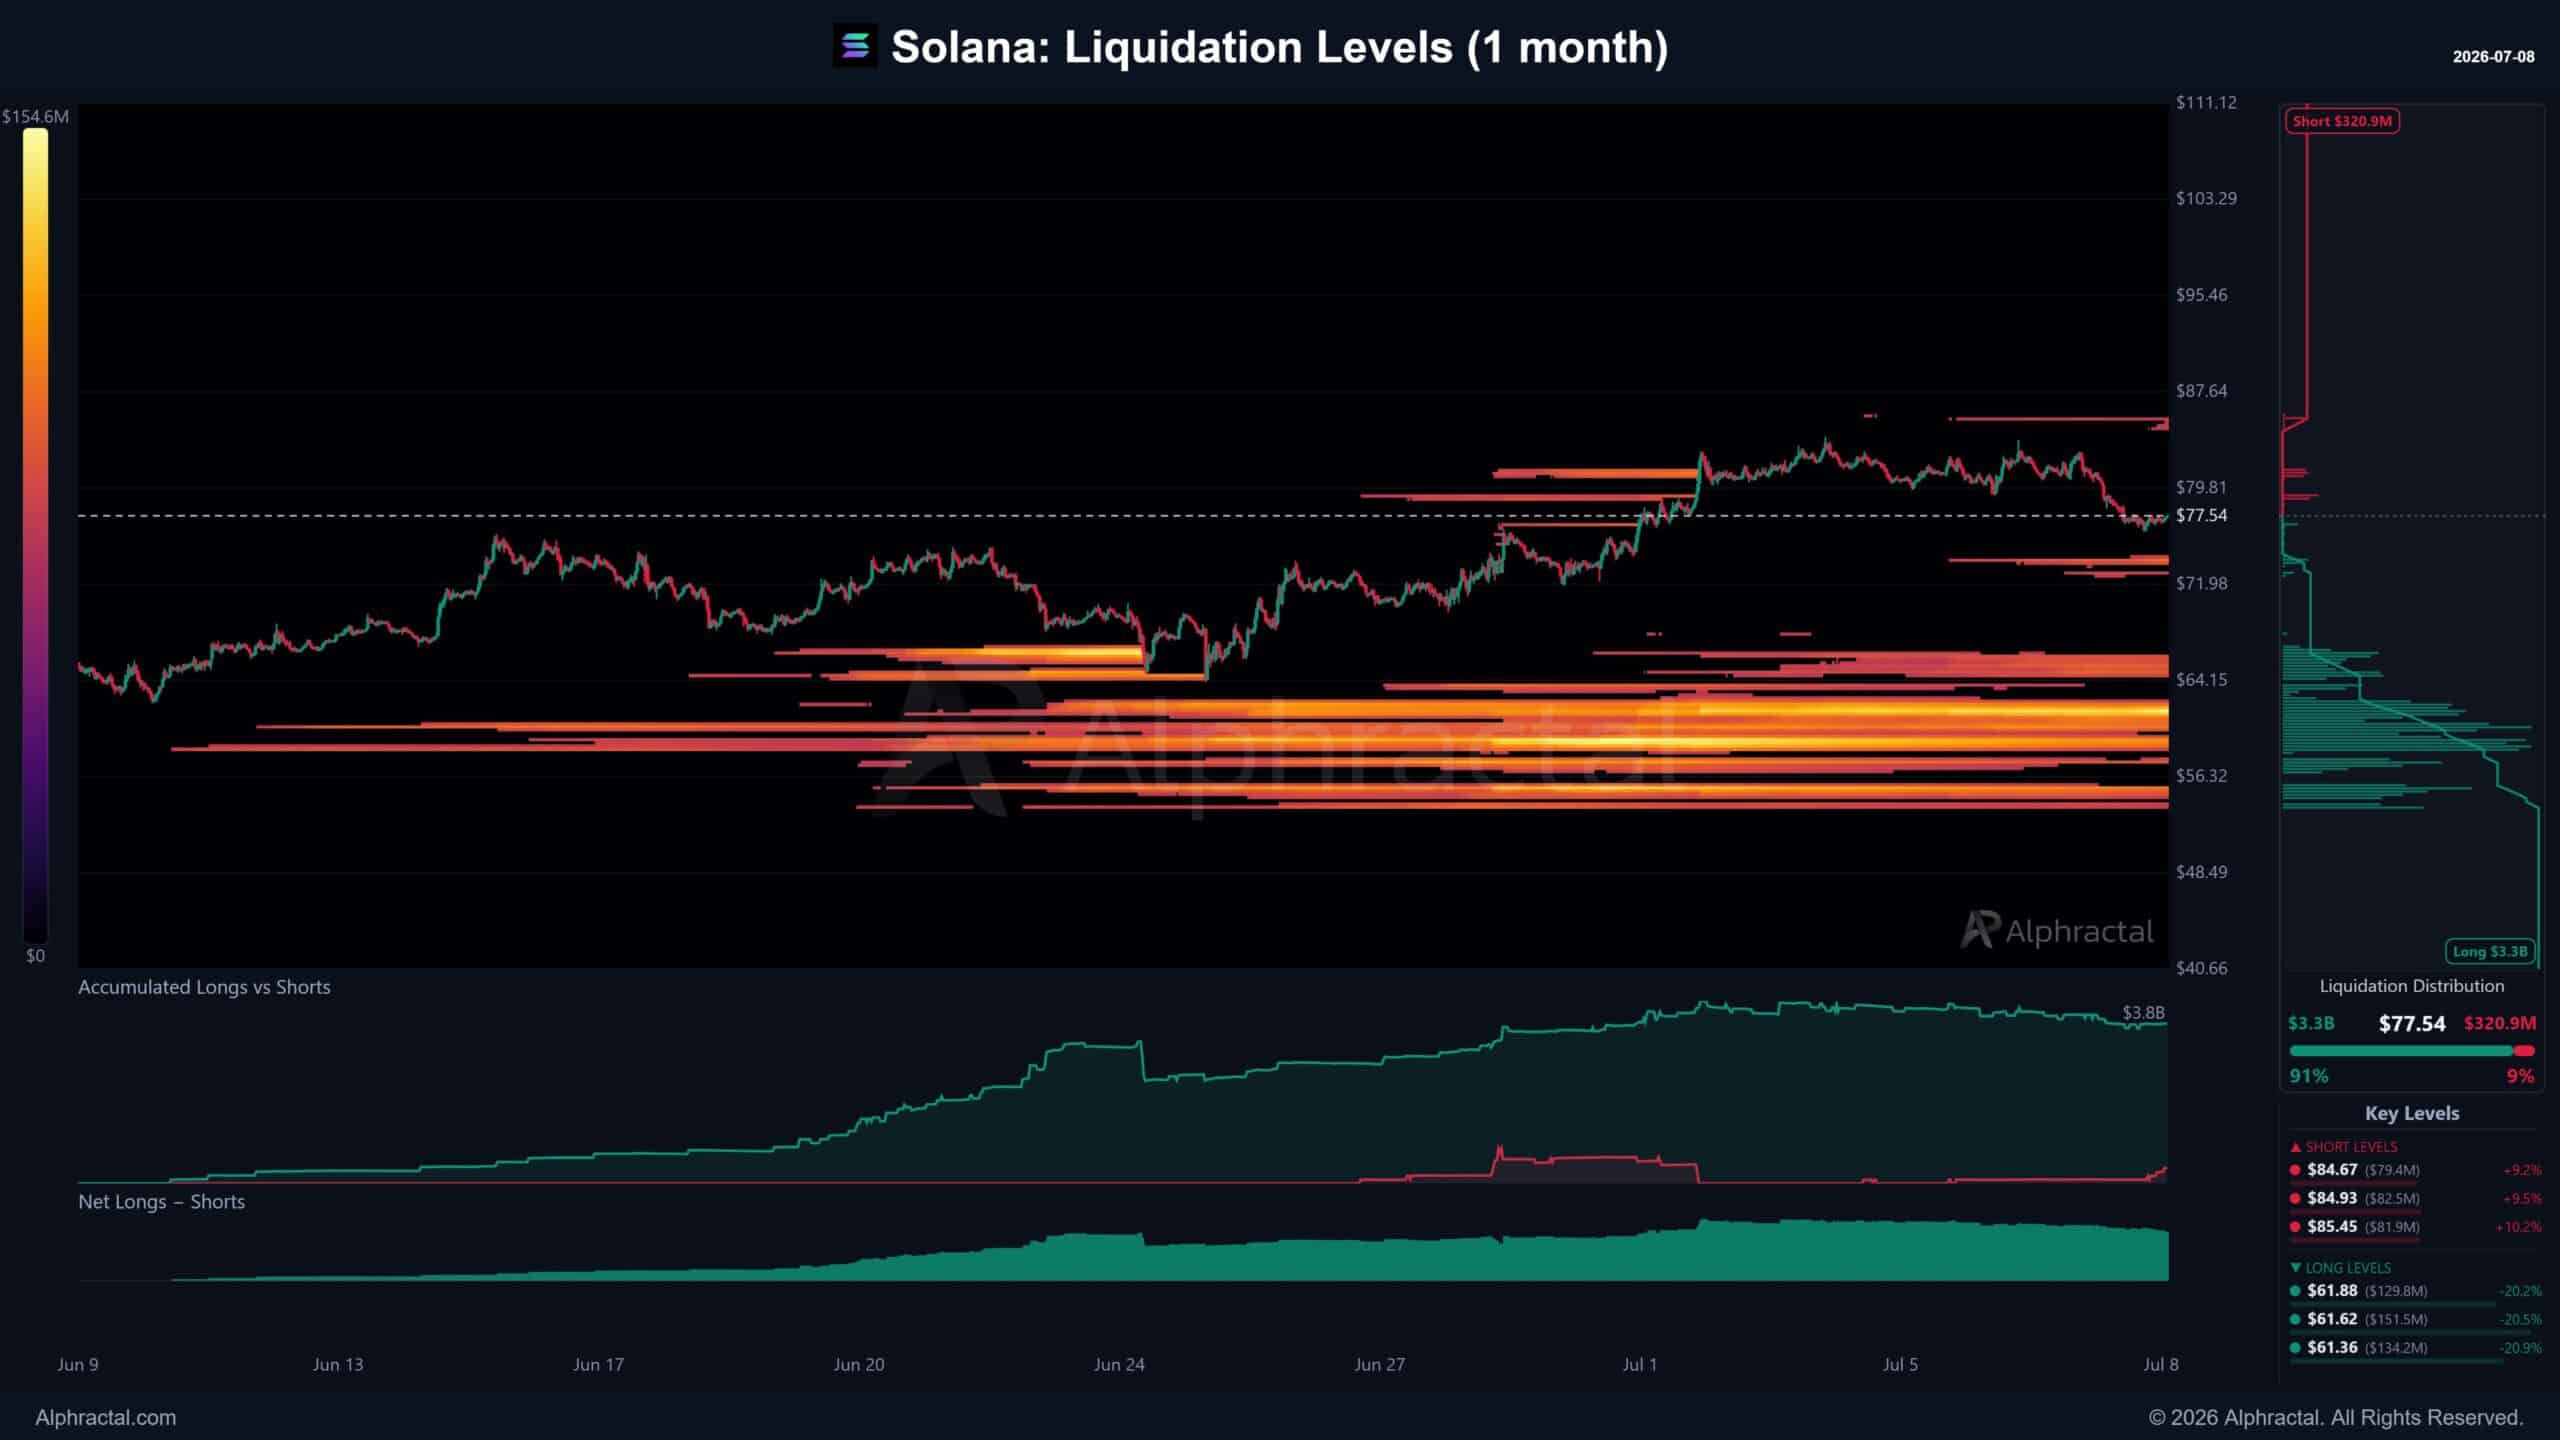
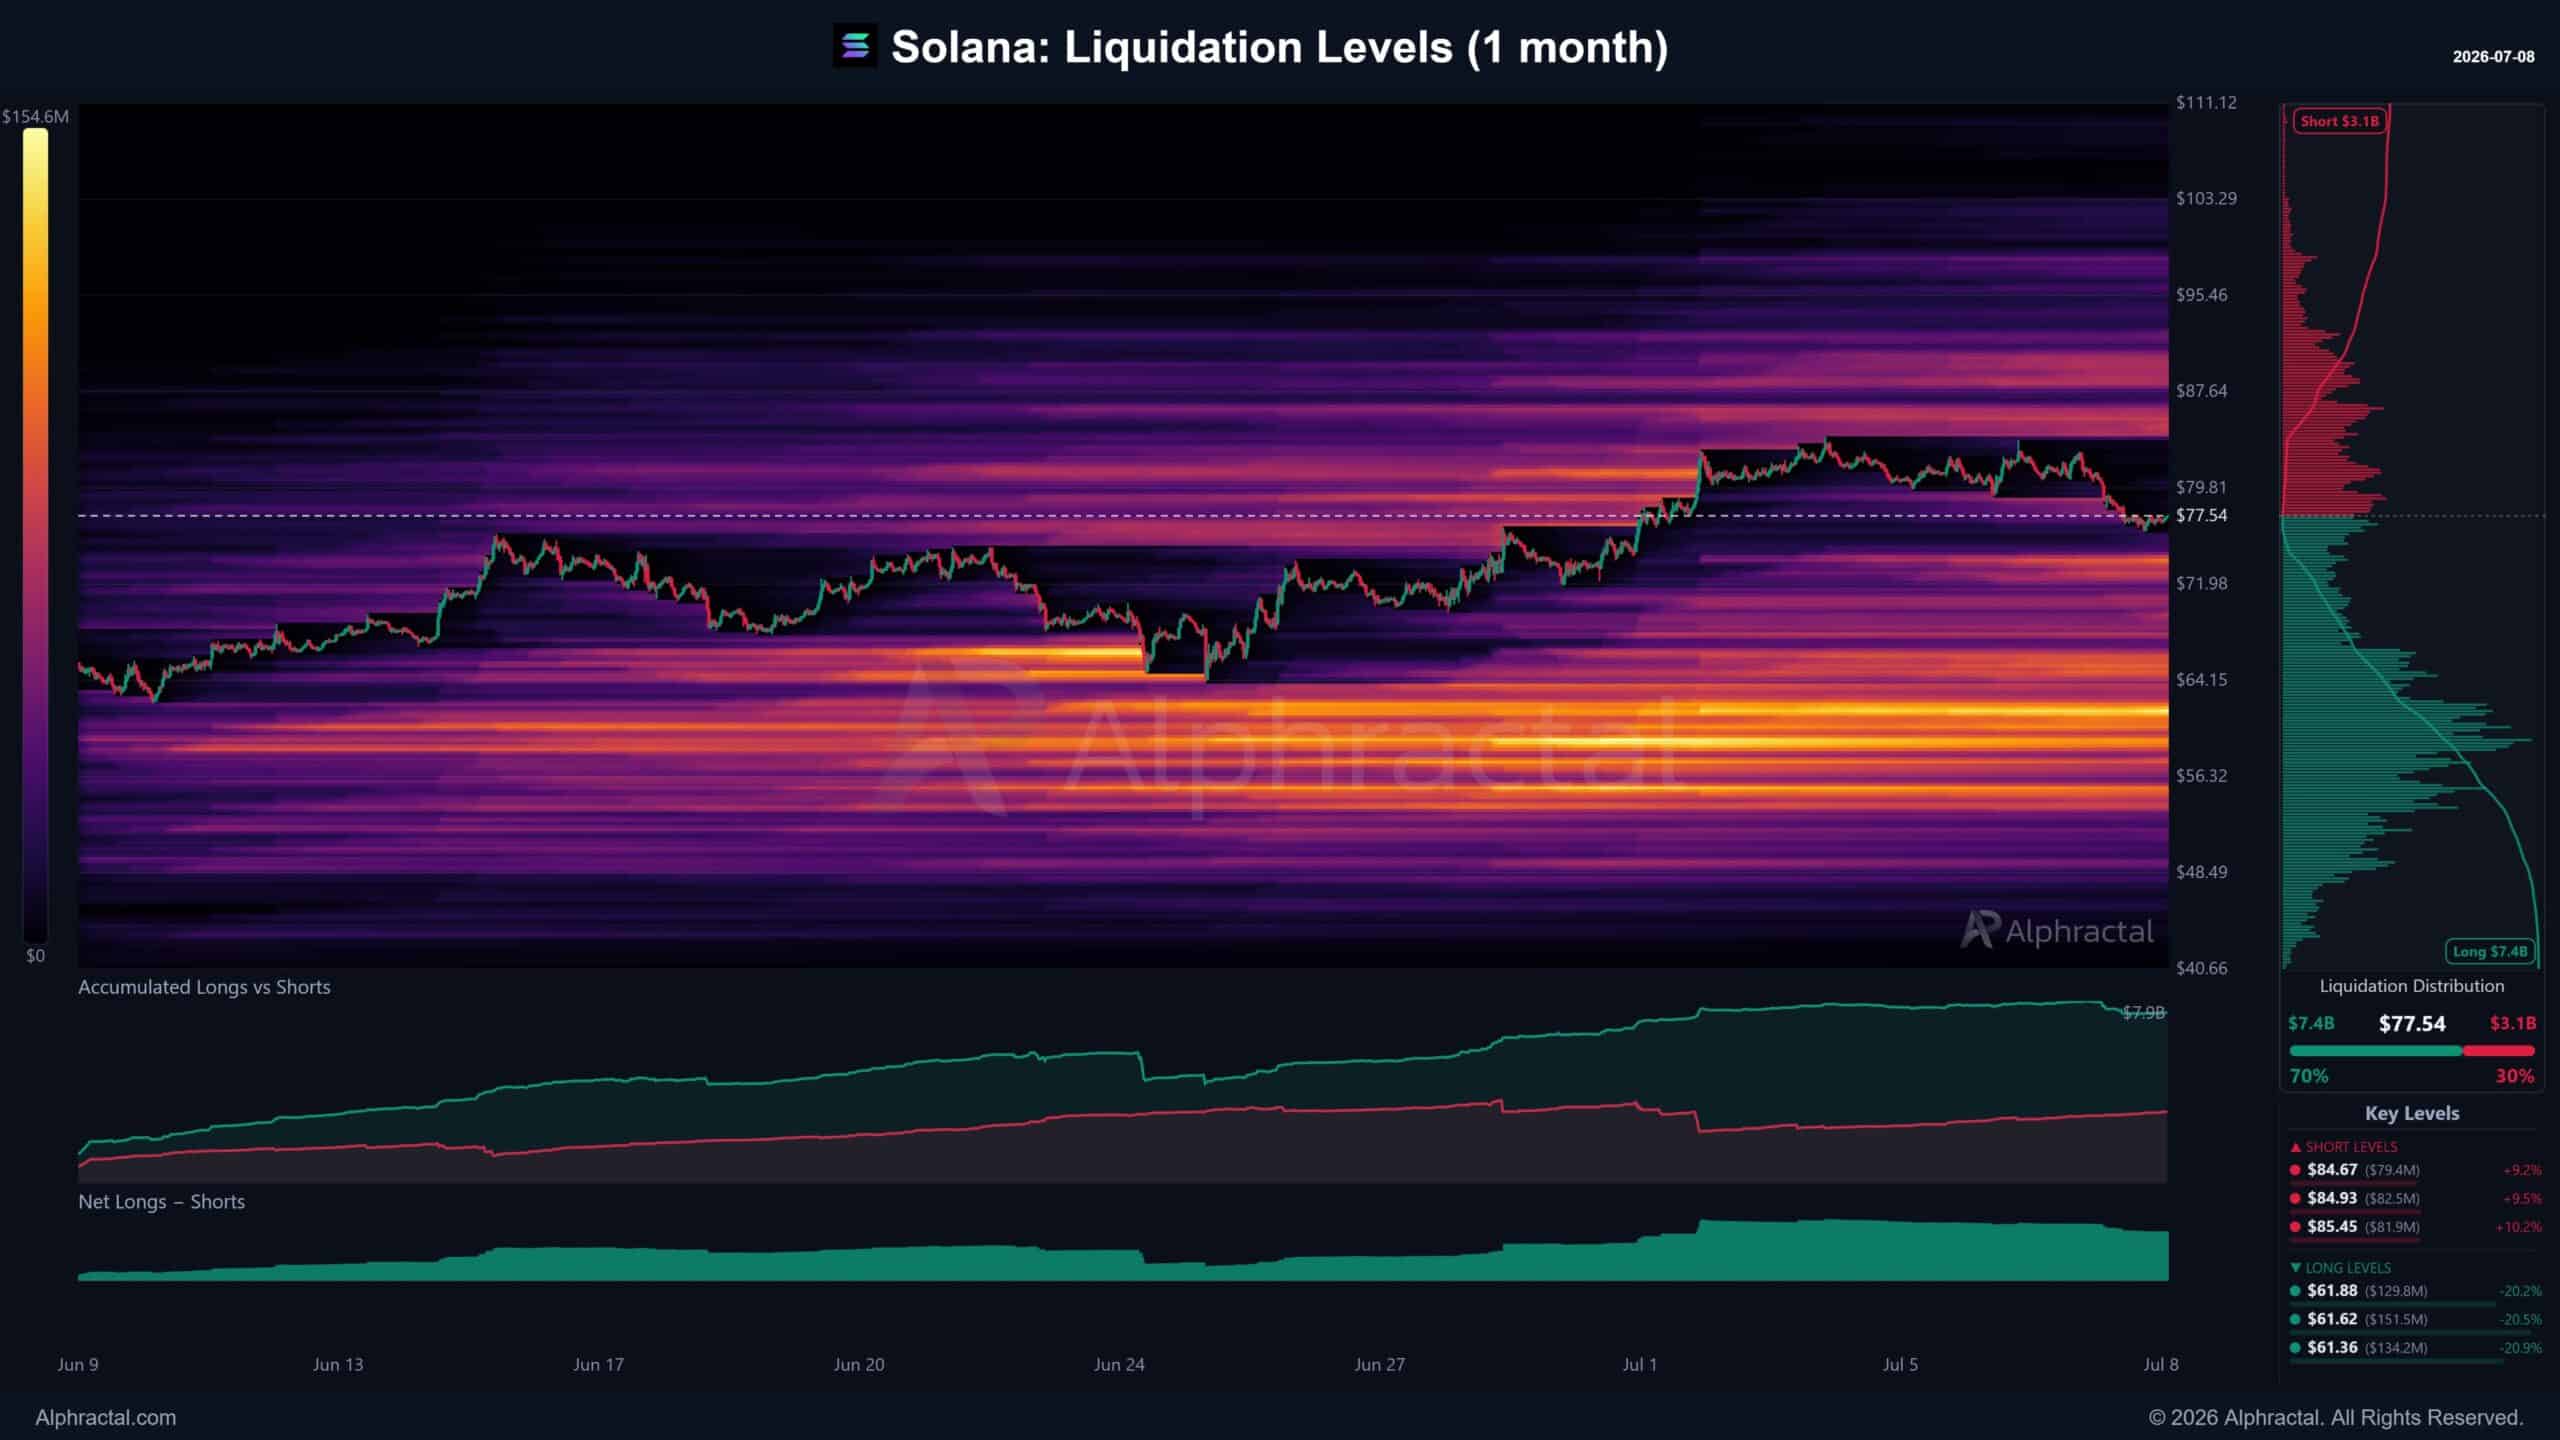
Solana’s derivatives market did seem inclined towards long positions though. In fact, the liquidation map showed around $7.4 billion in long exposure, compared to roughly $3.1 billion in shorts.

solanasolana
Source: Alphractal

The largest long liquidation cluster was at around $61-$62, roughly 20% below the press time price.

solanasolana
Source: Alphractal

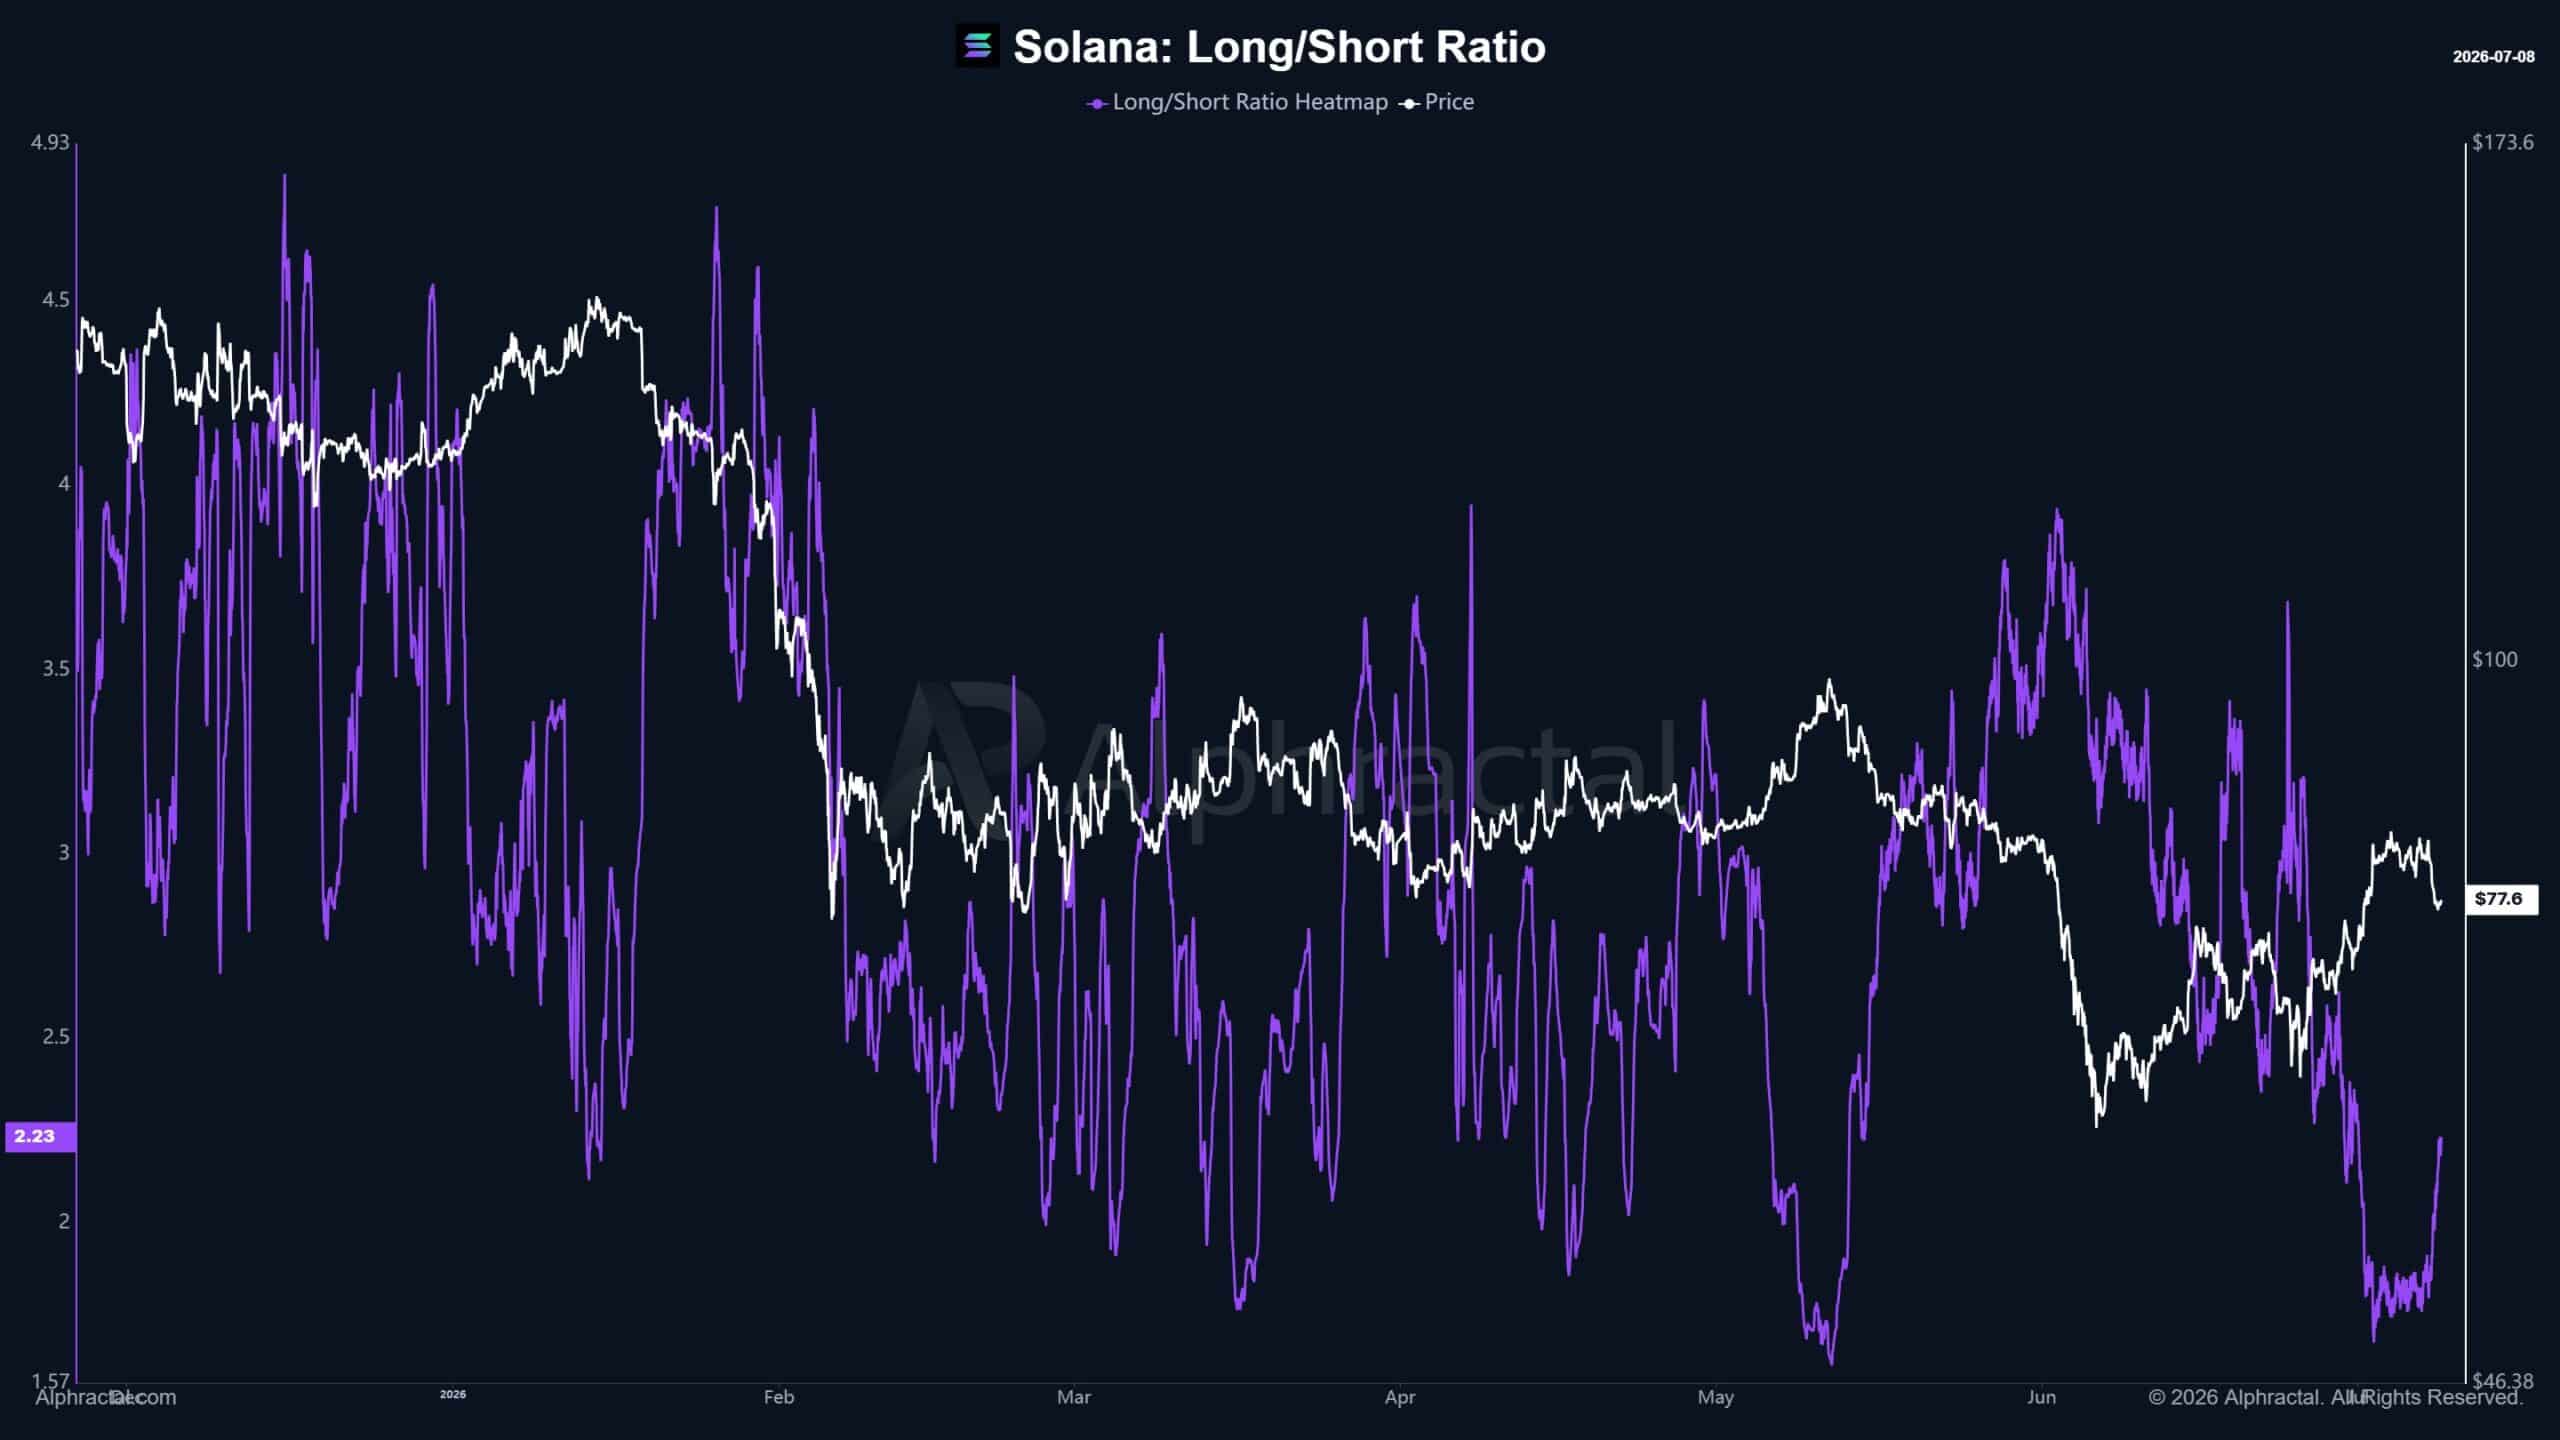
Meanwhile, the long/short ratio across major exchanges had started recovering and was near 2.23 at press time. Traders appeared to be bullish again.

ethereumethereum
Source: Cryptoquant

Now, none of this guarantees a sell-off. However, if SOL drops, crowded long positions could add to the pressure.

SOL holds, but the bullishness is starting to cool

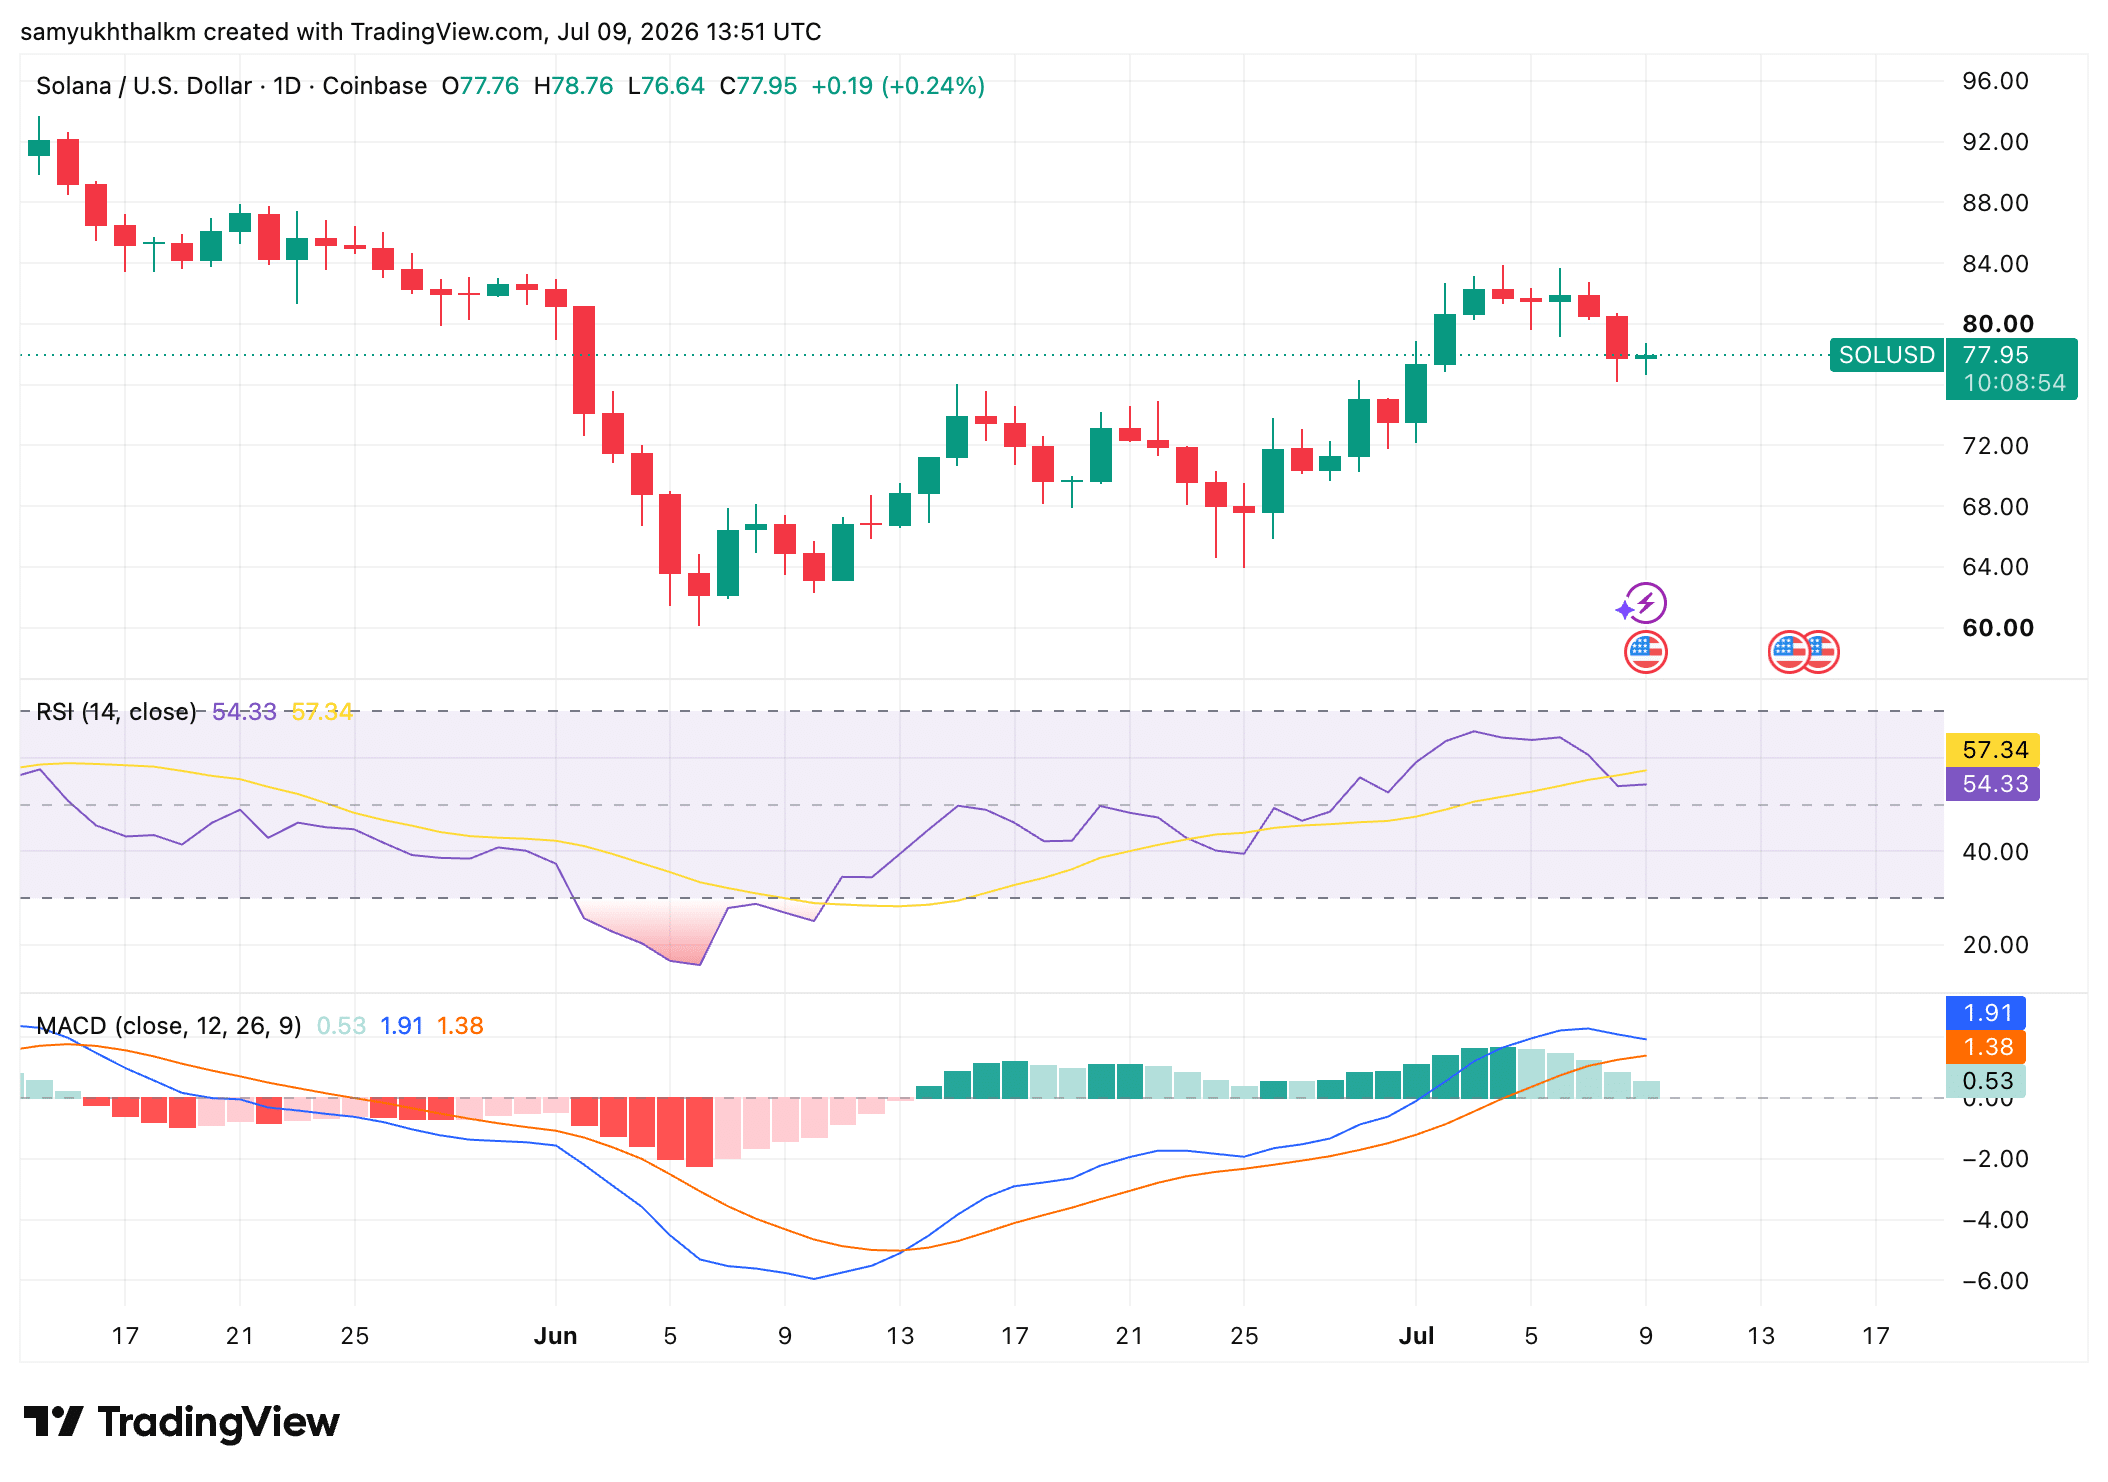
Despite the heavy long positioning, Solana’s price chart seemed to give way to hope. SOL was trading near $77.95 at the time of writing. It had recovered from its June lows and was testing the $82-$83 area.

The RSI was in neutral territory rather than an overbought market. The MACD was also positive, with the MACD line at 1.91, above the signal line at 1.38.

solanasolana
Source: TradingView

However, the upward pace appeared to be slowing down.

A move back above the recent highs may be needed to rebuild confidence. Until then, crowded long positions could be a risk.


Final Summary

  • SOL’s trading volume and negative sentiment are now at their worst levels of the year.
  • Downside risk was also relatively higher at press time.


Source link

Bitcoin’s gets bullish signal from MACD. Next stop above $70,000?

0
Bitcoin's gets bullish signal from MACD. Next stop above $70,000?


Traders typically do not rely on a single indicator to determine market trends. But this particular MACD has proved reliable as a standalone gauge through the price crash from the record high of $126,000. Since October, negative crossovers have reliably marked the start of steeper declines, while positive crossovers have preceded meaningful recovery rallies – including the December–January bounce and the February–May bounce.

The latest bullish crossover therefore points to a notable bounce ahead, though not necessarily the start of a full-blown new uptrend. That bigger move would need more confirmation, which is why the key resistance levels below are now in focus.

Key levels ahead

The first level to watch is the 50-day simple moving average, currently around $65,434. This is simply the average bitcoin price over the past 50 days (roughly two months).

Traders in both crypto and traditional markets watch this line closely to gauge near-term momentum. A clear move above it is often seen as a sign that upside strength is building.

The second key level is $67,292, which was the mid-June high. This is where bitcoin staged a brief recovery from early June lows near $60,000, only for sellers to step in aggressively. That resistance turned the price lower again. Breaking above $67,292 would be another win for buyers, showing they have overcome the previous area of strong selling pressure.


Source link

RUN Stock Alert: What to Know as Sunrun Unveils AI Data Center Pilot

0
RUN Stock Alert: What to Know as Sunrun Unveils AI Data Center Pilot


3D Graphics Concept Big Data Center by Gorodenkoff via Shutterstock

Sunrun (RUN) remained in focus on July 8 as the company officially entered the edge computing space with a distributed artificial intelligence (AI) data center pilot program. 

The initiative places compute nodes directly into customer homes equipped with Sunrun solar and battery networks to handle AI inference workloads.

More News from Barchart

The announcement arrives at a time when investors desperately need a reason to stick with RUN stock, which is down about 36% year-to-date as of writing. 

www.barchart.com

What the Pilot Program Means for Sunrun Stock

The new pilot program shifts AI workloads from massive data centers into residential properties, utilizing Sunrun’s expansive infrastructure of more than 1.1 million solar and battery storage systems. 

By installing localized compute nodes inside customer homes, the clean energy company will sell modular artificial intelligence inference capacity directly to enterprise buyers. 

This unique decentralized layout leverages existing home batteries for backup power, enabling data processing to continuously run through local blackouts. 

For homeowners, the initiative acts as an economic incentive, offering financial compensation for hosting the nodes.

Meanwhile, Sunrun shares will benefit from a new high-margin revenue stream, given McKinsey estimates AI inference demand to grow at a compound annualized rate of a whopping 35%.

Is It Worth Buying RUN Shares Today?

RUN’s initiative effectively bypasses the lengthy grid interconnection queues and land acquisition bottlenecks that plague traditional data center buildouts.

Plus, it complements the company’s recent 16-gigawatt clean energy partnership with Tesla (TSLA) and Renew Home as well. 

If this multi-month pilot hits its milestones, it could transform Sunrun stock from a pure-play solar utility into a notable picks-and-shovels AI infrastructure name. 

Investors should also note that RUN is currently trading at a forward price-to-earnings (P/E) ratio of nearly 12x, which represents a meaningful discount not just to its historical multiple, but to its rivals like Enphase Energy (ENPH) as well. 

What’s the Consensus Rating on Sunrun?

Crucially, Wall Street analysts remain convinced that RUN shares’ year-to-date decline has gone a bit too far.


Source link

Harry Styles fans flew to Amsterdam, paid a 21% premium for hotels—and sent inflation soaring

0
Harry Styles fans flew to Amsterdam, paid a 21% premium for hotels—and sent inflation soaring

Inflation has remained stubbornly elevated across the United States and Europe, driven by everything from energy costs to geopolitical tensions in the Middle East. But in the Netherlands, central bankers pointed to an unlikely contributor: a Harry Styles concert residency that sent thousands of Gen Z and Millennial fans rushing to Amsterdam.

The pop superstar’s Together, Together tour made Amsterdam its only mainland European stop, with a 10-day residency between May 16 and June 5. The concerts drew fans from across Europe—and even the United States—fueling a surge in demand for hotel rooms.

In May alone, hotel prices in the Netherlands surged 21% on average, contributing 0.4 percentage points to the country’s monthly inflation rate—more than half the increase from April, according to Bas ter Weel, director of monetary affairs at the Dutch central bank. Overall inflation rose from 2.8% in April to 3.5% in May.

The spike was notable enough that the European Central Bank, led by Christine Lagarde, cited “concert-related hotel prices in the Netherlands” when discussing the acceleration in services inflation, though it did not mention Styles by name. The comments came ahead of the ECB’s June decision to raise its benchmark interest rate by 0.25 percentage points to 2.4%.

Other blockbuster tours—including those by Bruce Springsteen and Taylor Swift— have delivered noticeable boosts to local economies across Europe. But ter Weel said Styles’ residency produced one of the largest tourism-driven price spikes the Netherlands has seen in years. 

“Harry Styles really breaks everything,” ter Weel told Dutch radio outlet BNR.

Gen Z spent thousands on hotels—and even houseboats—but proved their economic might

The surge in hotel prices was most apparent to young fans scrambling to find affordable places to stay. Some concertgoers, lured by some ticket prices dropping to as low as €50 ($57), quickly discovered that getting into the show was far cheaper than finding a place to sleep.

One TikTok user said she and her friend ended up spending 10 days on a canal houseboat—and were forced to shower offsite—after hotel prices climbed beyond her budget.

“When you secured the Harry opening night tickets but couldn’t afford an Amsterdam hotel,” she wrote.

Another fan posted on TikTok that she paid €900 (about $1,030) for five nights in what she described as a tiny “box” of a room.

The sticker shock reflects a broader spending pattern among younger consumers. One-third of Gen Z have said they believe they’ll never own a home—and many expect to delay or forgo other traditional milestones—but they’ve continued to prioritize experiences such as travel and live music, even as costs rise. At the same time, the generation has struggled significantly with financial literacy, scoring the lowest among all age groups in TIAA’s most recent financial literacy report.

Still, splurging on a concert trip doesn’t necessarily mean young people are neglecting their finances outright. Separate research has found the average Gen Zer began saving for retirement roughly 15 years earlier than baby boomers, suggesting many are balancing long-term financial planning with spending on experiences they value. 

Ter Weel said there are two sides to the story from an economic standpoint. While the surge in hotel prices temporarily lifted inflation, it also boosted economic activity. Likewise, while many fans may have spent more than planned on the trip, the episode underscores how Gen Z’s spending power can have an outsized impact on the broader economy.


Source link

Live updates: Bitcoin ETFs bleed again while ether funds snap a five-day inflow streak

0
Live updates: Bitcoin ETFs bleed again while ether funds snap a five-day inflow streak

U.S. spot bitcoin ETFs lost a net $95 million on Thursday, per SoSoValue data, while ether ETFs shed about $52 million, ending a five-day inflow run that had been the steadier side of the market.

Fidelity’s FBTC drove the bitcoin outflow with roughly $63 million, followed by ARKB at about $40 million. BlackRock’s IBIT was flat, neither adding nor losing money, and VanEck’s HODL and Morgan Stanley’s MSBT were the only funds in the green. Total bitcoin ETF assets sit near $77 billion.

Ether’s reversal was broader. Fidelity’s FETH lost about $34 million and BlackRock’s ETHA roughly $13 million, with Bitwise and BlackRock’s second fund also negative. No ether fund posted an inflow, and net assets held at about $9 billion.

The flows are lagging the tape. Bitcoin rose 3.5% on Friday to nearly $64,000 and is up 4.2% on the week, recovering everything it lost when Trump warned that strikes on Iran could intensify.

Ether added 2.6% to $1,760. The rally came out of Asia, where South Korea’s Kospi jumped 4% on renewed AI-demand optimism and SK Hynix priced $26.5 billion of American depositary shares.

Institutional money has now sat out most of a month in which bitcoin has traded between roughly $59,000 and $66,000 without breaking either way.


Source link