Home Blog Page 355

Crude Oil Prices Finish Sharply Lower on US-Iran Peace Hopes

0
Crude Oil Prices Finish Sharply Lower on US-Iran Peace Hopes


July WTI crude oil (CLN26) on Tuesday closed down -3.10 (-3.40%), and July RBOB gasoline (RBN26) closed down -0.0495 (-1.61%).

Crude oil and gasoline prices fell sharply on Tuesday, with crude posting a 7-week low and gasoline posting an 8-week low.  Crude prices retreated on Tuesday as the ceasefire between Israel and Iran appears to be holding, which improves the prospects for a deal to end the US-Iran war and reopen the Strait of Hormuz.  Also, weakness in Chinese crude oil demand is undercutting oil prices. 

More News from Barchart

Crude oil prices slumped on Tuesday after Iran and Israel agreed to end hostilities toward each other. President Trump today predicted a swift end to war with Iran and a subsequent fall in oil prices and said, “We’re in the final throes of what will be a very, very good deal, and that they could have at least an idea one or two days from now” about the deal.

Weakness in Chinese demand is bearish for crude oil prices.  China’s May crude imports fell to about 7.8 million bpd, the lowest in more than eight years.  China is the world’s largest crude importer.

However, crude prices recovered from their worst level on Tuesday after President Trump blamed Iran for shooting down a US military helicopter and said the US would respond, reigniting fears that the US-Iran peace plan is in peril and the Strait of Hormuz will remain closed, further tightening global oil supplies.

The outlook for higher US crude output is negative for oil prices.  The Department of Energy (DOE) on Tuesday raised its US 2026 crude production estimate to 13.72 million bpd from a May estimate of 13.65 million bpd.

Crude prices have support from the continued Ukrainian drone attacks on Russian oil infrastructure.   Last Monday, Bloomberg reported that Russia banned jet fuel exports after Ukraine’s attacks on Russian oil refineries reached a record high in May.  Russia’s refinery runs in May fell -13% y/y to 4.58 million bpd, the lowest since October 2009, according to data from Bloomberg. US and EU sanctions on Russian oil companies, infrastructure, and tankers have also curbed Russian oil exports.

The International Energy Agency (IEA) said in a monthly report released in May that global oil inventories declined at about 4 million bpd in March and April, and that the market will remain “severely undersupplied” until October, even if the conflict ends soon. Goldman Sachs estimates that crude output in the Persian Gulf has been curtailed by about 14.5 million bpd, and that the current disruption has drawn down nearly 500 million bbl from global crude stockpiles, which could hit a billion bbl by June.

As a bearish factor for crude, OPEC delegates said on May 14 that the cartel aims to continue a series of oil quota increases over the next few months, completing the return of halted oil production by the end of September.  The group already formally agreed to restore about two-thirds of the 1.65 million bpd supply cutback it made back in 2023 and said it plans to raise output targets further and to revive the final portion in three more monthly stages.  On May 3, OPEC+ said it will boost its crude output by 188,000 bpd in June after raising production by 206,000 bpd in May, although any production hike now seems unlikely given that Middle East producers are being forced to cut production due to the Middle East war.  OPEC’s May crude production fell by -3.36 million bpd to a 40-year low of 16.33 million bpd. 

Vortexa reported on Monday that crude oil stored on tankers that have been stationary for at least 7 days rose +1.2% w/w to 86.59 million bbl in the week ended June 5.

The consensus is that Wednesday’s weekly EIA crude inventories fell by -2.2 million bbl, and gasoline supplies rose by +1.0 million bbl. 

Last Wednesday’s EIA report showed that (1) US crude oil inventories as of May 29 were -3.5% below the seasonal 5-year average, (2) gasoline inventories were -4.9% below the seasonal 5-year average, and (3) distillate inventories were -12.4% below the 5-year seasonal average.  US crude oil production in the week ending May 29 fell -0.1% w/w to 13.707 million bpd, mildly below the record high of 13.862 million bpd posted in the week of November 7.

Baker Hughes reported last Friday that the number of active US oil rigs in the week ended June 5 rose by +2 to an 11-month high of 431 rigs, well above the 4.25-year low of 406 rigs posted in the week ended December 19.  Over the past 2.5 years, the number of US oil rigs has fallen sharply from the 5.5-year high of 627 rigs reported in December 2022.

On the date of publication, Rich Asplund did not have (either directly or indirectly) positions in any of the securities mentioned in this article. All information and data in this article is solely for informational purposes. This article was originally published on Barchart.com


Source link

Bitcoin nears $60K as 50% supply sits in loss – Is FTX-style bottom repeating?

0
Bitcoin nears $60K as 50% supply sits in loss – Is FTX-style bottom repeating?


Following a decline of more than 2% in the last day, Bitcoin [BTC] was trading at $61,336.93 at press time—moving closer to the $60K mark.

That being said, the BTC dropped more than 24% in the last month, from $82k in mid-May to $61k at the time of publishing. 

The crypto community is divided

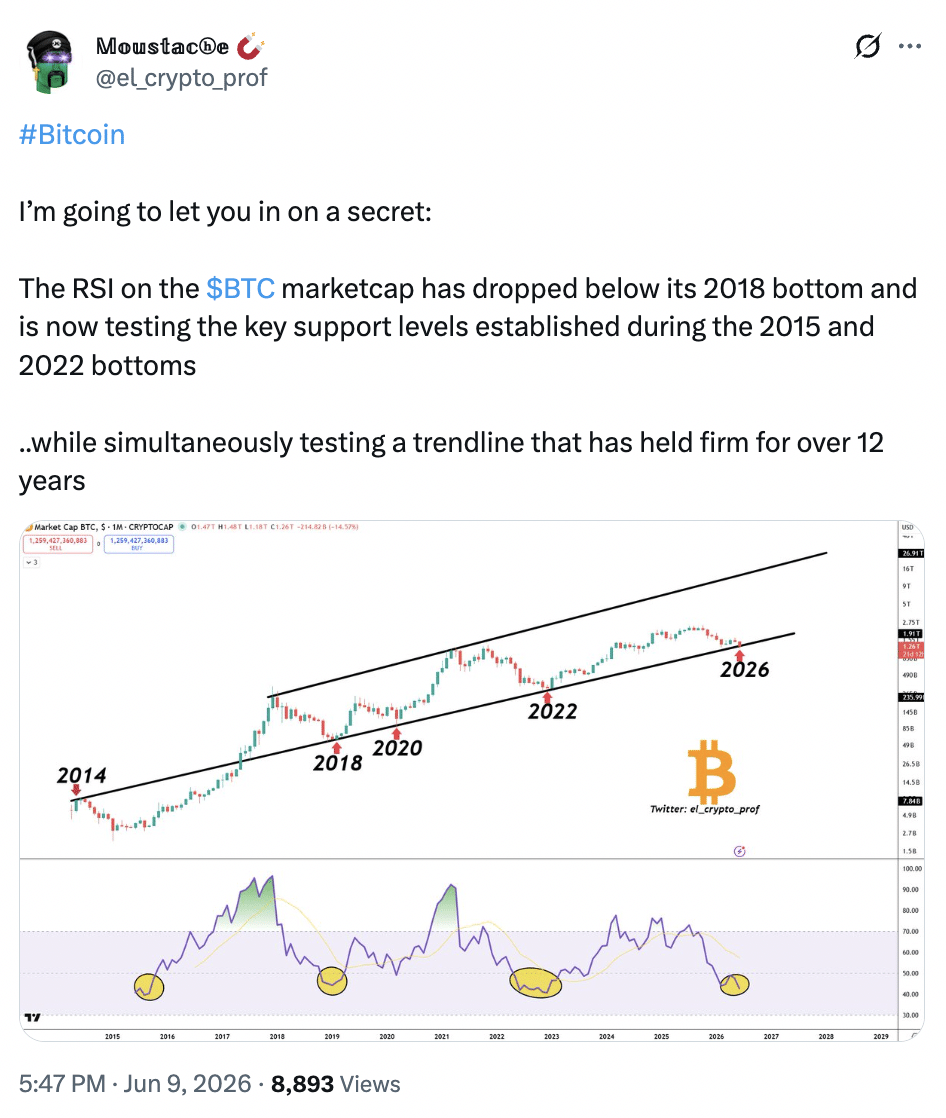
Given this significant decline, there seems to be disagreement within the crypto community. For instance, one analyst highlighted that the RSI for the Bitcoin market cap has fallen below its 2018 bottom. 

He said, 

RSI on the BTC marketcap has dropped
Source: X

However, another analyst saw the exact opposite trend, and noted, 

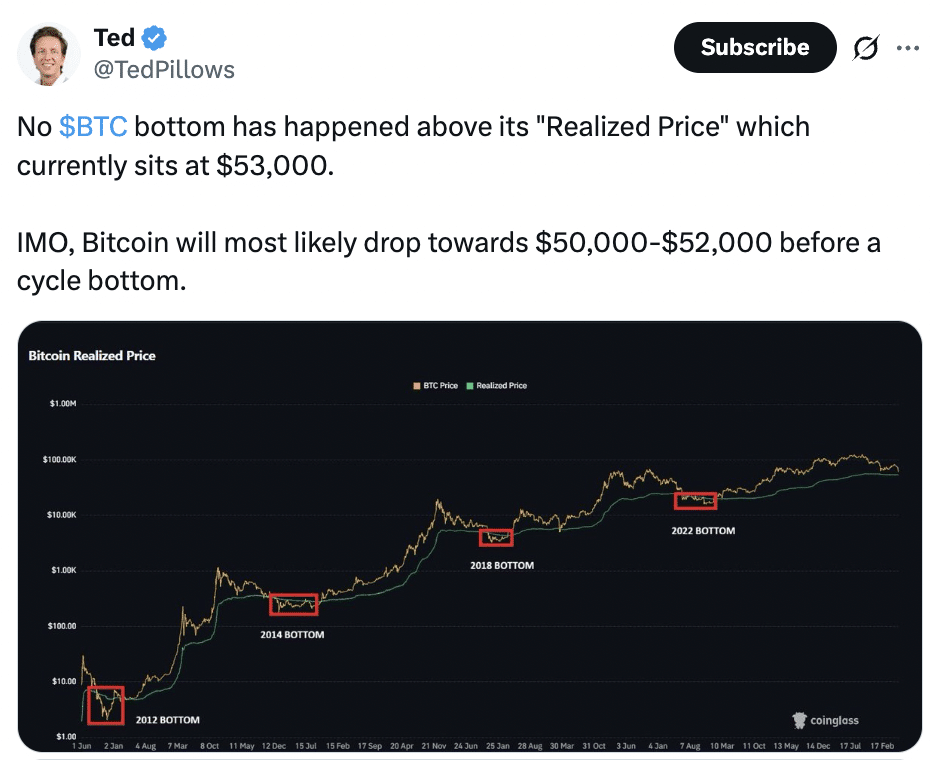
No BTC bottom has happenedNo BTC bottom has happened
Source: X

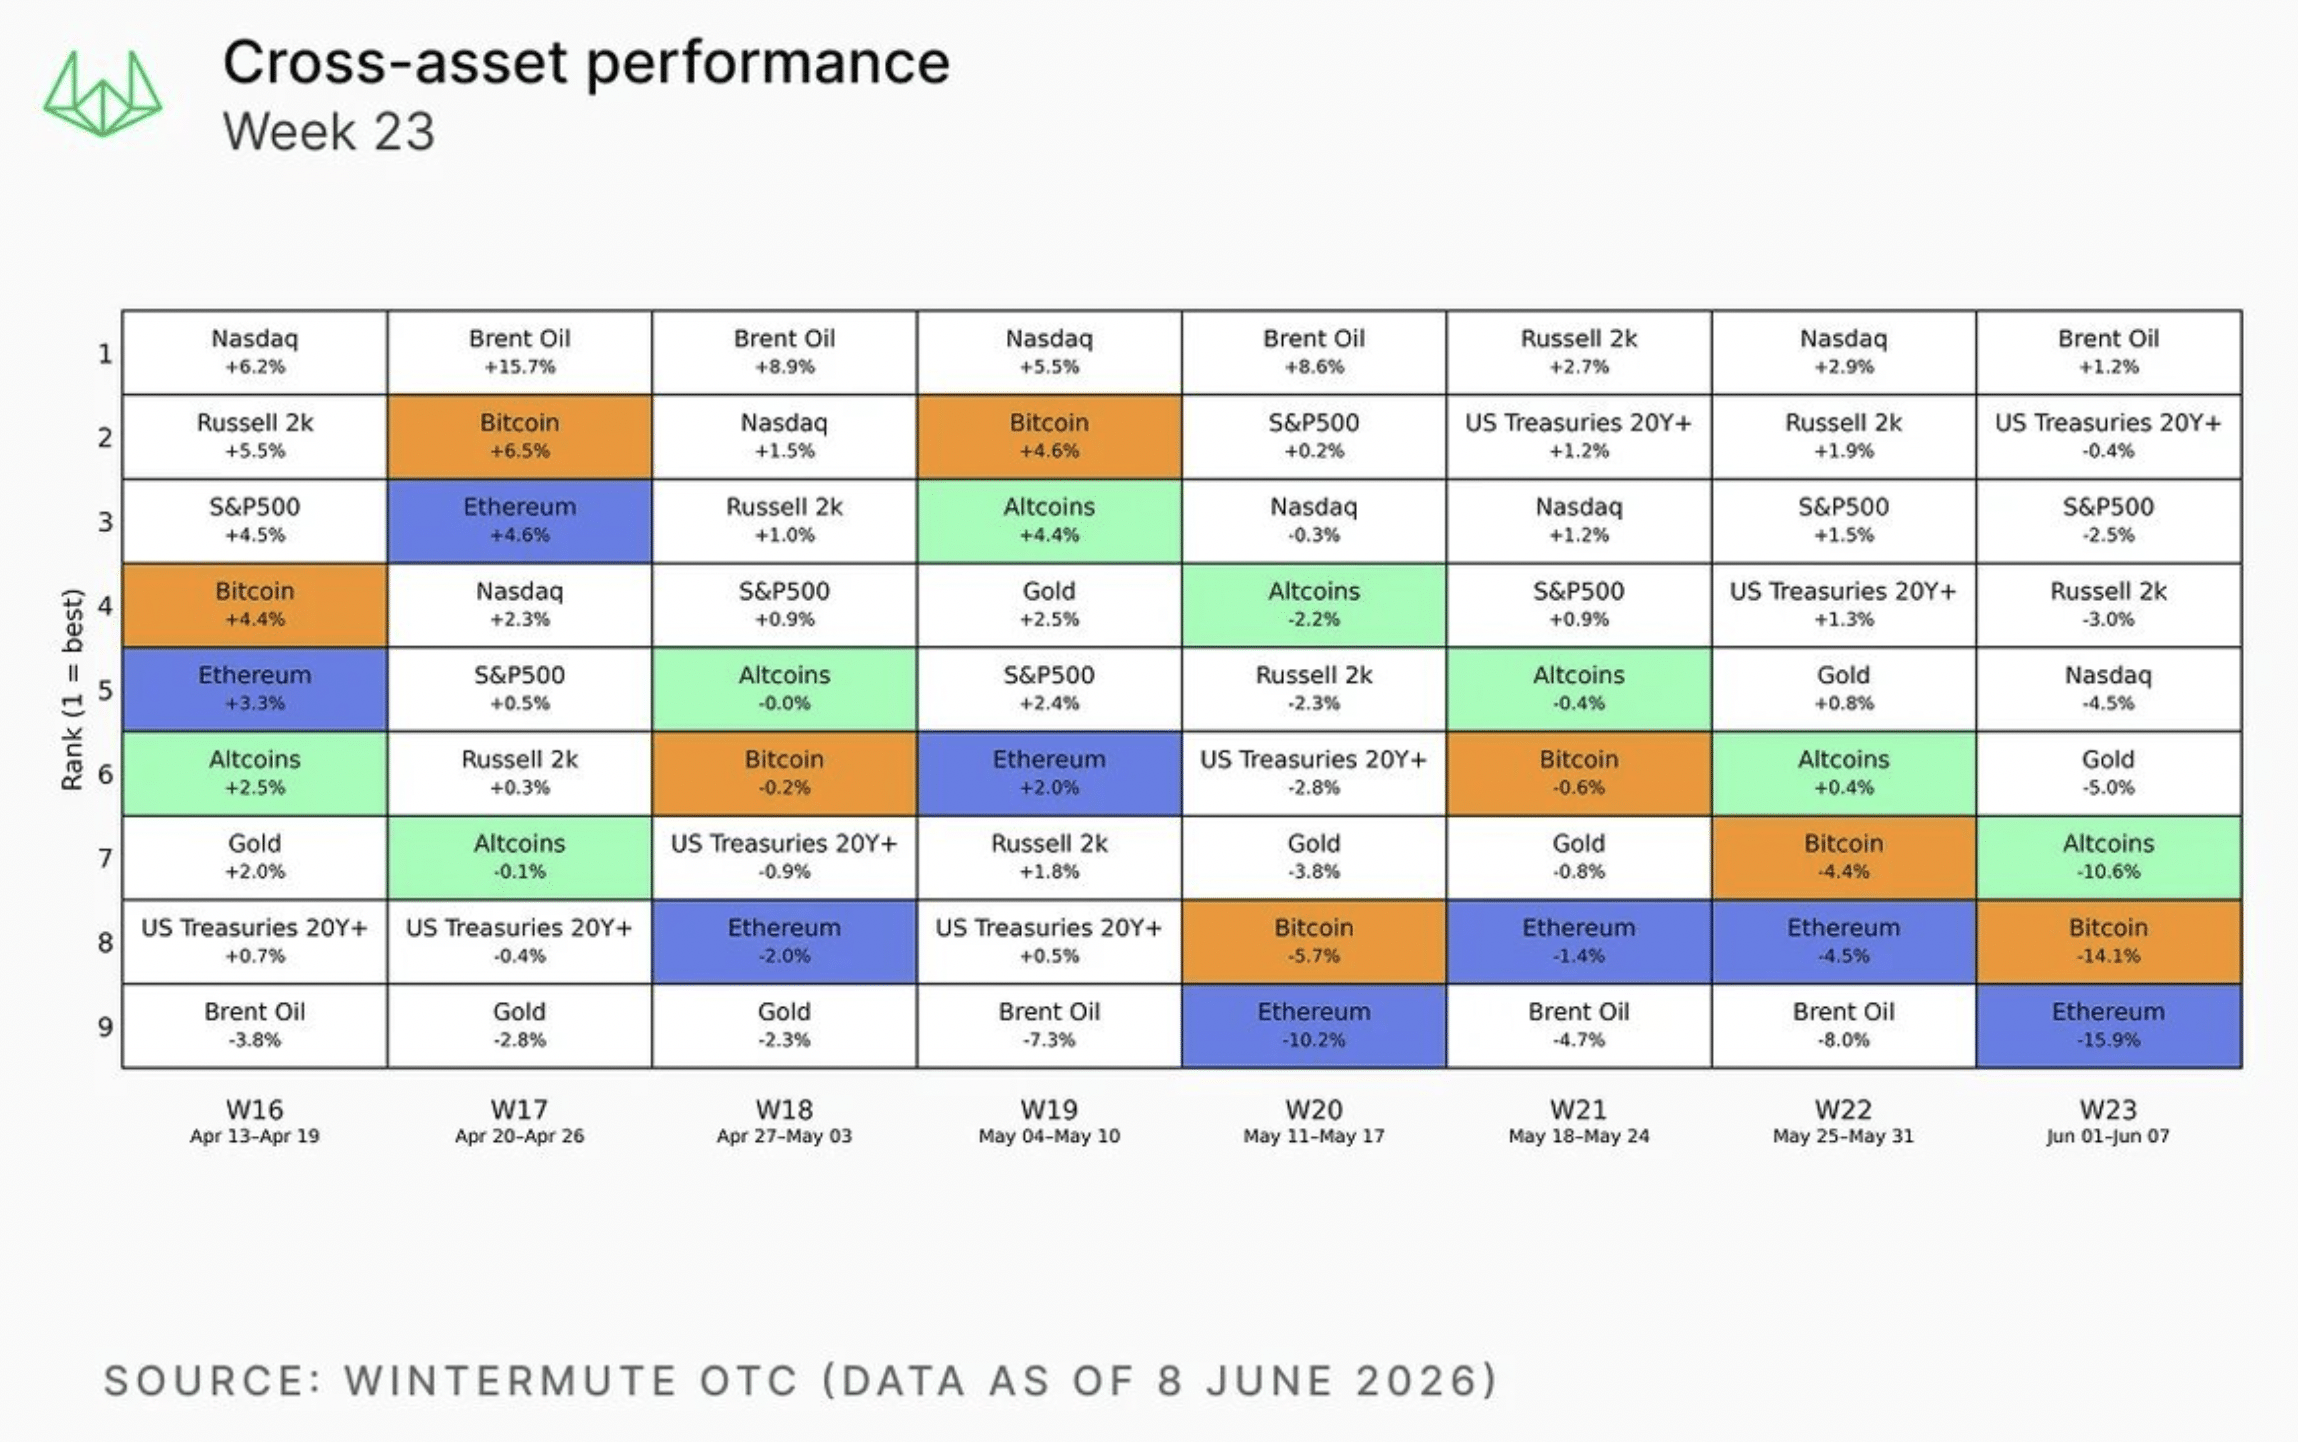
Interestingly, Wintermute, an algorithmic trading firm, claimed that there are no obvious indications that capital is returning. They further raised the flag that the market bottom has not yet been verified.  

Market Bottom Yet to Be ConfirmedMarket Bottom Yet to Be Confirmed
Source: Wintermute/X

According to Wintermute, institutional selling and ETF withdrawals in the US were the primary causes of the recent decline in Bitcoin. 

Where is the future trajectory of Bitcoin leaning? 

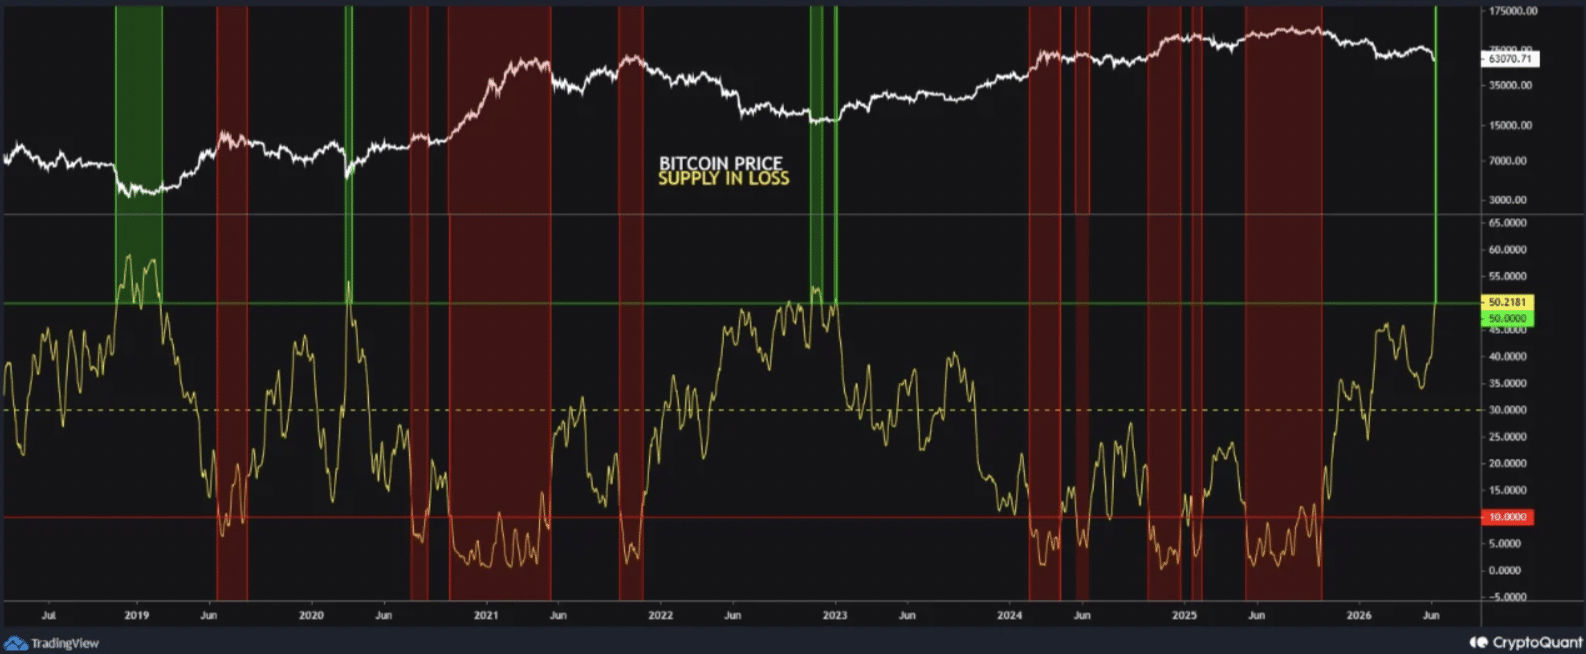
Therefore, to determine where Bitcoin is truly leaning, CryptQuant’s Bitcoin Supply in Loss, 7-day moving average, is the perfect on-chain metric.

Bitcoin Supply in LossBitcoin Supply in Loss
Source: X

As per the analysis, the indicator has risen above 50%. This indicates that, according to the price at which those coins last moved, over half of the circulating supply of BTC is currently being held at a loss.

Such levels have historically corresponded with times of extreme market pessimism and surrender.

In such scenarios, investors are more inclined to sell out of fear following protracted price declines. This indicator last crossed the 50% mark in November 2022, when Bitcoin was trading below $20,000 after FTX’s collapse. 

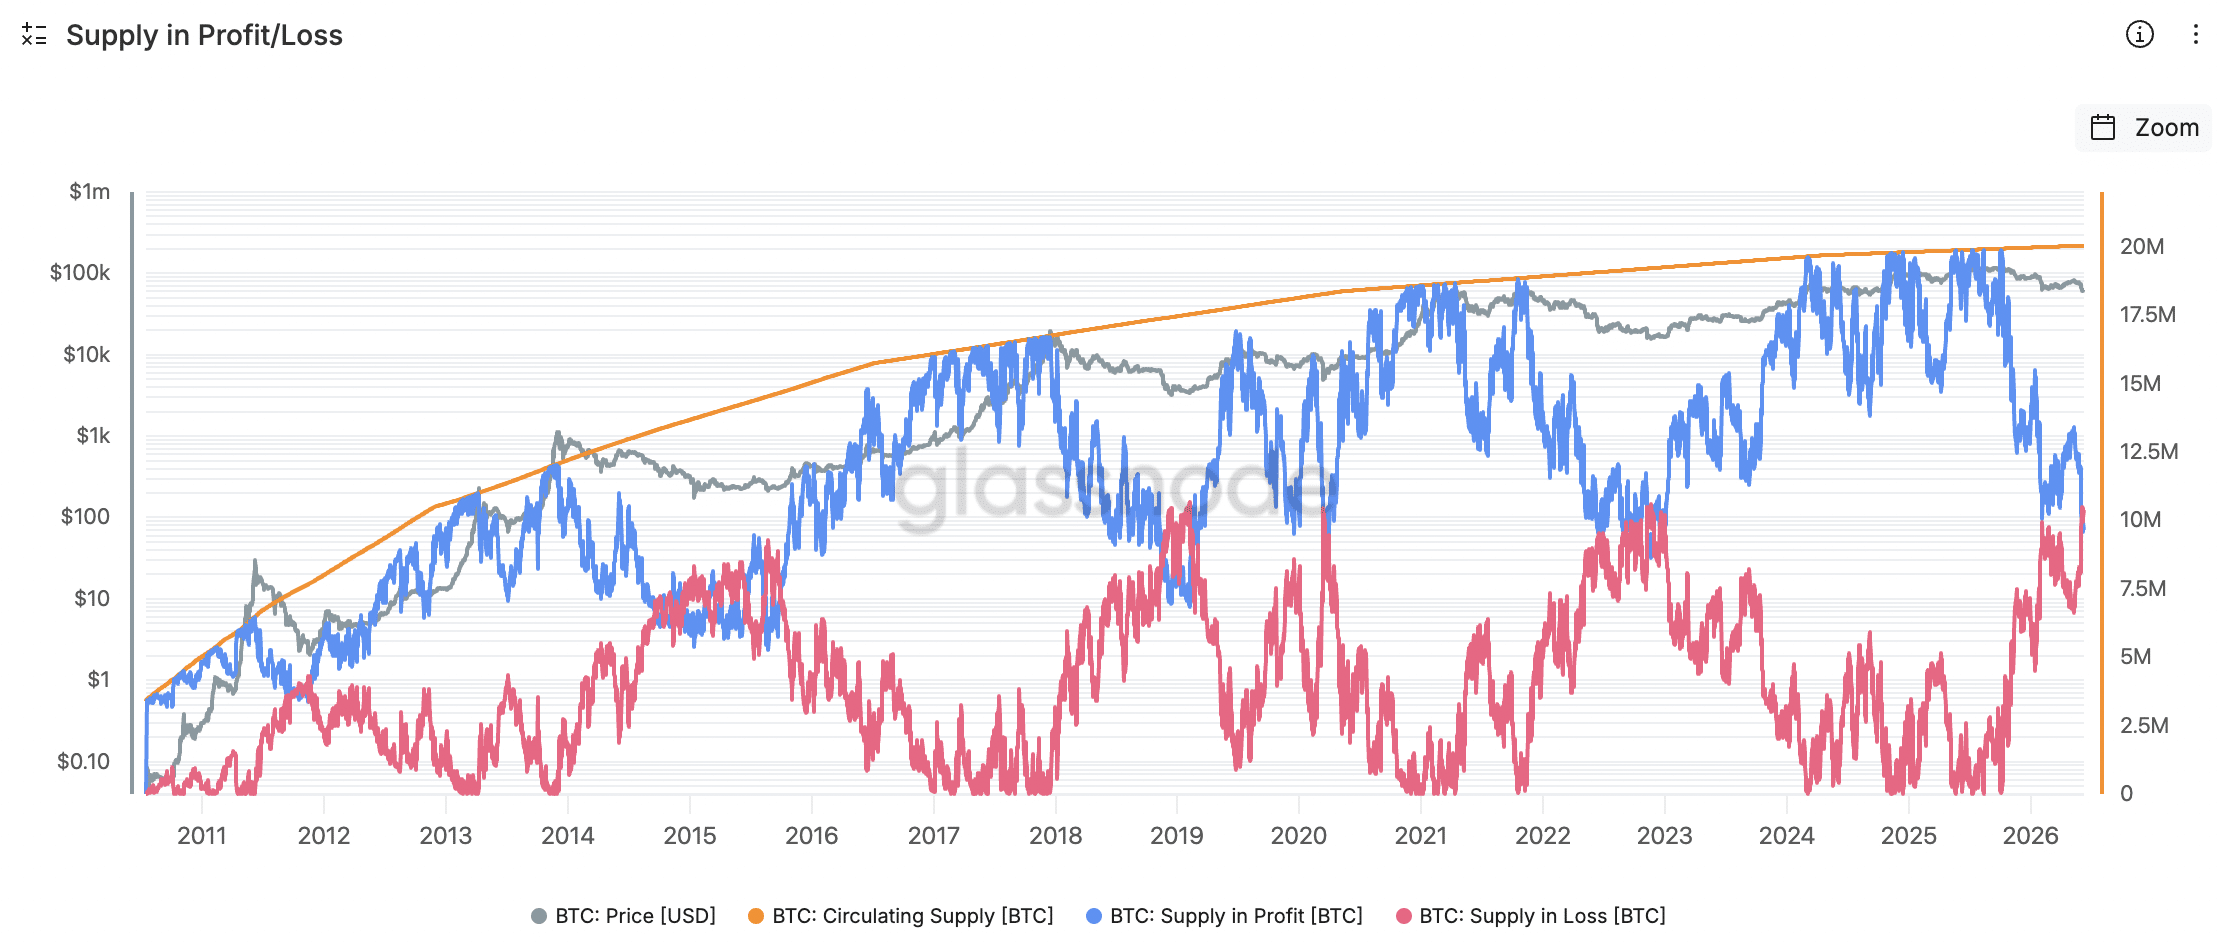
Furthermore, the profit and loss chart by Glassnode indicated that at the cycle peak, almost half of the total supply was profitable.

Supply in Profit/LossSupply in Profit/Loss
Source: X

As more than 8 million Bitcoins are submerged currently, that number has dropped precipitously, underscoring the magnitude of the most recent market reset. 

Is Bitcoin nearing stabilization or deepening volatility? 

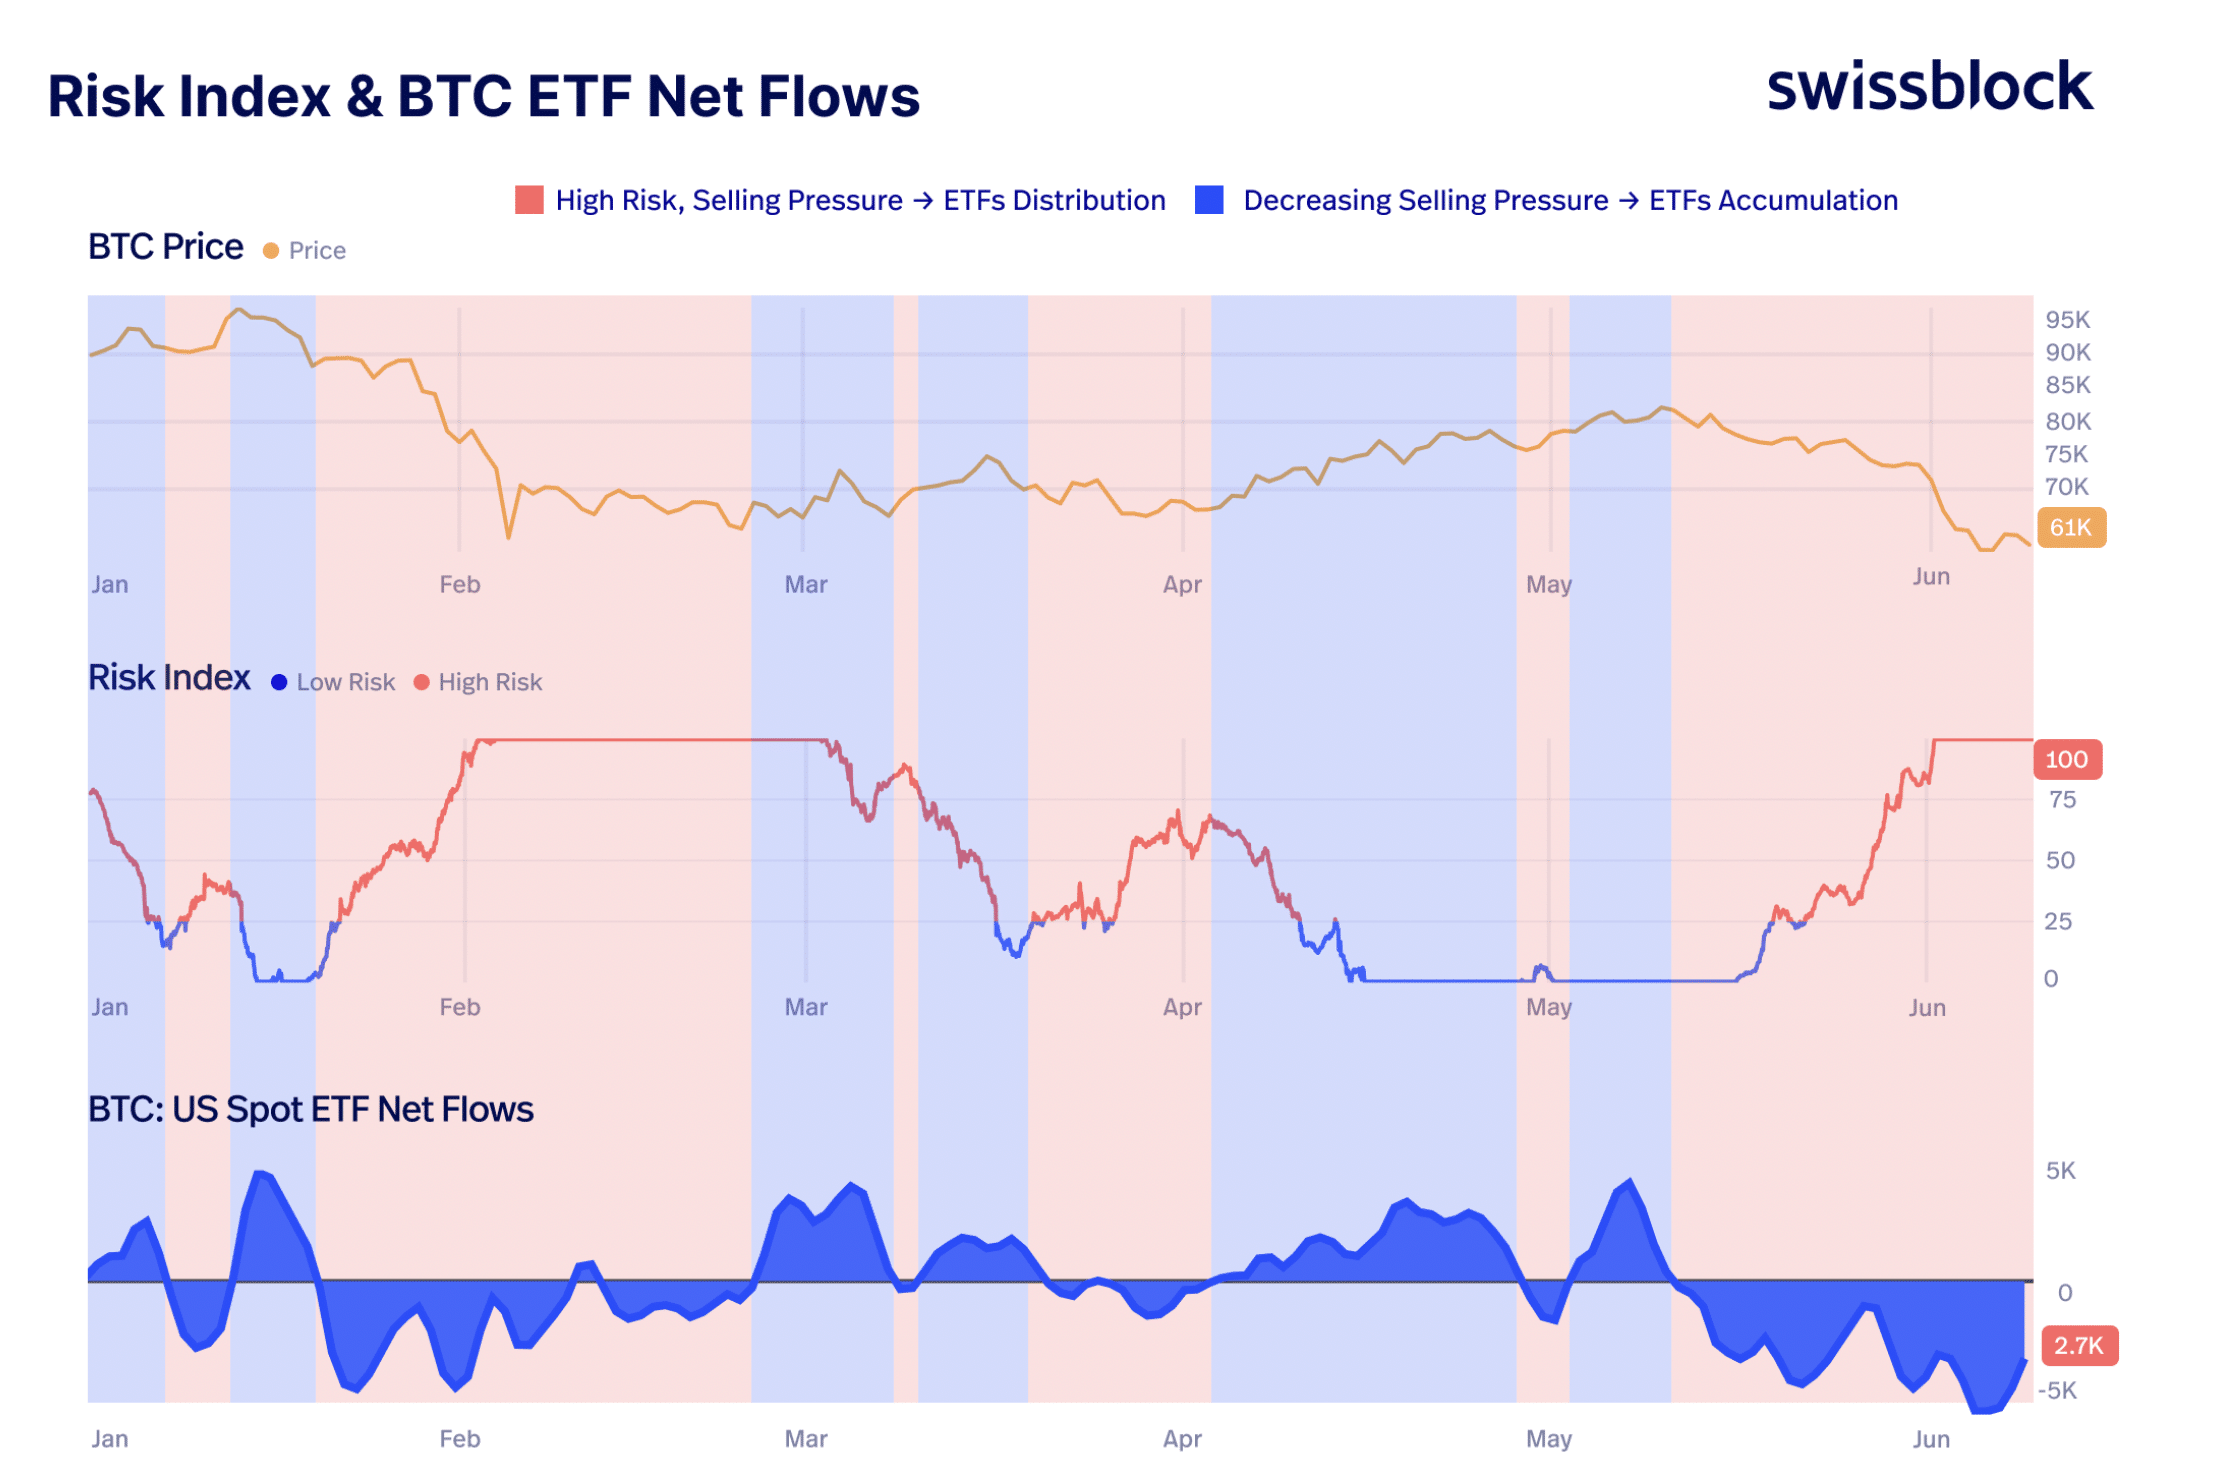
In addition, AMBCrypto also stated that the bulls have further failed to raise the price. Swissblock’s Risk Index and Bitcoin ETF flow data, however, indicate that market conditions have changed toward a higher-risk environment, which is necessary to determine whether Bitcoin is truly stabilizing.

Risk Index + BTC ETFRisk Index + BTC ETF
Source: Swissblock/X

As the Risk Index rises to 100, the chart’s highest level, Bitcoin falls to about $61,000, indicating strong selling pressure. Meanwhile, there have been notable net outflows from U.S. spot Bitcoin ETFs, suggesting that institutional investors are lowering their exposure rather than increasing it. 

All in Swissblock put it best when they noted, 

Selling pressure is being absorbed again. The key now is to look for the first accumulation signals. As long as Risk stays in Capitulation Risk, Bitcoin remains under structural pressure.


Final Summary

  • While some market analysts believe the downtrend is still in place, others point to historically oversold RSI levels as a possible bottom signal.
  • Growing indications of surrender are evident in on-chain data, as CryptoQuant’s Bitcoin Supply in Loss metric crosses 50% for the first time since the FTX-driven bottom in November 2022. 


Source link

The quantum clock is ticking: it’s Bitcoin’s problem, not Ethereum’s

0
The quantum clock is ticking: it's Bitcoin's problem, not Ethereum's

If bitcoin and Ethereum had been invented on the same day, nobody would have heard of bitcoin. I sold every bitcoin Bit Digital held and deployed the proceeds into Ethereum. I have built one of the largest corporate Ethereum treasury positions in the world and said, on the record, that we will never sell it. People have asked me to articulate the single strongest argument for that conviction. On March 30, 2026, that argument arrived. Last month, Citi confirmed it.

In a research note published on May 18, Citi analysts warned that quantum computing advances have shortened the timeline for practical attacks on digital assets, and reached a conclusion that should give every institutional bitcoin holder pause: bitcoin faces significantly greater quantum risk than Ethereum, and the gap between them comes down not just to technology but to governance.

That finding echoes the landmark paper released in late March by Google Quantum AI in collaboration with Stanford University and the Ethereum Foundation, which found that the computing resources required to break bitcoin’s foundational cryptography are approximately 20 times lower than previously estimated. A sufficiently advanced quantum computer, operating with fewer than 500,000 physical qubits, could derive a bitcoin private key from its public key in roughly nine minutes. That machine does not exist today. But the window to act responsibly is narrowing faster than most institutions realize. When Google raises the alarm, and Citi confirms it in the same quarter, this is no longer a fringe concern. This is the silver bullet. And it points directly at bitcoin.

Why bitcoin is exposed

Bitcoin’s security rests on elliptic curve digital signature algorithms. When you spend bitcoin, your public key is briefly exposed onchain. Under classical computing, reversing that to obtain a private key is infeasible. Quantum computers running Shor’s algorithm can, in principle, do exactly that during the brief window a transaction is broadcast. The Google paper doesn’t merely confirm this theoretically; it quantifies it with a precision that removes comfortable ambiguity.

Nic Carter, co-founder of Coin Metrics and one of the sharpest minds in digital assets, has been sounding this alarm for months. In a series of essays beginning in October 2025, Carter called quantum computing “the biggest long-term risk to bitcoin’s core cryptography” and accused developers of “sleepwalking towards collapse.” He estimates a quantum computer could meaningfully break elliptic curve cryptography as early as 2028. Approximately 6.9 million BTC could be vulnerable at a sufficient quantum scale, including legacy wallets and Taproot outputs, which already represented more than 21% of all bitcoin transactions in 2025.

Bitcoin’s governance problem

One might ask: can’t bitcoin simply upgrade? Yes, in theory. In practice, this is where the risk compounds.

Bitcoin’s governance is intentionally conservative and consensus-driven, which makes it extraordinarily slow. SegWit took roughly 8.5 years from conception to widespread adoption. Taproot took approximately 7.5 years. The current quantum proposals, BIP-360 and BIP-361, are still at the draft or early testnet stage as of 2026. A full base-layer transition to post-quantum signatures would be the most contentious change bitcoin has ever attempted. As Carter documented, most bitcoin Core developers have expressed limited concern about urgency, a disposition that is, at minimum, a serious governance liability for any institution holding bitcoin in treasury. A quantum breakthrough does not politely wait for committee consensus.

Ethereum has already acted

This is where the picture diverges sharply. Ethereum’s approach to quantum resistance is not a reactive scramble. It is a structured road map already in execution, built on the NIST post-quantum cryptography standards finalized in August 2024.

The Pectra upgrade, which shipped on Ethereum mainnet in May 2025, introduced EIP-7702, a critical stepping stone toward full account abstraction. Rather than requiring a single network-wide hard fork, Ethereum’s architecture allows individual accounts to choose their own signature verification and switch to quantum-safe signatures voluntarily. The upcoming Hegotá hard fork, planned for the second half of 2026, embeds this further at the protocol level. The Ethereum Foundation has set structured milestones targeting completion of core post-quantum infrastructure by approximately 2029, with active interop devnets already running across multiple clients.

The contrast with bitcoin’s governance paralysis could not be more stark. Ethereum was designed, in ways bitcoin simply was not, to accommodate exactly this kind of foundational upgrade. That is not an accident. It is architecture.

The institutional calculus

For corporate treasurers and sovereign wealth managers, quantum risk is no longer a tail scenario to be footnoted and dismissed. Governments are already treating it as operational. U.S. federal agencies faced an April 2026 deadline to submit post-quantum cryptography transition plans under National Security Memorandum 10. The EU has set a 2030 quantum-resistance target for critical infrastructure. The G7 Cyber Expert Group published a coordinated financial sector road map in January 2026. This compliance architecture will, over time, extend to digital asset treasury holdings.

The question for any institution holding bitcoin is whether they are comfortable with an asset whose quantum-resistance road map is still in draft, whose governance moves at geological speed, and whose developer community is divided on whether urgency is even warranted.

The question for any institution considering Ethereum is whether they want the asset with a structured, transparent, and already in motion upgrade path.

Ethereum is the more adaptive, more capable, and more durable asset. I have put the balance sheet of a Nasdaq-listed company behind that conviction. The Google paper is what finally gives that conviction a single, undeniable, technically grounded answer to the hardest question in digital asset treasury strategy: which asset is built to last?

Ethereum is not a perfect asset. No asset is. But in the context of quantum risk, it is the asset whose architecture was built to survive what is coming. If Carter and Google are right, that distinction will matter enormously, and sooner than most people expect.


Source link

Barclays Lifts PT on Snowflake (SNOW) – Here’s Why

0
Barclays Lifts PT on Snowflake (SNOW) – Here’s Why


Snowflake Inc. (NYSE:SNOW) is one of the best NYSE stocks to buy for long-term investment. Barclays lifted the price target on Snowflake Inc. (NYSE:SNOW) to $285 from $272 on June 4 and maintained an Equal Weight rating on the shares. It told investors in a research note that the firm left the company’s investor day more positive on the shares, adding that “faster product velocity is clear and Cortex Code seems to be driving a multi-pronged, positive effect on usage that is still early”. The firm also believes that Snowflake Inc.’s (NYSE:SNOW) financial updates were limited to significantly earlier than expected GAAP profitability.

In another development, Truist lifted the price target on Snowflake Inc. (NYSE:SNOW) to $300 from $275 the same day and maintained a Buy rating on the shares. The firm told investors in a research note that, after discussions at the Snowflake Summit 2026, customer and partner feedback show that the company’s CoCo tools are accelerating workload creation, platform expansion, and migrations.

Snowflake Inc. (NYSE:SNOW) provides cloud data warehousing software and offers Data Cloud, an ecosystem that allows customers, data providers, partners, and data consumers to break down data silos and derive value from data. The company’s platform supports a range of use cases, including data lakes, data warehousing, data engineering, data application development, data science, and data sharing.

While we acknowledge the potential of SNOW as an investment, we believe certain AI stocks offer greater upside potential and carry less downside risk. If you’re looking for an extremely undervalued AI stock that also stands to benefit significantly from Trump-era tariffs and the onshoring trend, see our free report on the best short-term AI stock.

READ NEXT: 15 Stocks That Will Make You Rich in 10 Years AND 12 Best Stocks That Will Always Grow.

Disclosure: None. Follow Insider Monkey on Google News.


Source link

Netomi CEO says $5 trillion AI customer experience market could boost stablecoin demand

0
Netomi CEO says $5 trillion AI customer experience market could boost stablecoin demand

The customer experience industry will become a $5 trillion market by 2030, according to Netomi founder and CEO Puneet Mehta, who says that growth will create demand for stablecoins and blockchain-based payment infrastructure rather than pull capital away from crypto.

Mehta said companies currently spend roughly $500 billion annually on customer experience-related knowledge work. As AI expands beyond customer support into sales, conversion, upselling and cross-selling, he expects the market opportunity to grow tenfold by 2030.

“Customer experience today is structured as a silo,” Mehta said. “That layer of technology and people does not fully talk to every system and every process autonomously in the company. Once that starts to happen, it unlocks a much bigger category.”

Mehta, whose company recently raised $110 million in a Series C round backed by Accenture Ventures and Adobe Ventures, argues that the rise of artificial intelligence and crypto should be viewed as complementary trends rather than competing sectors.

“The idea that AI is simply sucking capital away from crypto is a fundamental misunderstanding of where technology is heading,” said Mehta, who previously worked as an engineer and data scientist at IBM and later held similar roles at JPMorgan, Citi and Merrill Lynch. “We are not in a zero-sum battle for venture dollars.”

Mehta’s view that AI agents will require faster financial infrastructure aligns with a growing argument among crypto executives that autonomous software could become a major driver of stablecoin adoption.

Fiat-pegged cryptocurrencies are entering a new phase of adoption, with large corporations using them for cross-border treasury flows while AI agents begin using blockchain rails for autonomous payments, Bridge and Deus X Capital executives recently said at Consensus 2026. In April, Chainalysis said stablecoins are on track to become a foundational layer of global finance, with adjusted transaction volumes projected to reach $719 trillion by 2035

AI enabling crypto

The next phase of enterprise software will rely on autonomous AI agents capable of handling increasingly complex business functions, including financial transactions, according to Mehta.

“AI agents are moving money and assets faster than legacy enterprises can follow,” he said. “An autonomous agent cannot rely on traditional banking systems that take days to settle transactions via manual paperwork. ”

Mehta argues that fully automated software systems require two key components: AI systems capable of decision-making and blockchain payment infrastructure capable of moving money instantly.

“To achieve true end-to-end automation, these software systems require always-on capital rails that operate 24/7,” he said.

That requirement could drive greater demand for stablecoins and blockchain-based settlement networks that operate around the clock (24/7). Stablecoin issuers and crypto payment firms have increasingly positioned their products as tools for real-time settlement and cross-border transactions.

Still, many enterprise software companies continue to rely on traditional payment providers and banking networks, and it remains unclear how quickly blockchain-based settlement systems will become a standard component of AI-driven commerce.

Unicorn status

Netomi’s latest raise brings its total funding to $168 million. Mehta declined to disclose the company’s valuation but said the company is nearing unicorn status.

Netomi, whose clients include global giants such as Delta, United Airlines, MetLife, ESPN, and ATB Financial, is building a unified AI platform rather than a collection of disconnected tools, he said.

While many enterprise AI providers focus on individual functions such as customer service, legal operations or sales support, he explained, Netomi is building systems that work across those functions and share information between them.

“Most companies are building point solutions,” Mehta said. “They’re solving one problem at a time. We believe the future is a connected enterprise where AI systems aren’t operating in silos but working together across the entire organization.”

UPDATE (June 10, 17:10 UTC): Adds section on Netomi nearing unicorn status.


Source link

Dollar Weakens as Crude Oil Prices Sink

0
Dollar Weakens as Crude Oil Prices Sink


The dollar index (DXY00) is moving lower today and is down by -0.28%.  Today’s -3% plunge in WTI crude oil prices has lowered inflation expectations and could prompt the Fed to pursue easier monetary policy, a bearish factor for the dollar.  Also, lower T-note yields today weaken the dollar’s interest rate differential and are negative for the dollar.

The dollar recovered from its worst level today on better-than-expected US economic news.  The Apr trade deficit eased to -$55.9 billion from -$56.6 billion in Mar, narrower than the -$56.1 billion expected.  Also, May existing home sales rose +3.2% m/m to a 5-month high of 4.17 million, stronger than expectations of 4.07 million.

More News from Barchart

President Trump today predicted a swift end to the war with Iran and a subsequent fall in oil prices, and said, “We’re in the final throes of what will be a very, very good deal, and that they could have at least an idea one or two days from now” about the deal. 

The swaps markets are discounting the odds at +3% for a +25 bp rate cut hike at the next FOMC meeting on June 16-17.

EUR/USD (^EURUSD) today is up by +0.29%.  The euro is moving higher today amid a weaker dollar. Also, an as-expected increase in German Apr industrial production and better-than-expected German Apr trade news are supportive for the euro.  In addition, today’s -3% fall in crude oil prices is positive for the Eurozone economy and the euro as Europe imports most of its energy.

German Apr industrial production rose +0.4% m/m, right on expectations and the biggest increase in five months.

German trade news was better than expected as Apr exports unexpectedly rose +0.9% m/m, stronger than expectations of a-0.5% m/m decline.  Also, Apr imports unexpectedly rose +1.2% m/m versus expectations of a -2.0% m/m decline.

The markets are discounting a +100% chance for a +25 bp rate hike by the ECB at Thursday’s policy meeting.

USD/JPY (^USDJPY) today is up by +0.02%.  The yen is slightly lower today after a +2% rally in the Nikkei Stock Index curbed safe-haven demand for the yen.  Losses in the yen are limited amid today’s -3% decline in crude oil prices, which is positive for Japan’s economy and the yen as Japan imports more than 90% of its energy.  Also, today’s hawkish report from Nikkei is bullish for the yen as it stated the BOJ is set to raise its policy rate by 25 bp to 1.00% at next week’s policy meeting.


Source link

ONDO falls to local $0.34 support – Here’s why bearish momentum remains

0
ONDO falls to local $0.34 support - Here's why bearish momentum remains


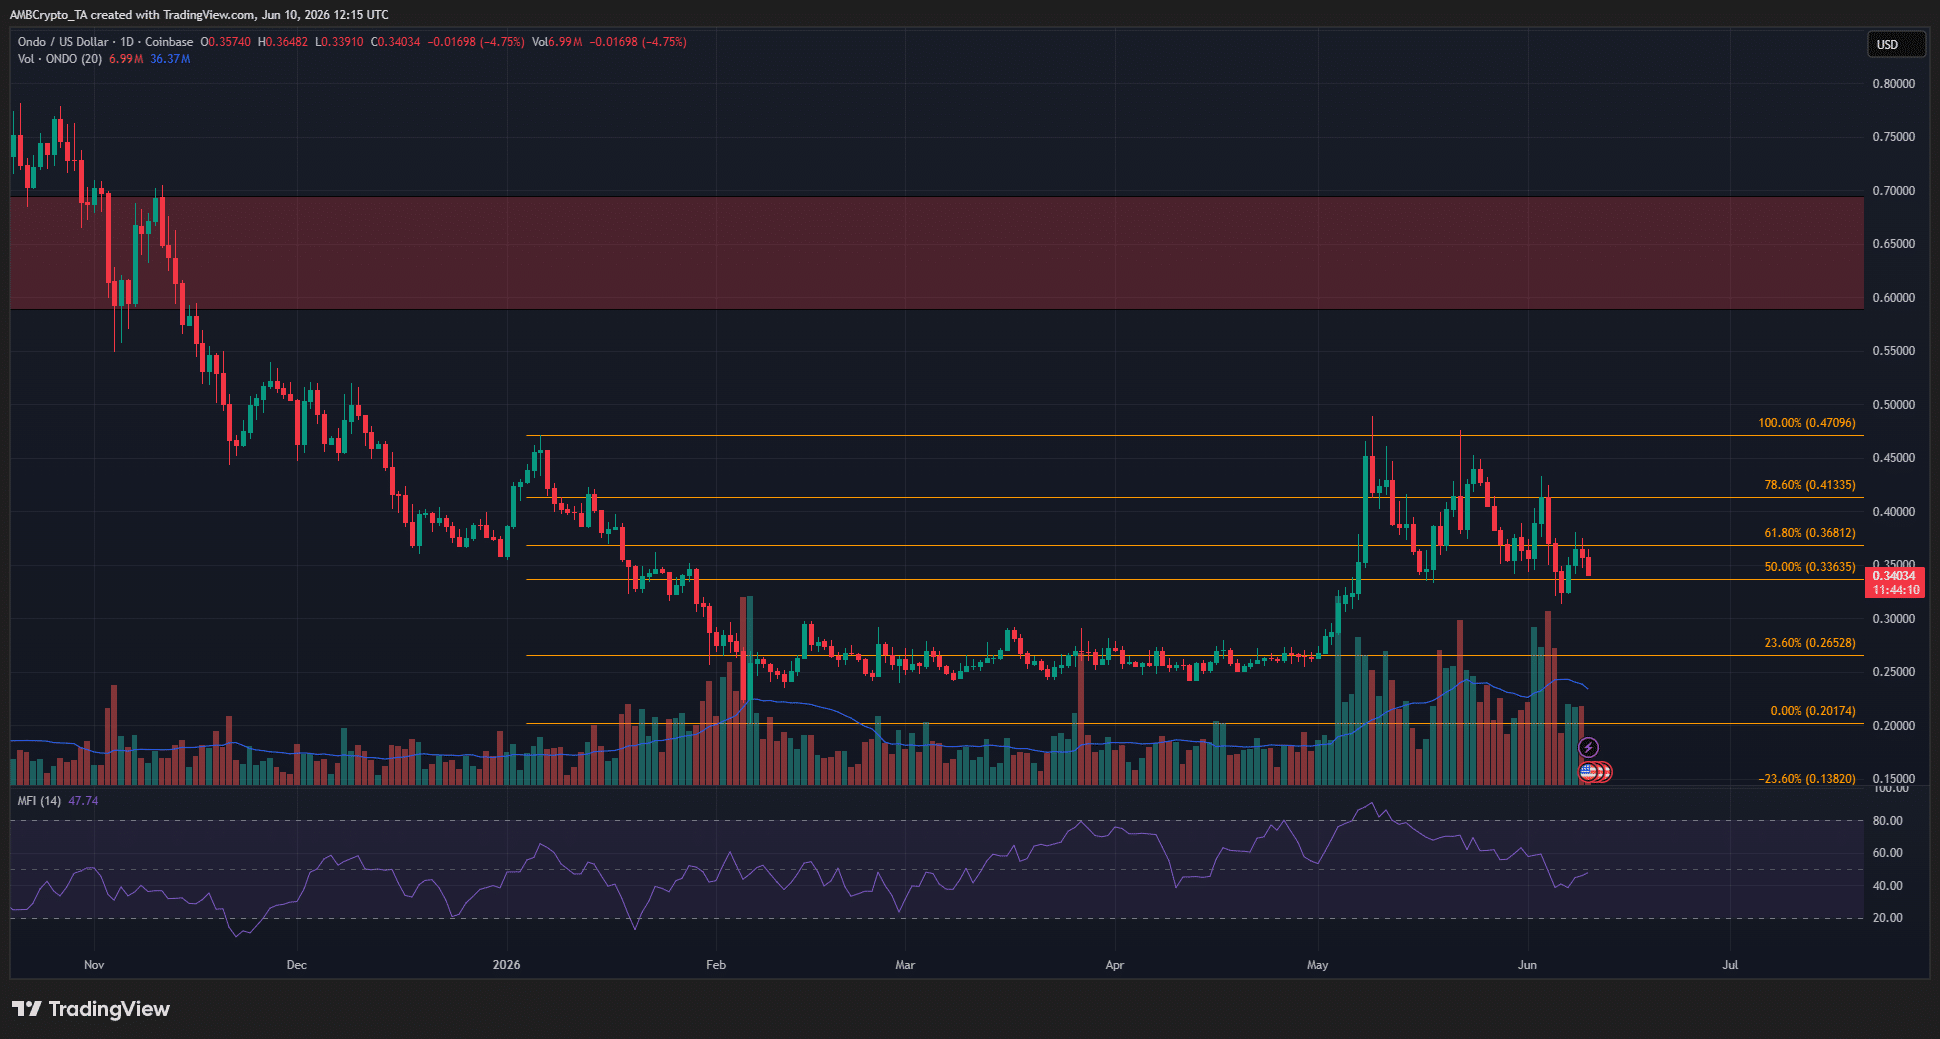
Ondo [ONDO] rallied strongly in early May to challenge the swing high at $0.47 but has since retraced back to $0.34. It was down 5.5% in the past 24 hours and just over 16.9% in the previous week of trading.

The Ondo token losses came alongside a rapid Bitcoin [BTC] sell-off. The extreme selling and fearful market conditions could see both ONDO and BTC fall lower.

The bearish ONDO case

ONDO 1-day Chart
Source: ONDO/USDT on TradingView

Throughout 2026, the higher timeframe swing structure of ONDO has been bearish. The Bitcoin rally beyond $80k in May helped the altcoin sentiment.

Around the same time, it was reported that Ondo Finance, in partnership with Ripple’s [XRP] ledger, J.P. Morgan, and Mastercard, helped pilot the first near real-time, cross-border settlement.

The news and the growing RWA narrative around that time helped boost ONDO prices to a local high of $0.451, but the altcoin didn’t manage a daily session close above the $0.47 swing high from January.

The subsequent rejection and the losses over the past month highlighted how the bearish trend was intact. It also signaled that further losses can be expected, especially as the lower timeframe demand zone from $0.335 to $0.350 has been broken.

Traders’ call to action – Sell

Ondo 4-hour ChartOndo 4-hour Chart
Source: ONDO/USDT on TradingView

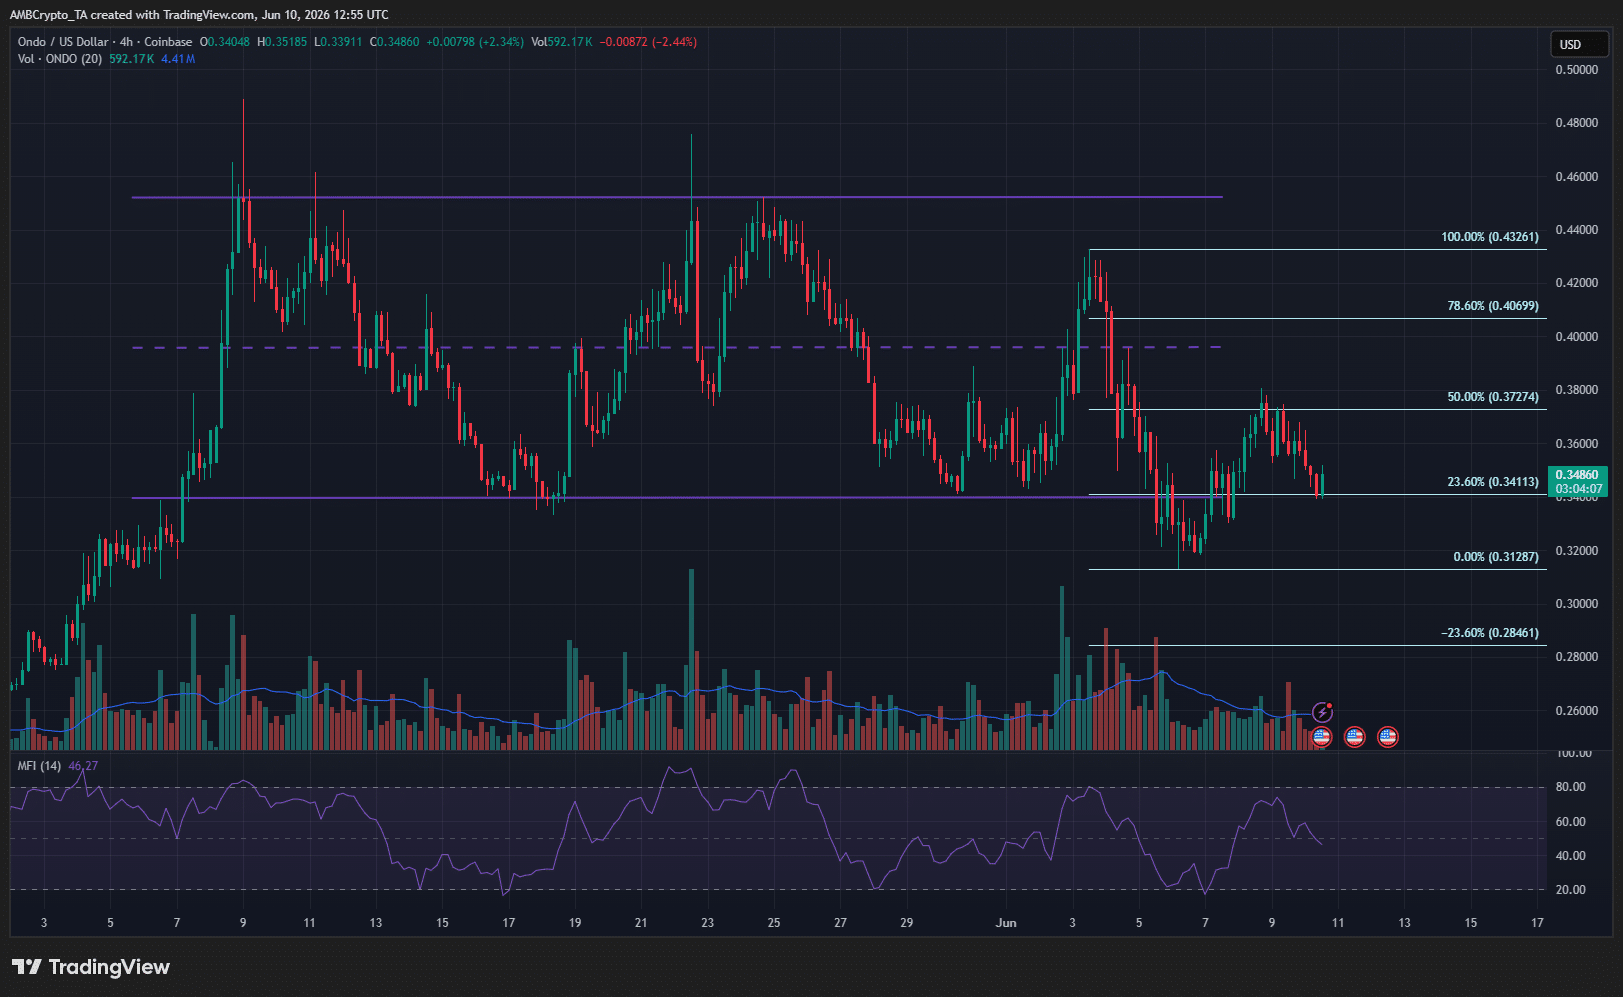
The short-term range over the past month between $0.34 and $0.45 was breached to the downside. The H4 structure had turned bearish, and the bounce to $0.372 has reversed.

The MFI on this timeframe was in the process of falling below 50 to signal increased capital outflows and downward momentum.

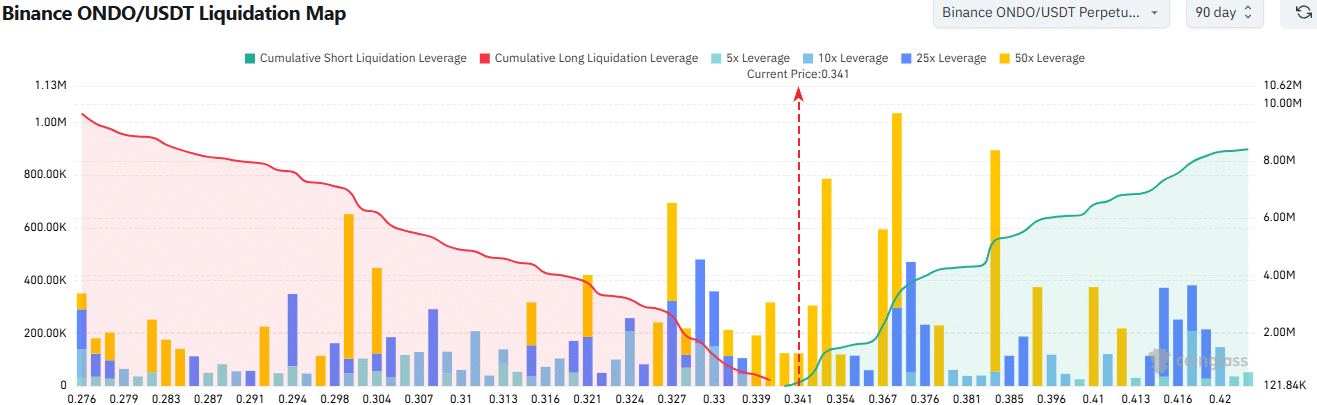
Ondo Liquidation MapOndo Liquidation Map
Source: CoinGlass

The liquidation map of the past three months showed that the $0.31-$0.34 area had relatively high cumulative long leverage. A bounce to $0.376-$0.385 was possible, but a dive toward $0.31 was likely to occur soon afterward.

Therefore, traders can position themselves bearishly but leave space for a short-term liquidation hunt to the upside.

A sustained move beyond $0.432 would break the 4-hour structure bullishly, invalidating the bearish short-term bias.


Final Summary

  • The Ondo rally in May challenged local highs, but demand was not enough to flip the long-term downtrend.
  • A bounce from the short-term range low at $0.34 is possible, but the momentum favored the sellers.


Source link