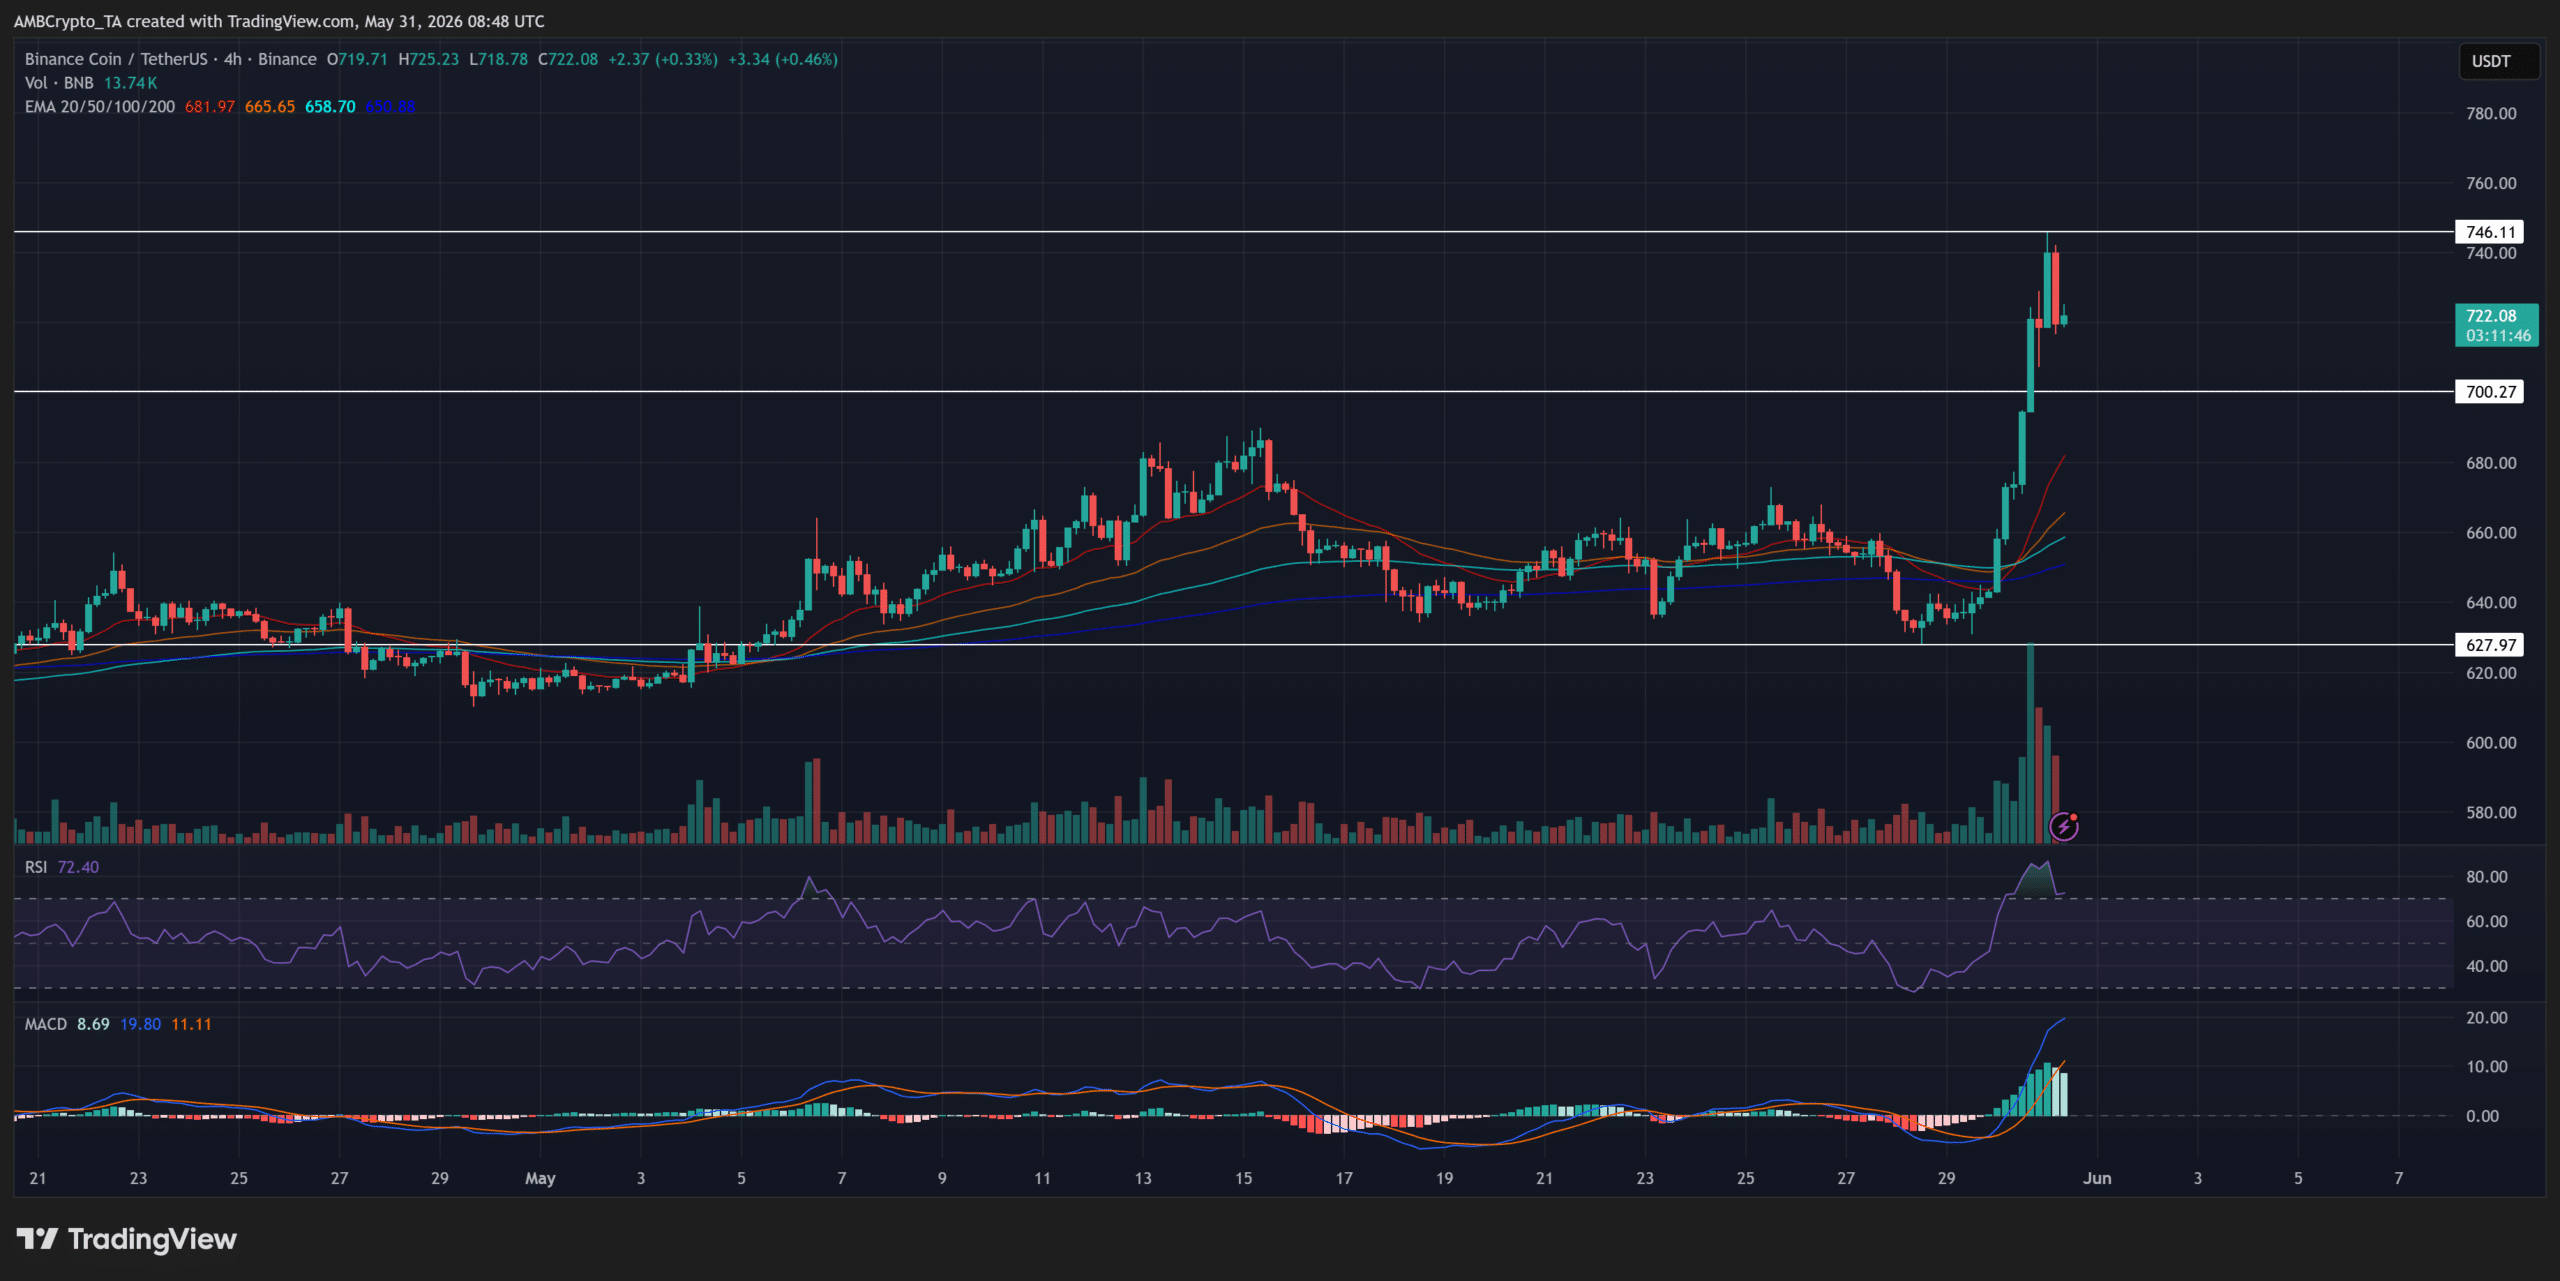
Fresh institutional demand has dramatically altered Binance Coin’s [BNB] market structure, transforming a prolonged consolidation into a decisive breakout. Earlier, BNB spent weeks trading between $628 and $700 as buyers steadily absorbed supply beneath resistance.
That balance shifted sharply after the VanEck BNB-linked ETP launch boosted market conviction. Buyers aggressively pushed BNB above $700, triggering a surge toward $746.11 before mild profit-taking emerged.
The breakout also attracted significant participation, reflected in the largest volume expansion in the period.
Source: BNB/USDT on TradingView
Momentum indicators reinforced the move. At press time, RSI had climbed to 72.4, signaling strong buying pressure, while the MACD continued to accelerate higher. Furthermore, BNB traded above its 20, 50, 100, and 200 EMAs, confirming broad trend alignment.
Moreover, the broader implication is bullish. Market participants have successfully converted the former $700 resistance into support, strengthening the breakout structure.
If buyers continue defending that level, the recent $746 high could come under pressure again, opening the path toward the $760-$780 region.
Open Interest surge reinforces BNB’s breakout
BNB’s breakout is attracting leveraged participation as derivatives traders position aggressively behind the trend. At the time of writing, Open Interest (OI) reached $904 million, while positions expanded by 30.5% over the past 24 hours.
Notably, perpetual contracts account for $902.3 million of that total, highlighting strong demand for directional exposure.
Source: Coinanalyze
That growth suggests fresh capital is entering the market rather than simply rotating between positions. Binance alone holds $628 million in BNB OI, far exceeding Bybit’s $132.3 million and OKX’s $79.3 million. This concentration reinforces Binance’s role as the primary venue driving participation.
Meanwhile, rising OI has accompanied BNB’s move above $700 and toward the $730 region. Such alignment typically reflects growing conviction among traders expecting further upside.
However, expanding leverage heightens market sensitivity. Rising capital inflows combined with aggressive positioning reinforce the breakout’s strength but also leave prices vulnerable to derivatives‑driven volatility as traders compete for the next leg higher.
Final Summary
Binance Coin has transformed former resistance into support, reinforcing bullish momentum as institutional and trader participation expands.
BNB continues attracting fresh capital through spot and derivatives markets, though rising leverage is volatility sensitive.
Find out how much you could earn by locking in a high CD rate today. A certificate of deposit (CD) allows you to lock in a competitive rate on your savings and helps your balance grow. However, rates vary widely across financial institutions, so it’s important to ensure you’re getting the best rate possible when shopping around for a CD. The following is a breakdown of CD rates today and where to find the best offers.
Overview of CD rates today
Historically, longer-term CDs offered higher interest rates than shorter-term CDs. Generally, this is because banks would pay better rates to encourage savers to keep their money on deposit longer. However, in today’s economic climate, the opposite is true.
Today, Sunday, May 31, 2026, the highest CD rate is 4% APY. This rate is offered by Marcus by Goldman Sachs on its 14-month CD.
How much interest can I earn with a CD?
The amount of interest you can earn from a CD depends on the annual percentage rate (APY). This is a measure of your total earnings after one year when considering the base interest rate and how often interest compounds (CD interest typically compounds daily or monthly).
Say you invest $1,000 in a one-year CD with 1.52% APY, and interest compounds monthly. At the end of that year, your balance would grow to $1,015.20 — your initial $1,000 deposit, plus $15.20 in interest.
Now let’s say you choose a one-year CD that offers 4% APY instead. In this case, your balance would grow to $1,040.74 over the same period, which includes $40.74 in interest.
The more you deposit in a CD, the more you stand to earn. If we took our same example of a one-year CD at 4% APY, but deposited $10,000, your total balance when the CD matures would be $10,407.42, meaning you’d earn $407.42 in interest.
When choosing a CD, the interest rate is usually top of mind. However, the rate isn’t the only factor you should consider. There are several types of CDs that offer different benefits, though you may need to accept a slightly lower interest rate in exchange for more flexibility. Here’s a look at some of the common types of CDs you can consider beyond traditional CDs:
Bump-up CD: This type of CD allows you to request a higher interest rate if your bank’s rates go up during the account’s term. However, you’re usually allowed to “bump up” your rate just once.
No-penalty CD: Also known as a liquid CD, this type of CD gives you the option to withdraw your funds before maturity without paying a penalty.
Jumbo CD: These CDs require a higher minimum deposit (usually $100,000 or more), and often offer higher interest rate in return. In today’s CD rate environment, however, the difference between traditional and jumbo CD rates may not be much.
Brokered CD: As the name suggests, these CDs are purchased through a brokerage rather than directly from a bank. Brokered CDs can sometimes offer higher rates or more flexible terms, but they also carry more risk and might not be FDIC-insured.
LE SSERAFIM continue to prove their staying power around the world as they share their second full-length project.
The HYBE girl group lands its fifth career Top 10 on the Billboard 200 with PUREFLOWPt. 1 while simultaneously moving more than half a million physical copies worldwide in the album’s first week — a dual showing that underlines the quintet has cemented itself as one of K-pop’s most consistent chart forces.
According to Billboard, PUREFLOWPt. 1 debuts at No. 10 on the Billboard 200 albums chart with 41,000 equivalent-album units in the U.S. The bulk of that figure comes from traditional album sales (which account for 34,000 units), followed by 7,000 streaming-equivalent album units (reflecting 7.1 million on-demand official streams of the album’s 11 tracks), with track-equivalent album units making up the rest. Billboard notes that more than 30 physical packaging variants boosted the opening-week numbers.
The No. 10 debut marks LE SSERAFIM’s fifth Top 10 entry on the Billboard 200, continuing one of the steadiest U.S. chart runs and becoming only the eighth K-pop artist to earn five or more Top 10 entries in the States.
Led by their 2024 EP Crazy, take a look at the group’s Billboard 200 and first-week U.S. sales history for their five Top 10 albums to date. (The group’s debut EP, Fearless from 2022, did not chart while their sophomore release, Antifragile from the same year, reached No. 14)
Crazy (2024) — No. 7 peak on the Billboard (47,000 units)
HOT (2025) — No. 9 peak (45,500 units)
Unforgiven (2023) — No. 6 peak (45,000 units)
Easy (2024) — No. 8 peak (41,000 units)
PUREFLOWPt. 1 (2026) — No. 10 (41,000 units)
Globally, the numbers were even bigger, clearing the half-million mark within one week.
According to South Korea’s real-time album sales chart Hanteo, PUREFLOWPt. 1 sold 559,207 physical copies worldwide in its first week. A look at how it stacks up against LE SSERAFIM’s previous first-week physical totals including their best-selling album, their first full-length Unforgiven released in 2023, below:
Unforgiven (202e) — 1,258,001 units
Easy (2024) — 989,268 units
Crazy (2024) — 677,687 units
HOT (2025) — 636,281 units
Antifragile (2022) — 567,673 units
PUREFLOW Pt. 1 (2026) — 559,207 units
Spaghetti (2025) — 464,698 units
Fearless (2022) — 307,450 units
The group’s second full-length album — and its first in three years — PUREFLOW Pt. 1 builds its 11 tracks around a deceptively layered concept: the title is a new anagram of “powerful.” Sonically, the set opens in celebratory mode with the Latin-house title track “Boompala” — which reimagines Los del Río’s 1993 global hit “Macarena” — and the techno-driven pre-release throbber of a single “Celebration.” Elsewhere on the LP, different tracks dive into moodier and more introspective material like standouts including the self-reflective R&B-club cut “iffy iffy,” friendship rock ballad “Need Your Company” and electro-pop waltz “Sonder.”
Looking ahead, LE SSERAFIM will carry the PUREFLOW songs to the stage on their upcoming PUREFLOW World Tour, set to launch July 11 in Incheon, South Korea, before continuing across Asia and the United States, with the group visiting and performing across Europe for the first time. The “Pt. 1” in the album title indicates that more music in the powerful-vulnerable PUREFLOW style is on the way, with all signs pointing to LE SSERAFIM continuing to build on the U.S. and global charts.
Watch “BOOMPALA,” the latest music video from LE SSERAFIM
When Warren Buffett builds a position in a company, Wall Street pays attention. His firm, Berkshire Hathaway, doesn’t typically accumulate an 8.3% stake in a business unless it believes deeply in what that company does and where it’s headed.
That’s what made Berkshire’s investment in Pool Corp so noteworthy and the exit equally striking.
Berkshire quietly unwound its entire position in Pool (POOL) during the first quarter of 2026.
Pool is the world’s largest wholesale distributor of swimming pool supplies, equipment, and related products.
Think of it like the middleman between manufacturers and the roughly 120,000 contractors, retailers, and service companies that keep America’s backyard pools running.
The business model is built around recurring, nondiscretionary spending on pool chemicals, filters, and pumps, which aren’t skipped just because the economy slows.
The business ticked most boxes for Warren Buffett, given predictable demand, pricing power, and a strong network that’s difficult to replicate.
Pool Corp also pays a dividend, which adds to its appeal for long-term income investors. Down almost 70% from all-time highs, POOL stock currently offers a yield of 2.8%.
New pool construction boomed during the COVID era as Americans poured money into their homes. That surge in demand eventually cooled, and new unit construction by pool builders fell sharply.
According to Pool Corp’s first-quarter 2026 earnings call, new pool units for 2025 totaled 58,000, a fraction of the pandemic-era peak.
Pool posted solid Q1 2026 results
For the first quarter of 2026, the company reported:
President and CEO Peter Arvan pointed to broad-based growth across product categories.
Chemicals grew by 8%, driven in part by strong demand for the company’s private-label brands.
Equipment grew by 7% and building materials were up 5%.
Geographically, California grew 10%, and Texas grew 7%, boosted by favorable weather and strong maintenance demand.
“We are off to a solid start in 2026, with net sales up 6% and operating income growing 7% year-over-year. Maintenance demand remained resilient, and we saw continued, though still gradual, recovery in discretionary categories.”
Management also confirmed full-year diluted earnings per share guidance of $10.87 to $11.17, representing 2-3% growth over the prior year.
The installed base is key for the dividend stock
One of the most important things to understand about Pool is where its revenue originates from.
There are about 5.5 million in-ground pools across the United States that require weekly chemical treatment.
Moreover, pumps and filters wear out and need replacing, and equipment gets upgraded. That installed base generates steady, recurring demand that does not depend on new construction.
“Our growth thesis does not require a recovery in new pool units,” Arvan said during the earnings call, according to a company statement.
It has a digital ordering platform called POOL360, which now accounts for 13% of net sales, up from 12.5% a year ago.
It also runs the Pinch A Penny franchise network, which added seven new independently owned locations in the first quarter alone.
Pool Corp has been investing in private-label chemical products, including its Regal and E-Z Clor lines, which carry higher margins and have been gaining traction with independent retailers.
Pool Corp. has a robust business modelVictor LOCHON/Getty Images
A growing dividend with a sustainable payout
Pool has raised its annualized dividend from $0.56 per share in 2011 to $5 per share in 2026, indicating a compounded annual growth rate of 15.7% over the last 15 years.
The annual dividend expense for the mid-cap stock is around $182 million, while it is forecast to report a free cash flow of $354 million this year.
Given a payout ratio of 51%, POOL stock has enough room to grow its dividend while reinvesting in growth and acquisitions.
More dividend stocks:
Berkshire’s decision to sell does not necessarily mean Pool Corp is a broken business. The fundamentals, as Q1 shows, remain intact.
But it does reflect a shift in conviction. When a position the size of Berkshire’s gets exited entirely, it suggests the expected return no longer meets the bar, at least for now.
For dividend investors still holding POOL, the core question is simpler: does the installed-base thesis hold, and can management continue to expand margins as new construction remains muted?
The first-quarter numbers suggest the answer leans yes. Whether that is enough to win back Buffett-sized confidence is another matter entirely.
Artificial Superintelligence Alliance [FET] posted a strong recovery over the past 24 hours as buying activity returned across the artificial intelligence sector.
The token rallied 15.97%, while trading volume climbed 42.16% to roughly $345 million.
This combination reflected stronger market participation rather than a low-volume price spike.
Earlier sessions had shown hesitant price action near support levels. However, buyers stepped in aggressively and pushed FET back into a higher trading range.
As interest returned to AI-related assets, FET emerged as one of the stronger performers.
Traders increase exposure as Open Interest jumps
During the rally, Open Interest also increased 18.55% and reached $125.63 million, indicating that fresh positions entered the market during the rally.
This increase aligned with the broader rise in trading activity and suggested that participants were actively positioning for further movement.
Unlike rallies driven solely by short covering, the simultaneous expansion in volume and Open Interest pointed toward new capital entering the market.
Such behavior often reflects a stronger conviction among traders. Nevertheless, higher leverage can amplify volatility whenever price approaches a major resistance level.
Source: CoinGlass
Can FET overcome the next major barrier?
Price action improved significantly after FET reclaimed the $0.244 support level and pushed toward the important $0.300 resistance zone.
The daily chart showed that buyers defended higher lows throughout May before driving price above a recent consolidation structure.
Artificial Superintelligence Alliance [FET] traded near $0.268 at the time of observation, placing it between support and a major supply area.
Earlier rallies had struggled around the $0.300 region, making this level an important obstacle once again.
The Relative Strength Index climbed to 66.05, while its moving average remained near 53.54.
This reading placed RSI above the neutral 50 level and reflected strengthening buyer control.
Importantly, the indicator remained below the overbought threshold, suggesting that price still retained room for additional appreciation before reaching extreme conditions.
The latest breakout strengthened the market structure and shifted attention toward higher targets.
However, sellers still controlled the area above current prices. If buyers successfully reclaim $0.300, the move could open a path toward the $0.400 resistance highlighted on the chart.
Source: TradingView
Why are Binance traders overwhelmingly bullish?
Sentiment data revealed a strong preference for long positions among Binance’s top traders.
More than 70% of accounts remained long, while only 29.61% maintained short exposure.
The resulting long-to-short ratio stood at 2.38, highlighting a clear bullish bias despite Artificial Superintelligence Alliance [FET] approaching a significant resistance zone.
Such positioning often reflects confidence in continued upside. However, crowded long trades can also increase vulnerability to sudden pullbacks if buyers lose control.
Recent price action supported trader optimism because FET had already reclaimed key support and strengthened its technical structure.
Source: CoinGlass
To sum up, FET’s rally gained support from rising volume, expanding Open Interest, strengthening RSI readings, and heavily bullish trader positioning.
The recovery improved the token’s structure considerably. However, the $0.300 resistance remains the key test.
If buyers reclaim that level, FET could extend its advance toward higher supply zones. If not, the market could experience a temporary pullback before establishing its next trend.
Final Summary
Artificial Superintelligence Alliance [FET] reclaimed key support as volume and trader participation expanded sharply.
Bullish positioning increased significantly, but $0.30 remains the crucial hurdle.
Nvidia (NVDA) stock is up about 15.44% year to date, at the time of writing, Friday afternoon, May 29. Meanwhile, the SPDR S&P 500 index (SPY) is up about 11.06% in the same period.
While the stock has outpaced the S&P 500, its growth is lagging that of other semiconductor companies that are part of the AI boom.
Here are the gains other semiconductor companies achieved in the same period:
When we see the big gains achieved by some of these companies, especially Intel, things start to look strange.
Intel reported a GAAP net loss of $3.73 billion, yet it has rallied like crazy. Meanwhile, Nvidia reported very strong earnings and announced a big dividend increase, yet it dropped.
There are two reasons holding the stock back. It is already held by most institutional investors. The other reason might be the upcoming big IPOs of SpaceX, OpenAI, and Anthropic.
Something similar may be going on now with the “hottest” IPOs this year.
Nevertheless, Nvidia is now mounting an attack that aims to turn it into an unstoppable force in the semiconductor industry.
Vera CPU opens a brand-new $200 billion total addressable market for Nvidia.Bloomberg/Getty Images
Nvidia delivers its first Vera CPUs
Nvidia confirmed that the first Vera CPUs arrived at Anthropic, OpenAI, and SpaceXAI on May 15th. Three days later, Oracle got its units, too.
There are several reasons why this CPU launch is a game-changer for Nvidia. The company says that Vera is “the world’s first processor purpose-built for the age of agentic AI and reinforcement learning.”
What makes this CPU different is that, unlike the previous-generation Grace CPU, which was built on ARM’s Neoverse V2 cores, this one features Nvidia’s custom “Olympus” cores (also based on the ARM architecture).
The Vera CPU features 88 Olympus cores and, according to Nvidia, delivers twice the performance of the Grace CPU and is the first CPU to support FP8 precision.
The importance of the Vera CPU was explained by Nvidia’s EVP and CFO, Colette Kress, during the first quarter earnings call:
“Vera CPU opens a brand-new $200 billion [total addressable market (TAM)] for Nvidia, a market we have never addressed before. Every major hyperscale and system maker is partnering with us to get it deployed. We have visibility to nearly $20 billion in total CPU revenue this year, setting us up to become the [world ’s] leading CPU supplier.”
Not only is the CPU a departure from relying on ARM’s design, but it is also now aimed at capturing CPU market share from Intel and AMD through standalone sales, which makes it a game-changer for Nvidia.
The first benchmark of Vera is out, but with a big caveat
The first benchmark of Vera is already out, and it was performed by Michael Larabel of Phoronix. The specialized media outlet has been developing its Phoronix Test Suite for about 19 years.
The reason behind Nvidia’s choosing Phoronix is likely its Test Suite’s enterprise value, as it can be used to find Linux kernel regressions, and Linux is the operating system used in data centers.
The results were very impressive, but they come with a caveat. Phoronix was asked by Nvidia to only perform a subset of tests. That is to say, Nvidia must have run the test before contacting him and picked only the tests it was confident the CPU would perform well on.
To further underscore that this is highly unusual, Larabel answered in the forums that he thinks the last time such a situation happened was when he was benchmarking the original Calxeda ARM server 16 years ago.
While it is very likely the CPU wouldn’t have performed as well if all the tests had been run, Nvidia isn’t marketing this CPU as a general-purpose CPU. The other thing we should note is that there is likely a lot of room for performance optimizations in its drivers.
Why Intel should be very worried about Vera, and AMD will probably be OK for now
Instead of going through the long list of tests, we can look at the geometric mean results.
The results showed that the Vera delivered 10% better performance than the AMD EPYC 9575F. We need to note here that the EPYC CPU has only 64 cores, vs Vera’s 88.
Additionally, while this is a high-frequency CPU, it was released in 2024. AMD is launching its Venice EPYC line, which is manufactured on TSMC’s 2nm node.
Thanks to better manufacturing node and improved architecture, it is very likely that EPYC will have the crown.
Phoronix also compared Grace CPU with Vera, and unlike Nvidia’s 2x-faster claim, it got 1.63x the performance. Regardless, it is very impressive, especially when we look at Intel; things get quite crazy. Vera crushed Intel’s Granite Rapids Xeon 6980P, which has 128 cores, achieving 1.55x the performance.
More Tech Stocks:
Nvidia’s new CPU might be its Apple Silicon moment in the CPU space. Apple launching the M1 chip, pressured Intel and AMD to make better CPUs, Vera will do that too. The more work Intel and AMD put into beefing up their top-tier CPUs, the better it is for consumers, as there will be a trickle-down effect.
In the case of Vera, there will be no consumer-oriented CPU, but perhaps the next generation (not the incoming one N1/N1X) of Nvidia’s laptop CPUs will feature new core designs.
What analysts think about Nvidia
In a May 25 research note shared with me, Bank of America analyst Vivek Arya and his team updated their opinion on Nvidia stock.
Analysts said they believe Nvidia is trading below its historical price-to-earnings (PE) multiples and its price-to-earnings-to-growth (PEG) ratio.
According to the team, Nvidia’s 5-year historical PE multiple is 33.6x, and its PEG ratio estimate for calendar year 2027 is 0.28x.
Stocks with a PEG below 1.0 are considered undervalued compared to their growth potential.
The team’s pro forma EPS estimates for fiscal years 2027 and 2028 are $9.09 and $13.27, respectively.
Arya reiterated a buy rating for Nvidia stock and a price target of $350, based on a 26 multiple of his estimate for price-to-earnings ratio excluding cash for calendar year 2027, which is within Nvidia’s historical forward year P/E range of 25 to 56.
Tigress Financial has Nvidia stock on its Research Focus List and in its Focus Opportunity Portfolio.
The analyst said that record first-quarter fiscal 2027 results showed AI factory demand and rising capital returns, and that Nvidia is the main beneficiary of the AI build-out.
Feinseth reiterated a strong buy rating for Nvidia stock and raised the price target to $425 from $360.
Of 54 analyst ratings, 50 rate Nvidia a buy, and only three rate it as hold, with an average price target of $305.38, according to MarketBeat.
Downside risks for Nvidia:
Slowdown in AI infrastructure spending,
Share erosion due to increased competitive intensity,
The offer of $72.50 per common share represents a 24% premium to the home builder’s latest closing price on Friday. The deal is expected to close in the second half of this year.
“We are excited to welcome Taylor Morrison into Berkshire’s portfolio,” Greg Abel, chief executive officer of Berkshire Hathaway, said in a statement Sunday. “Over time, we expect to unify our site-built homebuilding operations into a combined platform enabling us to deliver the dream of homeownership to more Americans.”
This is the first multibillion-dollar acquisition under Abel, who took over Berkshire Hathaway earlier this year after legendary investor Warren Buffett retired last year. The Omaha, Nebraska-based firm was sitting on a cash pile that reached $397 billion at the end of the first quarter, its highest level ever.
While investors have been satisfied with Abel’s command over the sprawling conglomerate, some have been hoping that a deal could support Berkshire’s shares, which has fallen 5.6% so far this year. The S&P 500 index has gained 10.7% in the same period.
Taylor Morrison is one of the largest community developers and homebuilders in the US and also offers financial services like home loans, titles, escrow and insurance to consumers, according to the statement. The Scottsdale, Arizona-based firm has more than 350 communities across 12 states.
The existing Taylor Morrison management team, including Chief Executive Officer Sheryl Palmer, will continue to lead the company, according to the statement.
This isn’t Berkshire’s first investment in the home-building business. The company also owns Clayton Homes, and owns shares in Lennar Corp. The deal comes at a time when homebuilding in the US has seen declines. New residential construction decreased 2.8% in April, according to government figures released earlier this month. Starts of single-family homes also declined 9%, which was the most since August.
Christopher Davis, a partner at Hudson Value Partners, said Abel’s comments about unifying Berkshire’s homebuilding operations over time are “a notable departure” from Berkshire’s trademark strategy of letting acquisitions run independently.
“Investors will welcome that evolution in approach,” Davis said.
Taylor Morrison, which is currently a publicly-traded firm, will become a private company upon completion of the deal.
“Over the last 13 years as a public company, we built a track record of strategic growth—expanding our geographic footprint, integrating acquisitions with discipline, and deepening our competitive strengths,” Taylor Morrison’s Palmer said in Sunday’s statement. “Berkshire Hathaway’s long-term orientation is uniquely well-suited to the multi-year investment cycle of homebuilding.”
Goldman Sachs Group Inc. and Moelis & Co. are serving as financial advisers, Simpson Thacher & Bartlett LLP is serving as legal adviser, and Mayer Brown LLP is serving as counsel to Taylor Morrison.