With a market cap of $234.6 billion, Wells Fargo & Company (WFC) is one of the largest financial services companies in the United States. The company provides a wide range of banking, investment, mortgage, and consumer and commercial finance products and services both domestically and internationally.
Companies valued at $200 billion or more are generally considered “mega-cap” stocks, and Wells Fargo fits this criterion perfectly. It operates through four main segments: Consumer Banking and Lending; Commercial Banking; Corporate and Investment Banking; and Wealth and Investment Management.
More News from Barchart
The San Francisco, California-based company stock has declined 20.7% from its 52-week high of $97.76. Shares of Wells Fargo have declined 4.8% over the past three months, lagging behind the Dow Jones Industrials Average’s ($DOWI) 4.2% gain over the same time frame.
www.barchart.com
WFC stock is down 16.8% on a YTD basis, underperforming DOWI’s 6.2% return. In addition, shares of the biggest U.S. mortgage lender have risen 5.2% over the past 52 weeks, compared to Dow Jones’ 21.2% increase over the same time frame.
The stock has been trading below its 50-day moving average since January. Also, it has fallen below its 200-day moving average since early February.
www.barchart.com
Shares of Wells Fargo fell 5.7% on Apr. 14 despite a slight EPS beat because investors focused on weaker-than-expected revenue and net interest income (NII). While Q1 2026 EPS of $1.60 exceeded estimates, revenue of $21.45 billion and NII came in at $12.10 billion, both missed consensus. Investor concerns were compounded by a 21.8% year-over-year increase in provision for credit losses to $1.14 billion, a decline in the CET1 capital ratio to 10.3%, and the company merely reaffirming its 2026 NII guidance of approximately $50 billion, below the consensus forecast.
Additionally, WFC stock has underperformed its rival, Citigroup Inc. (C). Citigroup stock has soared 7.9% on a YTD basis and 67.8% over the past 52 weeks.
Despite Wells Fargo’s underperformance, analysts remain moderately optimistic about its prospects. The stock has a consensus rating of “Moderate Buy” from 25 analysts’ coverage, and the mean price target of $97.81 is a premium of 26.1% to current levels.
On the date of publication, Sohini Mondal did not have (either directly or indirectly) positions in any of the securities mentioned in this article. All information and data in this article is solely for informational purposes. This article was originally published on Barchart.com
The filing follows a motion filed by the Commodity Futures Trading Commission (CFTC) on May 19, the day after the law was signed by Governor Tim Walz, arguing that the legislation violated the U.S. Constitution by criminalizing at the state level the operation of prediction markets governed by federal regulators.
In its filing, Kalshi claimed the law violates the Supremacy Clause of the constitution, which says the federal Commodity Exchange Act (CEA) grants the CFTC “exclusive jurisdiction” over derivatives and swaps traded on designated contract markets (DCMs).
The platform also challenged a provision that criminalizes the marketing or advertising of prediction markets, saying it violated the First Amendment.
On Wednesday, U.S. President Donald Trump said it was critically important that the CFTC maintain sole authority over prediction markets, echoing CFTC Chair Michael Seligl.
Kalshi has recently won similar preliminary injunctions against enforcement attempts in New Jersey and Arizona.
Prediction markets are facing challenges outside the U.S. and in the past week have been banned in countries including Indonesia, Spain and India.
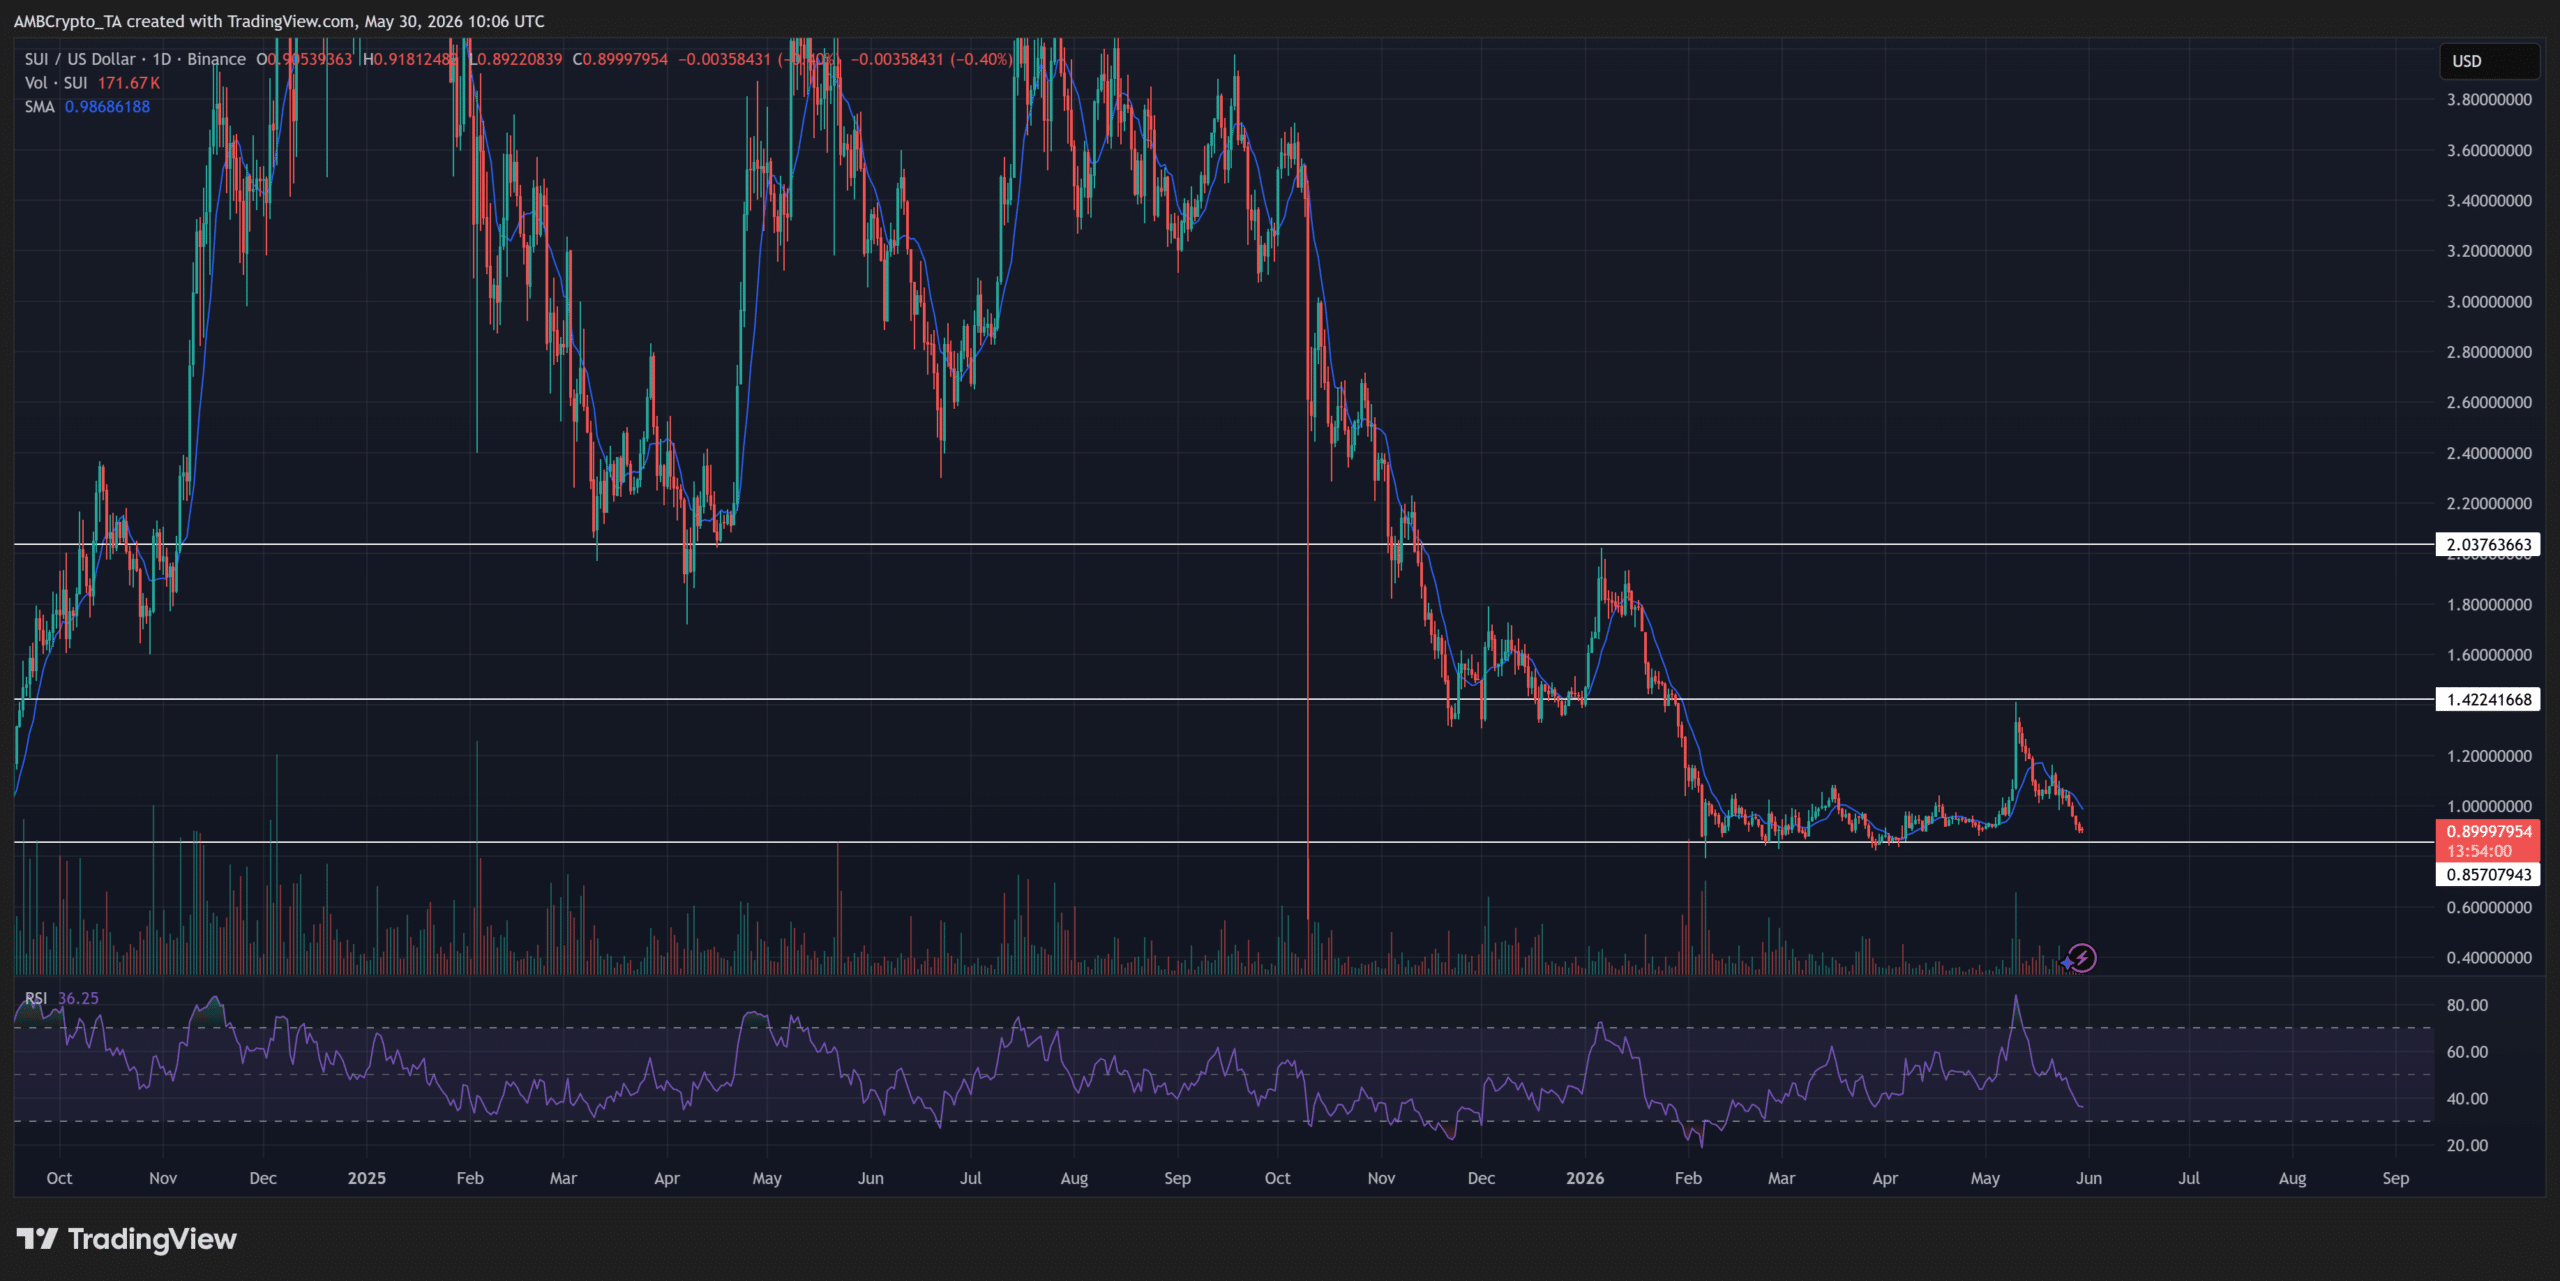
Sui remains locked in a long-term bearish structure that has persisted since its rejection near the $3.80 region.
Since then, the price has consistently formed lower highs and lower lows. It shows a market where sellers continue overpowering recovery attempts.
That trend accelerated during late 2025 as it lost the $2.04 support zone.
Once buyers failed to reclaim that level, bearish momentum strengthened further. The subsequent breakdown below $1.42 reinforced the shift, transforming a former demand area into overhead resistance.
Source: SUI/USD on TradingView
More recently, attention has shifted to the psychological $1.00 level. Buyers briefly defended this region throughout March and April, creating a period of consolidation.
However, repeated tests gradually weakened support, allowing sellers to regain control. As a result, SUI slipped toward the $0.86–$0.90 zone, where it currently trades.
Yet the structure is not entirely one-sided. The sharp rebound toward $1.40 during May showed buyers remain active at discounted levels.
Still, that rally failed to establish a higher high, suggesting demand continues absorbing supply rather than reversing trend direction.
This behavior implies market participants remain cautious. Until it reclaims $1.00 and begins forming higher lows, rallies may continue attracting sellers, leaving the broader trend tilted toward further weakness.
Network outages trigger a confidence crisis
Sui’s recent weakness extends beyond price action. The network itself has become a growing source of uncertainty.
On the 28th of May, Sui Mainnet stopped producing blocks, triggering an immediate 8% decline as traders reacted to operational risk rather than market volatility.
Although validators restored the network through a coordinated patch, another stall emerged less than 24 hours later. This marked Sui’s third major outage of 2026, raising concerns about upgrade reliability and validator coordination.
That timing proved especially damaging. The second outage occurred alongside its CME futures debut, undermining a key institutional catalyst.
Earlier payment-focused initiatives also faced scrutiny, as repeated disruptions challenged confidence in the coin’s infrastructure.
Meanwhile, Sui’s 1 June unlock will release 23.78 million SUI, adding fresh supply as sentiment remains fragile following recent network disruptions.
Source: CoinGlass
The broader implication is visible in relative performance.
SUI fell 20.1% over seven days, declining from approximately $1.13 on 23 May to $0.90 on the 29th of May. This suggests participants are reacting primarily to Sui-specific risks, while the upcoming unlock continues limiting recovery sentiment.
Final Summary
Sui [SUI] remains under pressure as network instability and repeated support failures continue weakening market confidence.
SUI now faces a critical demand test as fresh token supply enters an already cautious market environment.
On May 26, Piper Sandler lowered its price recommendation on Corebridge Financial, Inc. (NYSE:CRBG) to $31 from $35. It reiterated an Overweight rating on the shares. The firm said the change reflects recent stock performance and the passage of time. Piper noted that it has generally increased price targets for most insurance carriers while lowering targets for some insurance brokers. Its analysis takes a bottom-up approach. Following first-quarter results, the firm believes investors may be better served focusing on insurance carriers rather than brokers. According to Piper, underwriting performance provided stronger-than-expected support for carriers, while brokers delivered weaker organic growth results.
On May 13, BofA raised its price goal on CRBG to $41 from $40 and maintained a Buy rating on the stock. The analyst said that neither Corebridge nor Equitable (EQH) is currently included in the S&P indices. If a combination between the two companies were to occur and the merged company gained entry into the index, it could generate substantial demand for the shares. The analyst added that such demand could potentially exceed the impact of a share repurchase program.
Corebridge Financial, Inc. (NYSE:CRBG) provides retirement solutions and insurance products across the United States. The company works with financial professionals and institutions to help individuals plan, save, and build more secure financial futures.
While we acknowledge the potential of CRBG as an investment, we believe certain AI stocks offer greater upside potential and carry less downside risk. If you’re looking for an extremely undervalued AI stock that also stands to benefit significantly from Trump-era tariffs and the onshoring trend, see our free report on thebest short-term AI stock.
Prime Video has announced its first set of talent appearing at their inaugural Obsessed Fest – an immersive, all-day fan experience bringing audiences face-to-face with the creators and stars of the most popular YA shows, including Off Campus, Elle, The Love Hypothesis, The Devil’s Mouth, and more. The event celebrates the streaming platform’s expansive new initiative, Obsession Is In Session, which celebrates young adult storytelling, fandoms, and the communities that keep it going.
Taking place on Saturday, June 27 at nya Studios in Los Angeles, Prime Video transforms the fandom into an all-day celebration with exclusives, surprise moments, and access to your favorites, including Lili Reinhart and Tom Bateman from The Love Hypothesis; Benito Skinner, Wally Baram, and Mary Beth Barone from Overcompensating; Belmont Cameli, Stephen Kalyn, Jalen Thomas Brooks, Antonio Cipriano, Ella Bright, Mika Abdalla, Josh Heuston and creator/EP Louisa Levy from Off Campus; Matt Cornett, Michael Bradway, author Carley Fortune and showrunner/EP Amy B. Harris from Every Year After; Lexi Minetree from Elle; Gavin Casalegno, Lana Condor, and Tommi Rose from The Devil’s Mouth; Asha Banks and author Mercedes Ron from Your Fault: London; Ester Expósito from Drawn Together; Damian Hardung from Maxton Hall; Maia Reficco, Fernando Lindez, and author/producer Anna Todd from The Last Sunrise; and author Casey McQuiston from Red, White & Royal Wedding. More guests may be announced.
Prime Video’s Obsessed Fest
Prime Video
There will be tons of programs for fans to enjoy, including the main stage, which will have talent-led panels with exclusive footage and interactive fan moments. There’s a special book club designed for deep dives with your favorite YA authors, as well as signings, conversations, and workshops. Please remember to bring your own book!
For content creators, or budding ones, there will be a suite of cinematic content studios where fans can recreate scenes from popular titles and capture personalized photos and videos. There will also be a dedicated screening room to exclusive merchandise, food and drinks for purchase from LA’s food trucks, and a communal fan space to chat about what you’re obsessed with.
Amazon Music, the official audio sponsor for the event, will have its Amazon Music Lounge for fans to discover all the music from the Obsessed Fest shows, and “dive deeper into their favorite stories through exclusive programming.” There will also be a day-long DJ set to keep fans entertained.
For more information on Prime Video’s Obsessed Fest or to get tickets, click here.
The two biggest DeFi exploits of the past two months have one thing in common. They used a tool that does not exist on the XRP Ledger.
Thorchain lost roughly $10.8 million on May 15 to a cross-chain attack that drained funds across Bitcoin, Ethereum, BSC, and Base. Drift Protocol, a Solana-based decentralized perpetual exchange, and KelpDAO, a liquid restaking protocol on Ethereum, together accounted for more than $600 million in losses through April alone.
Cross-chain bridges have lost over $2.8 billion to attacks since 2021, per Chainalysis. And a significant share of these exploits used some variant of the same mechanic: flash loans.
A flash loan is a smart contract feature that lets a trader borrow millions of dollars with no collateral, on the condition that the loan is repaid inside the same transaction. The legitimate use cases include arbitrage between exchanges, collateral swaps without unwinding positions, and liquidation bots that maintain solvency in lending markets.
The attack pattern is the same mechanic pointed in the wrong direction.
A borrower takes out the loan, uses the funds to manipulate an oracle or drain a poorly designed pool, profits from the manipulation, and repays the loan, all before the transaction settles. If any step fails, the whole sequence rolls back, so the attacker risks nothing but gas fees.
The XRP Ledger does not let this work. A draft amendment filed on the XRPL standards repository earlier this week, proposing concentrated liquidity and StableSwap-style pools for the chain’s native automated market maker, included a single line in its Security Considerations section: “Flash loan attacks are structurally impossible. XRPL transactions are atomic without composable intra-transaction calls.”
What that means is that XRPL transactions either fully succeed or fully fail, like an Ethereum transaction. But unlike Ethereum, an XRPL transaction cannot call into another contract during its execution. The borrow-manipulate-repay sequence that defines a flash loan attack needs at least three nested operations inside a single transaction envelope.
That is a meaningful architectural choice, and it has a cost. Flash loans are not only an attack tool. They have become a structural component of Ethereum DeFi, with Aave, dYdX, and other major protocols offering them as a product. Arbitrage traders use flash loans to clear price differences between exchanges in a single atomic action.
Liquidation bots use them to keep over-collateralized lending positions solvent. Sophisticated DeFi users use them for collateral swaps that would otherwise require capital that gets tied up for hours. XRPL gives up all of that in exchange for closing the attack class entirely.
For most of XRPL’s history, the tradeoff did not matter because the chain’s DeFi footprint was small. That is changing. Tokenized real-world assets on the XRP Ledger have crossed $3 billion in total value, including the Ripple-JPMorgan-Mastercard-Ondo Finance pilot last month that processed a tokenized U.S. Treasury redemption in under five seconds.
The draft AMM amendment, if it passes, would close the capital-efficiency gap that has held XRPL DeFi behind Ethereum, opening the chain to a wider set of trading and yield strategies.
If the AMM amendment passes and XRPL’s DeFi liquidity grows toward something institutional capital can deploy at scale, the question becomes whether structural exploit resistance is a real competitive advantage or just a feature that institutions ignore in favor of where the liquidity already is.
Nvidia has been one of the most traded stocks in the world, and the leveraged ETFs that track it have become some of the most active names in daily ETF flows. NVDL, the GraniteShares 2x Long NVDA Daily ETF, is at the center of this trade — and it deserves a clear-eyed explanation before you buy in.
What Is NVDL?
NVDL is a single-stock leveraged ETF that seeks to deliver 2x the daily return of Nvidia (NVDA). If Nvidia goes up 3% in a day, NVDL aims to rise roughly 6%. If Nvidia falls 3%, NVDL falls roughly 6%.
It does this using total return swaps — derivative contracts with a counterparty that provide leveraged exposure without the fund actually owning 2x the Nvidia shares. The fund is managed by GraniteShares and trades under the ticker NVDL on the Nasdaq.
NVDL vs NVDU: Two Leveraged Nvidia ETFs
There are two main competitors in the leveraged Nvidia space:
Feature
NVDL
NVDU
Issuer
GraniteShares
Direxion
Leverage
2x daily
2x daily
Full Name
GraniteShares 2x Long NVDA Daily ETF
Direxion Daily NVDA Bull 2X Shares
Expense Ratio
1.05%
0.92%
AUM
Larger (more established)
Smaller
Options Activity
Higher volume
Lower volume
Both ETFs do the same thing and track each other closely day-to-day. NVDL has been around longer and has more trading volume, making it the more liquid choice. NVDU has a slight cost advantage on paper. For most investors, NVDL is the default due to liquidity.
How 2x Leverage Actually Works
The key word in NVDL’s name is daily. The fund resets its leverage each trading day, which has an important consequence: the leverage compounds daily, not over the long term.
Here’s a simple example of why this matters:
Day
Nvidia Return
NVDA Price
NVDL Return
NVDL Price
Start
—
$100.00
—
$100.00
Day 1
+10%
$110.00
+20%
$120.00
Day 2
-10%
$99.00
-20%
$96.00
After two days, Nvidia is down 1% ($100 → $99). But NVDL is down 4% ($100 → $96). The asymmetry gets worse the more volatile the underlying stock is. This effect is called volatility decay (or “beta decay”) and it’s the primary reason leveraged ETFs underperform over time, even when the underlying stock ends up in the same place.
Volatility Decay: The Hidden Cost of Leverage
Volatility decay isn’t a fee or a mistake — it’s a mathematical reality of daily-rebalancing leverage. The more a stock swings up and down without trending, the more value a 2x ETF bleeds.
For Nvidia specifically, this is a big deal. NVDA regularly moves 3–8% in a single session around earnings, analyst calls, or macro events. That kind of volatility accelerates decay dramatically.
In a strong, sustained uptrend — like Nvidia’s 2023 AI-driven surge — NVDL can dramatically outperform. In a choppy, sideways market, it loses money even if the underlying stock is flat. In a sharp drawdown, the losses compound faster than most investors expect.
The Real Performance Numbers
When Nvidia is on a tear, NVDL looks extraordinary. When Nvidia corrects or consolidates, NVDL’s losses can be brutal and don’t automatically recover when NVDA bounces back to its prior high — because the leveraged fund needs a bigger recovery percentage than the stock itself to get back to even.
For example: if NVDL falls 50%, it needs a 100% gain just to break even. If Nvidia itself fell 25% (causing NVDL to drop ~50%), Nvidia only needs a ~33% recovery to get back to its high — but NVDL needs twice that, in perfectly trending conditions, with no additional volatility drag.
Who NVDL Is For
NVDL is a legitimate trading tool — but it’s built for specific use cases, and most retail investors aren’t in those use cases.
NVDL makes sense if you are:
A short-term trader holding for hours to days, not weeks or months
Using it as a hedge against a short position in Nvidia
An options trader using it as a liquid underlying for expressing near-term directional views
Comfortable monitoring and sizing the position carefully as part of a broader active trading strategy
NVDL does not make sense if you are:
A long-term investor who wants Nvidia exposure in a buy-and-hold portfolio
Dollar-cost averaging into a position over months
Investing money you can’t afford to lose a significant percentage of quickly
Trying to “catch up” after missing Nvidia’s run — the math punishes late entries in volatile markets
NVDL vs Buying Nvidia Directly
For most investors, this comparison isn’t close: buying Nvidia stock directly is almost always the better long-term choice.
Here’s why:
No volatility decay. NVDA stock doesn’t have the daily-reset problem. It compounds normally over time.
No expense ratio drag. NVDL charges 1.05%/year; NVDA costs nothing to hold (beyond trading commissions).
No counterparty risk. NVDL’s returns depend on swap contracts with financial counterparties. NVDA is direct ownership of the company.
Cleaner tax treatment. Leveraged ETFs can generate more short-term capital gains due to daily rebalancing activity inside the fund.
If your conviction is “I want to own Nvidia for the long run,” owning more Nvidia shares is cleaner, cheaper, and more reliable than owning NVDL.
The case for NVDL over direct NVDA is essentially: you want amplified short-term gains and you’re actively managing the position. That’s a trading argument, not an investing one.
Position Sizing and Risk Management
If you do trade NVDL, position sizing is critical. Because of leverage decay, large allocations can devastate a portfolio during a Nvidia downturn. Most experienced traders who use leveraged single-stock ETFs keep them to a small percentage of total portfolio value — often under 5% — and treat them as a tactical trade with a defined exit, not a core holding.
A stop-loss order and a clear thesis (“I’m holding this through earnings, then exiting”) are essential. “I’ll hold until it recovers” is not a strategy for a daily-reset leveraged product — it can take far longer and require far higher prices to recover than intuition suggests.
The Bottom Line
NVDL is one of the most actively traded ETFs in the market right now for a reason — Nvidia’s AI dominance has made it the most watched stock in the world, and leveraged versions amplify every move. But amplification cuts both ways, and the daily-reset mechanism means NVDL is a wasting asset in anything other than a straight-line uptrend.
For traders with a defined short-term view on Nvidia: NVDL or NVDU are useful tools. For long-term investors who simply want Nvidia exposure: own the stock directly. The fees, the decay, and the complexity of leveraged ETFs work against you over any horizon longer than a few days.
This article was generated with the assistance of artificial intelligence and reviewed by ETF.com staff.
Investment Risk Disclosure The information provided on this website is for informational and educational purposes only and does not constitute investment advice, financial advice, trading advice, or any other sort of advice. Nothing on this site should be construed as a recommendation to buy, sell, or hold any security or financial product. General Investment Risks Investing involves risk, including the possible loss of principal. Past performance is not indicative of future results. The value of investments may fluctuate, and investors may receive back less than they originally invested. There is no guarantee that any investment strategy will achieve its objectives. ETF-Specific Risks Exchange-traded funds (ETFs) are subject to risks similar to those of stocks and other equity securities. ETF shares are bought and sold at market price, which may differ from the fund’s net asset value (NAV). Brokerage commissions may apply and will reduce returns. ETFs may be subject to the following additional risks:
Market Risk: The value of an ETF may decline due to broad market fluctuations unrelated to the underlying securities. Liquidity Risk: Some ETFs may have limited trading volume, which could make it difficult to buy or sell shares at a desired price. Tracking Error Risk: An ETF may not perfectly replicate the performance of its benchmark index. Concentration Risk: Sector or thematic ETFs may be concentrated in a particular industry or geography, increasing volatility. Currency Risk: ETFs that invest in international securities may be affected by exchange rate fluctuations. Leverage and Inverse Risk: Leveraged and inverse ETFs are designed for short-term trading and may not be suitable for long-term investors. These products use derivatives and may experience significant losses.
No Warranty While efforts are made to ensure the accuracy of information presented, no warranties are made regarding completeness, accuracy, or timeliness. Information may change without notice. Not a Fiduciary This site does not act as a fiduciary on behalf of any user. Users are encouraged to consult with a registered investment advisor, financial planner, or other qualified professional before making any investment decisions.