Home Blog Page 64

Janus International (JBI) Q2 2026 Earnings Call Transcript

0
Janus International (JBI) Q2 2026 Earnings Call Transcript


Ramey Pierce Jackson: Thanks, Sara, and good morning, everyone. Thank you all for joining our call today. Second quarter results reflected a continuation of the macroeconomic trends we have discussed throughout the year. As the operating environment remained challenging across many of the markets we serve. While we remain focused on execution and serving our customers, these factors had a greater impact on demand than we anticipated. As a result, total revenue totaled $233.5 million and adjusted EBITDA was $40.2 million Based on our year to date performance and current visibility, we are revising our full year guidance. Demand levels across our core business have not trended as we expected. And we believe it is appropriate to reflect that reality in our outlook.

While we have updated our expectations to reflect current market conditions, our conviction in our strategy remains unchanged. We remain focused on executing against the priorities that we believe will strengthen the business and create long term value. Let me take a few minutes to discuss our progress on those initiatives. As a reminder, we refer to our strategic framework as grow: greater penetration of self storage, ramping adoption of smart security solutions, outperforming in the commercial market, and winning through strategic accretive acquisitions. Beginning with greater penetration of self storage, market conditions remain challenging during the quarter, predominantly in North America new construction. Where project activity and customer investment levels continue to be constrained. Particularly among our smaller customers.

We continue to expand and refine our product offering in order to adapt to our customers’ changing needs, including our R3 business, international presence, and design build capabilities allowing us to deliver more comprehensive solutions. Integration of our Kiwi II Construction acquisition remains on track. Jason will speak further to our expectations for the business this year shortly. Next, ramping our smart security solutions through our Nokē SmartEntry platform, during the quarter, we reached a significant milestone of surpassing 500 thousand installed Nokē units. This achievement reflects years of investment and execution and marks an important inflection point for the platform. As we have discussed in prior periods, scale has always been a critical component of the Nokē strategy.

Reaching this stage marks an important step in that journey and supports our ongoing efforts to improve profitability and drive greater recurring revenue over time. Adoption of Nokē continues to increase. Reinforcing the meaningful value in solutions that help our customers improve operational efficiencies, enhance security, and streamline facility management. As we continue to advance our product road map, we have been encouraged by the initial interest in Nokē Infinity. Our on door dual technology smart locking system we announced earlier this year. We expect Nokē Infinity will be available for factory install on both roll up and swing doors beginning in fourth quarter.

The third priority of our growth strategy is increasing our share of the market for commercial doors. While commercial sheet door demand remains soft, we are seeing benefits from our expanded distribution footprint and architectural specification initiatives. Our efforts in the data center space also continue to progress. We are exploring new product capabilities and continuing to position ourselves as a strategic manufacturing partner for OEMs. Our final priority is winning through disciplined M&A. Strategic acquisitions remain an important component of our strategy. And we continue to evaluate opportunities that enhance our capabilities. Expand our solutions offering, and support long term value creation.

Combined with our scalable operating platform, this disciplined approach enables us to pursue growth while maintaining a relatively low capital intensity business model. And strong cash flow generation. As we look ahead, we will continue to focus on what we can control. Executing with discipline, supporting our customers while adapting to their changing needs, optimizing our operations, and advancing our strategic priorities. While market conditions remain challenging, our revised guidance reflects our best assessment of the current demand levels and positions us to execute against expectations that we believe are achievable. With that, I will now turn the call over to Anselm for a more detailed review of our results and to discuss our revised 2026 guidance. Anselm?

Anselm Wong: Thank you, Ramey, and good morning, everyone. Ramey spoke to our strategy and results at a high level. And I will focus my remarks on financial performance in the second quarter and our updated 2026 guidance. For the second quarter, consolidated revenue of $203.5 million increased 2.4% as compared to the prior year. Inorganic revenues for the quarter were $19.2 million reflecting contributions from Kiwi II Construction. At the sales channel level, our self storage business was up 15.4% New construction up 20.3% while R3 is up 6.6% for the quarter. The increase in revenues for new construction was driven by contributions from Kiwi II Construction, and strength in our international business, which offset continued softness in North America.

On an organic basis, new construction revenues were flat compared to the prior year, The increase in R3 revenue was driven by increases in door replacements and redevelopment activity as well as increased conversion and expansion activity. In the second quarter, total revenues in our international segment increased to $31.1 million up 9.5% compared to the prior year period driven by growth in new construction and market share gains. For the quarter, revenue in our Commercial and Other segment decreased by 21.2%. The decline was primarily driven by continued softness in demand for commercial sheet doors. Second quarter adjusted EBITDA of $40.2 million, down 18% compared to the second quarter of 2025.

This resulted in an adjusted EBITDA margin of 17.2%. A decrease of approximately 430 basis points from the prior year period. The decrease in margins year over year is primarily attributable to the impacts of geographic segment and product mix. For the second quarter, we produced adjusted net income of $23.9 million compared to adjusted net income of $28.2 million in the prior year period. Adjusted EPS for the quarter was $0.17. We generated cash from operating activities of $24.4 million and free cash flow of $21.6 million in the quarter. On a trailing 12 month basis, this represents a free cash flow conversion of adjusted net income of 129%. Capital expenditures in the quarter were $2.8 million.

We ended the quarter with $205.3 million in total liquidity including $127 million of cash and equivalents on the balance sheet. Our total outstanding long term debt at quarter end was $550 million and net leverage was 2.7x within our target range of 2x to 3x. Our liquidity levels allow us flexibility in our capital deployment, During the quarter, we repurchased approximately 367 thousand shares of our common stock for a total of $1.9 million. Year to date, we have repurchased approximately 3.2 million shares of common stock for a total of $17.6 million. We had $63 million remaining on our share repurchase authorization at quarter end. Now moving to our 2026 guidance.

As Ramey noted, we continue to face a challenging operating environment. With demand trends remaining more muted than expected. In light of current market realities, we have adjusted our expectations for the year to the environment we are seeing today and to align with what we believe is a prudent and achievable set of expectations. We have yet to see the macro environment stabilize as we anticipate entering the year, which has contributed to slower activity across portions of our core business. Reflecting ongoing inflationary pressures and stagnant housing demand across North America.

As a result, we now expect full year revenue in the range of $925 million to $945 million Additionally, due to delays and extended project timelines on certain projects originally anticipated to be completed this year, we are adjusting our expectations for inorganic revenue from Kiwi II Construction to be approximately $80 million to $90 million. We now expect North America organic self-storage revenues to be down high single digits compared to 2025 driven mostly by continued softness and new construction. In our commercial sales channel, we now anticipate revenues to be roughly flat On the international side, we expect high single digit revenue growth.

From a profitability standpoint, we continue to manage costs and remain focused on operational efficiency, while optimizing our footprint to better align with current demand. While lower forecasted volumes, negative mix, and inflationary pressures across the supply chain have put pressure on margins year to date, we anticipate the benefits from these actions will result in a sequentially stronger back half. As a result, 2026 adjusted EBITDA is now expected to be in the range of $150 million to $170 million This reflects an adjusted EBITDA margin of 17.1% at the midpoint. We continue to anticipate being around the higher end of the free cash flow conversion of adjusted net income target range of 75% to 100%.

Our updated guidance reflects current market conditions and our best assessment of demand trends for the remainder of the year. Importantly, we continue to generate strong cash flow. Maintain a healthy balance sheet, and invest in the strategic initiatives that we believe will drive long term growth and shareholder value. Please refer to the presentation we have posted for additional details on the key planning assumptions for 2026. Thank you all for your time. I will now turn the call over to Ramey for his closing remarks. Ramey?

Ramey Pierce Jackson: Thank you, Anselm. Janus continues to hold a strong position in an attractive industry. But it is clear that current market conditions remain challenging. Importantly, we continue to make meaningful progress against our strategic priorities. Surpassing 500 thousand installed Nokē units marks an important milestone for the platform. And demonstrates continued adoption of the technology enabled solutions across the self storage industry. While new construction activity, particularly in North America, remains constrained, and we expect market conditions to remain challenging in the near term, we are encouraged to see improving sentiment from some of our larger customers. The long term fundamentals of self storage remain favorable. Industry occupancy levels remain healthy. Household utilization continues to grow.

And ongoing consolidation among operators continues to support investment facility upgrades. Modernization and operational efficiency. Although we cannot control the macroeconomic environment, we can control how we respond. We remain focused on serving our customers, optimizing our operations, managing our costs with discipline, and allocating capital responsibly. Supported by a strong balance sheet and healthy cash generation, we believe we are well positioned to emerge even stronger when market conditions improve. In closing, I want to thank our team, customers, and shareholders for your support. We appreciate your participation on today’s call. Operator, we would now like to open up the lines for Q and A, please.

Operator: Thank you. Press star 1 on your keypad now. To leave the queue at any time, please press star 2. Once again, that is star 1 to ask a question. Our first question today comes from Phil Ng with Jefferies. Your line is open.

Phil Ng: Hey, guys. Appreciate all the color. If I look at your new construction business in 2Q, frankly, if you strip out Kiwi, organic sales were kind of flattish. I guess, can I kick things off? Anselm, anything to revise outlook the guidance we are forecasting a weaker demand environment. it is feels like it is more new construction. Maybe some of the projects getting pushed out in Kiwi, but can you expand a little you know, what you are seeing and how trends kind of progress each quarter going to July and August?

Anselm Wong: Yeah. The markets, like we said, it is it is just similar to first half we are expecting into the second half. And what we saw just unfortunately in our billings business, Kiwi, we saw some project push outs, and that is why we kinda revised that piece of it. But that seems to be the similar trend that we have seen across the board in terms of just, that push-out delays that we are seeing on those projects. The good thing is that what we reviewed is that there is not been cancellations. it is just been a timing push out.

Phil Ng: Okay. But the weakness in you can did it progressively get worse into quarter? I mean, Kiwi aside, it sounds like it is more timing related. But what about the construction on your No.

Anselm Wong: it is about the same. I– What do you say? Yeah. New construction is relatively the same like we said. I think the biggest thing you saw was commercial just, you know, not getting the upturn that we were expecting that we would get. Okay.

Phil Ng: Was my next question. Right? Commercial has generally been pretty benign, and this was the big drawdown down 20-21%. Is this timing related? Is this like, what is driving the big shortfall on commercial side of things?

Ramey Pierce Jackson: Yeah. I will take that 1. Morning, Phil. it is Ramey. I think the biggest yeah. The biggest drag on our commercial revenue is specifically the commercial sheet doors. Which predominantly are installed in pre engineered metal buildings. And that end market has obviously, has headwinds. And so that was really the biggest drag on the miss there. But when you think about the category, our rolling steel product is continuing to grow continuing to perform well. We mentioned our strategic strategies around architectural specifications. That was super important and has been ongoing for over a year, and that is starting to pay off.

We are we are kind of obviously in the data center space, which is in growth mode, so we are excited about that. But to answer your question on the miss, it is really it is the commercial sheet door product specifically.

Phil Ng: Okay. And sorry to sneak 1 more in. R3 has been actually it is been a bright spot, and it is been a bright spot for a few quarters. Ramey, perhaps on that front, I suspect all the M and A activity from some of your larger weak customers have contributed to that. Just curious. How’s the outlook looking for R3 in the back half? Is there gonna be a smooth, handoff from 1 large deal to that, or just give us a little more context on what you are seeing on the R3 side? As we look out to the back half this year?

Ramey Pierce Jackson: Yeah. there is a lot there. I think to your point around consolidation, look, that certainly plays an important role in the investment, but that is not, you know, 100% where we are seeing the uptick in R3. Think about you know, mostly institutional customers, and they are just right-sizing and shoring up their facilities during this during this downtime. So we mentioned that conversions and expansions are is a growing piece of the business, and that is what we are seeing. So pretty happy with the progress there and the way that is trending on the backlog and pipeline as it relates to R3.

We just have to continue to refine our products to make sure that we are in the right spot for obviously, this ever changing market. But we are pretty pleased with the R3 initiative.

Phil Ng: Okay. Appreciate the color, guys. Thank you.

Operator: Our next question will come from Jeffrey David Hammond with KeyBanc Capital Markets. Your line is open.

David Tarantino: Hey, good morning, everyone. This is David Tarantino on for Jeffrey. Maybe just starting on the margins, could you just give us a little bit more color on the lower margin outlook? Is this just simply on the lower volumes? And then maybe give us some color on kind of the key buckets that support second half improvement versus the first half?

Anselm Wong: Sure. Thanks, David. If you think about the margin just the volume the sales volume drop is really the big change that impacted the rate there. The sec the first half to second half improvement, and you obviously saw it in Q2, is a lot of the optimization that we have been talking about. If you look at the factory consolidations and optimizations, we have been just looking at the volume in and aligning the resources to fit with the volumes that we are seeing there. We are also looking at the back office, looking at just in general, we should be doing all the time, which we are doing all the time.

And now we are finally starting to see some of that benefit come through. The other last big bucket is, as you saw, steel prices have been going up. And we have been monitoring that, managing that well, and, you know, making sure that we maintain our, you know, commercial actions to offset that piece of it. So that is why those–all those big buckets together walk you through the second half improvement.

David Tarantino: Okay. Great. And then maybe following up on the new construction market, it looks like Kiwi is tracking a bit lower. So maybe could you confirm whether kind of the core business is also maybe tracking a bit lower? And kind of maybe give us some details on what you are seeing and pipeline of construction activity here that is maybe informing kind of the color on NA tracking maybe a bit weaker than you expected?

Anselm Wong: Yeah. The core business is tracking about similar. So I do not think there is been a really a big change for the core self-storage piece. Yeah. I think Kiwi is the more the–the bigger piece where we saw the timing on some of the timing of projects push out, and that is what the kind of bigger thing. And, like, you just need a reminder. The big piece of the adjustment of the forecast is more is more related to the commercial sheet door piece that we know, we talked about earlier.

David Tarantino: Okay. Great. that is helpful. Thanks, guys. Thanks.

Operator: Thank you. Our next question will come from John Lovallo with UBS. Your line is open.

Matt Johnson: Hey. Good morning, guys. This is Matthew Johnson on for John. Appreciate the time here. Yeah. If we could just talk about yeah. Hi. If we could talk about gross margin in the quarter, I think it was down, I do not know, somewhere around 56 basis points year over year. Which was down a bit more relative to the first quarter. I know you guys called out, I think it was some product and some geographic mix impacting that. But I guess could you guys just maybe talk a little bit about how we should think about the drivers in terms of mix versus Kiwi versus price cost versus just anything else in there?

Anselm Wong: Yeah. Price as you saw in the quarter was minimal for this quarter as we had, you know, said earlier in the last call. I think if you look at it, the biggest issue was just the mix. So obviously, our smaller businesses that have a smaller, lower gross margin profile than, say, our big business, Janus Core, As you saw Janus Core, you saw the growth in the other ones, and that is you know, what accounts for that margin decline. Year over year as some of the smaller businesses are growing.

Matt Johnson: Appreciate that. Now I guess my second question, if we could just put a finer point on the outlook for Kiwi here. I think you guys lowered the sales outlook by about 10 million. I think it is about 11% I think last quarter, you guys had said that Kiwi had a pretty strong backlog coming into the year, which gave them pretty good visibility for 2026.

It sounds like there were some delays, but I guess could you just talk a little bit about what kind of what you saw with those delays? what is driving the expected ramp in Kiwi sales in the back half, and maybe any color you can give on how the backlog for Kiwi looks now?

Anselm Wong: Yeah. I think the backlog is still pretty strong, like we said. there is been no change to the total backlog that we are seeing. Think the biggest thing we just saw is just, you know, some of our customers are just, you know, time getting their facilities that were brought online to get those up to speed first. Before they start on some of these other projects that are in the pipeline. So I think it is you will see a little more step up there But, again, I think it is just more balancing of these are large projects, and we always, you know, say that it is hard to predict when they do start.

But the good thing is we review them all and the projects are still intact.

Matt Johnson: Appreciate it. Thanks, guys. Thank you.

Operator: Our next question will come from Dan Moore with CJS Securities. Your line is open.

Will: Hey. This is Will on for Dan. A lot of my questions have been answered. Keep it short. Just can you talk about your expectations for working capital and free cash flow for the remainder of the year? And then what are your near term priorities for capital allocation? How are you thinking about the desire to deleverage versus further M and A and share repurchases?

Anselm Wong: Sure. Thanks for the question. I think, look, working capital has been fairly steady. I think we have continued to look at optimizing it. And I think if you think about cash flow, our guide is saying we will be in the higher end of the conversion percentage as we have shown in the first half. So pretty good cash flow that we are expecting for the second half as well. I think in terms of capital allocation, honestly, you know, CapEx is a, you know, small for our business in general, so it will stay relatively small. there is not any major investments that are coming up from that point of view from the operations that are needed.

And I will see the other 2, you know, choices If you think of our debt, our debt is, you know, has another couple of years until a probable refinance issue. So there is not a big push on that piece of it. I think the last lever in terms of share buyback, obviously, at current prices are very attractive for us, and you will see, you know, us to continue that action that we have seen in, you know, the first half.

Will: Thank you. Thanks.

Operator: Thank you. Our next question comes from Reuben Garner with The Benchmark Company. Your line is open.

Reuben Garner: Thank you. Good morning, guys. Just wondering if you could, most of my questions have been answered. I just have 1. Can you elaborate on the cost actions you are taking? We look like there were some kind of lower SG&A maybe than we expected in this past quarter. But was that a start or from the start in some of the cost actions you have taken to address the lower demand? Is that where we would see it, as the year winds down? Thanks, guys.

Anselm Wong: Yeah. So, Rumi, I think it is along the lines we have always said. We are always optimizing the entire business, not just the operation, but everything. So what you are seeing is just us continue to look at, hey, where’s the volume is, where the revenue is, and let’s take the right prudent action to manage cost for the company. So it is not just 1 area. it is across the board.

Operator: Thank you. This concludes our question and answer session. I will now turn the meeting back over to Ramey Pierce Jackson.

Ramey Pierce Jackson: For closing remarks. Okay. Thank you all for joining us today. We appreciate your support of Janice and look forward to updating you on our progress. Have a great day.

Operator: Thank you. That brings us to the end of today’s meeting. We appreciate your time and participation. You may now disconnect.

Should you buy stock in Janus International Group right now?

Before you buy stock in Janus International Group, consider this:

The Motley Fool Stock Advisor analyst team just identified what they believe are the 10 best stocks for investors to buy now… and Janus International Group wasn’t one of them. The 10 stocks that made the cut could produce monster returns in the coming years.

Consider when Netflix made this list on December 17, 2004… if you invested $1,000 at the time of our recommendation, you’d have $419,408!* Or when Nvidia made this list on April 15, 2005… if you invested $1,000 at the time of our recommendation, you’d have $1,348,694!*

Now, it’s worth noting Stock Advisor’s total average return is 966% — a market-crushing outperformance compared to 213% for the S&P 500. Don’t miss the latest top 10 list, available with Stock Advisor, and join an investing community built by individual investors for individual investors.

See the 10 stocks »

*Stock Advisor returns as of August 19, 2026.

This article is a transcript of this conference call produced for The Motley Fool. While we strive for our Foolish Best, there may be errors, omissions, or inaccuracies in this transcript. As with all our articles, The Motley Fool does not assume any responsibility for your use of this content, and we strongly encourage you to do your own research, including listening to the call yourself and reading the company’s SEC filings. Please see our Terms and Conditions for additional details, including our Obligatory Capitalized Disclaimers of Liability.

The Motley Fool has positions in and recommends Janus International Group. The Motley Fool has a disclosure policy.

Janus International (JBI) Q2 2026 Earnings Call Transcript was originally published by The Motley Fool

Source link

Bitcoin whales buy $2.64B as Bhutan moves 300 BTC – Bear trap next?

0
Bitcoin whales buy $2.64B as Bhutan moves 300 BTC – Bear trap next?


 Is Bitcoin at a bullish STH-to-LTH transition?

According to Lookonchain data, the Royal Government of Bhutan has moved another 300 BTC worth $19.28 million, adding to its recent selling spree.

The timing couldn’t be worse, with BTC trying to break into the $65k-$70k range, which is a zone they haven’t been able to return to since losing it in late May. This suggests that this range has the potential to be a strong resistance.

On the contrary, when it comes to whales, the situation is completely different.

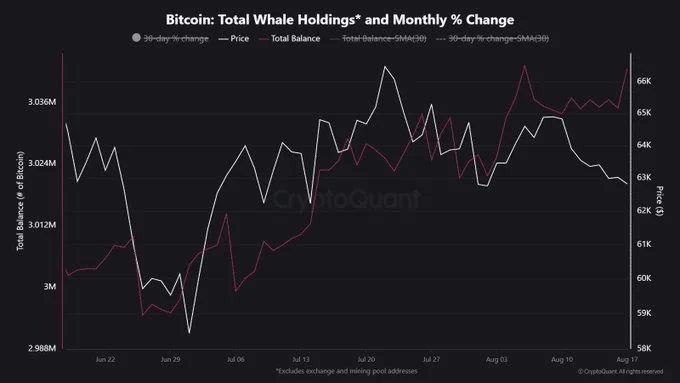
As we can see in the chart below, whales have bought $2.64 billion worth of BTC in the last two months. So, structurally speaking, this may indicate a bullish STH-to-LTH transition as BTC moves from short-term holders to long-term ones.

Bitcoin whales
Source: CryptoQuant

However, the significance extends beyond structure.

The logic is simple: Sure, the development suggests increased conviction from whales. This could be positive for Bitcoin, giving it a stronger base, especially with all the selling pressure building around resistance.

That said, this dynamic could also strengthen Bitcoin’s [BTC] technical credibility.

Despite the absence of ETF inflows, rising institutional selling, and heightened market FUD, BTC has been able to maintain a narrow range for the past two months, a pattern that aligns with the observed accumulation by whales.

That makes this accumulation look more “strategic” than random, a divergence that could prove important against the current macro backdrop and heading deeper into the Q3 setup.

Bitcoin whale accumulation raises fresh bear trap signals

The resilience of Bitcoin in the current market environment is difficult to ignore.

With yields on the 10-year Treasury up to 4.7% and those on the 30-year nearing 5.3%, the environment is hostile to risk assets. Meanwhile, the situation between Iran and the U.S. continues to be a source of concern for investors.

The result? A widening Bitcoin-Nasdaq divergence.

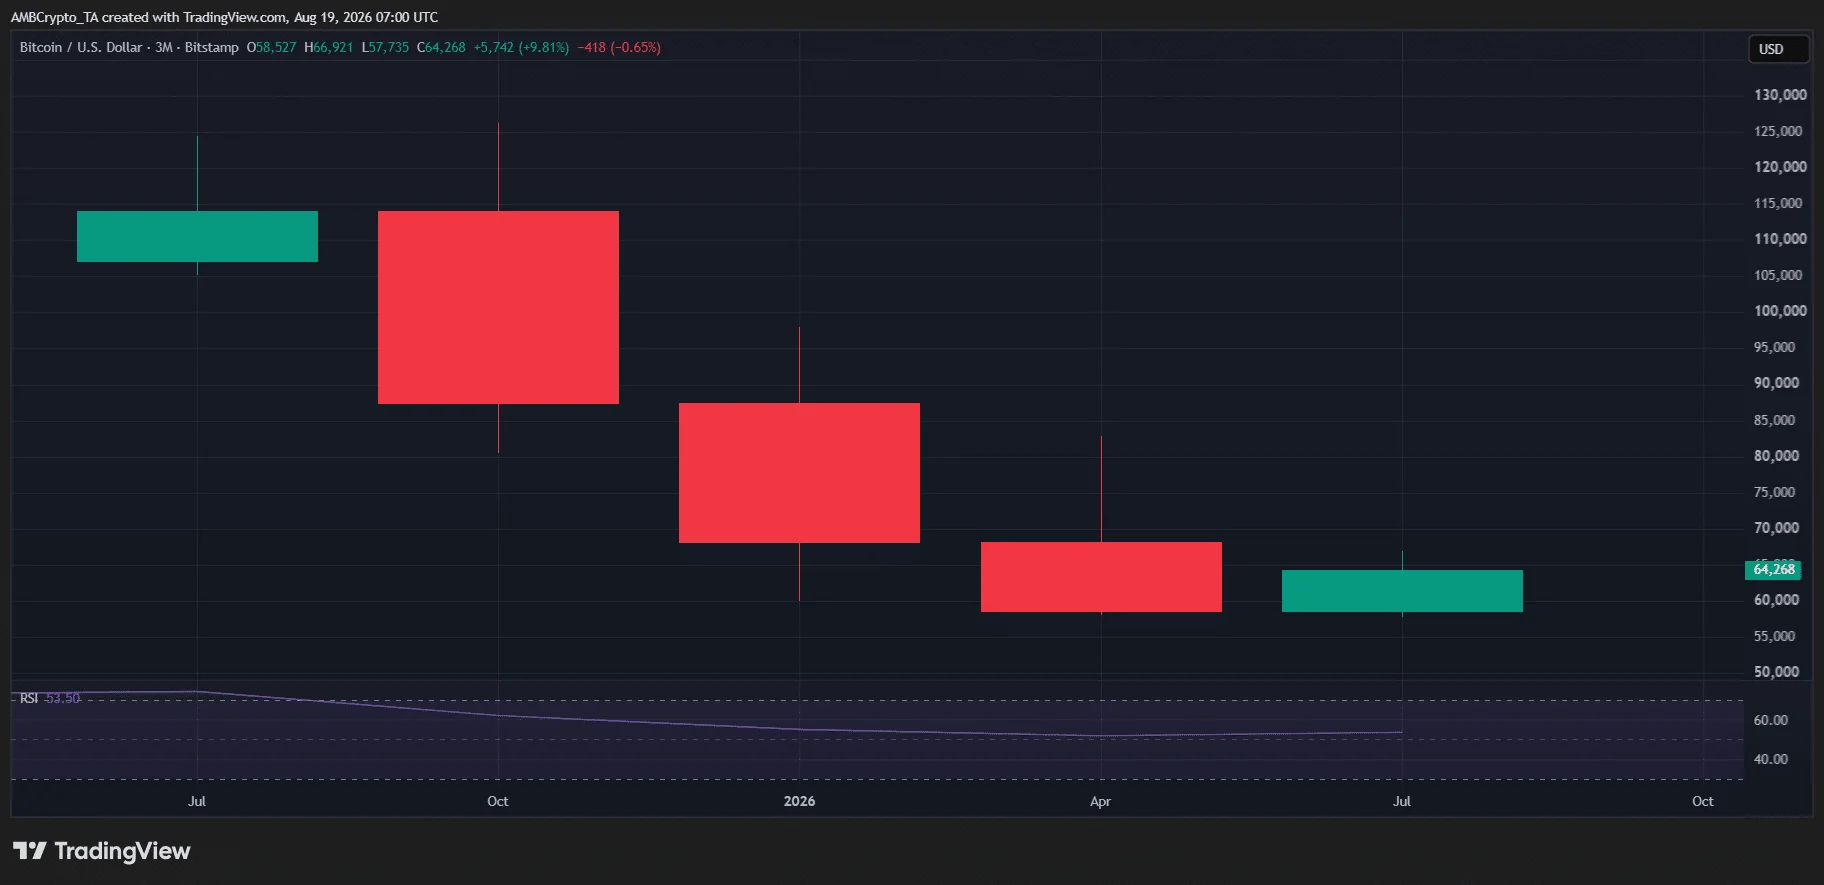
Interestingly, the bears’ activity in the equity market has increased, with the Nasdaq down almost 3% for the quarter. This places the Nasdaq well below Bitcoin, which has delivered a positive ROI of almost 9% for the same period.

This is an intriguing observation as it provides further validation for Bitcoin as a superior asset in a risky environment, able to withstand macro FUD that hurt traditional investments.

NASDAQNASDAQ
Source: TradingView (BTC/USDT)

Against this backdrop, Bitcoin whale accumulation takes on an even more bullish light, with BTC’s consolidation near $65k increasingly looking like strategic positioning. This is especially the case compared to the broader market, causing the BTC-Nasdaq gap to widen by the day.

This trend naturally puts Bitcoin shorts at risk, as an STH-to-LTH transfer is underway, which could very well be the setup for a significant bear trap to unfold underneath BTC’s accumulation. If this scenario plays out, liquidation of short positions would propel Bitcoin to $70k and higher by the end of Q3.


Final Summary

  • Whale buying suggests BTC’s $65k consolidation could be a bear trap.
  • BTC’s strength against the Nasdaq could set up a short squeeze toward $70k.


Source link

Jim Cramer says market pessimism is creating buying opportunities

0
Jim Cramer says market pessimism is creating buying opportunities


Jim Cramer said Tuesday that widespread pessimism in financial markets is pushing down prices even as parts of the economy remain strong, creating what he sees as attractive entry points for investors willing to absorb near-term volatility.

His comments came against a backdrop of climbing Treasury yields, stubborn inflation, and surging oil prices that dragged stocks lower across the board Tuesday. The 30-year Treasury yield reached 5.33% while Brent crude crossed $90 a barrel, with diplomatic talks between the U.S. and Iran showing no signs of progress.

“I know ‘not bad’ isn’t much of a clarion call. But you’re certainly getting better prices than you’d see if the backdrop were good,” the “Mad Money” host said on CNBC. “Maybe that’s the way to think about it. That’s the opportunity, and the cost seems to be manageable, even if this likely isn’t the exact bottom.”

Cramer argued that fears surrounding both oil and bonds may be overdone. In his view, Brent crude is unlikely to climb much past $100 a barrel, given that new supply is set to enter the market. On the bond side, he said higher Treasury yields could draw in buyers seeking to lock in returns on government debt — which would, in turn, push yields lower, since bond yields move inversely to prices.

Technology is another area where he sees opportunity. Noting that short positions against the Nasdaq 100 have hit a record, Cramer said he is taking advantage of the selloff to buy beaten-down data center stocks. Micron was one name he singled out; his Charitable Trust — the portfolio behind CNBC’s Investing Club — picked up shares as demand for AI-related memory chips has surged.

Consumer spending gave Cramer additional reasons to avoid a bearish stance. On the consumer side, Airbnb’s results showed vacationers still spending freely, and Club name Home Depot posted what Cramer described as its “best quarter in five years.” “All I can tell you is that, at the end of the day, we’re a service economy,” Cramer said. “If service is doing well then you can’t be too negative.”

Cramer’s Charitable Trust’s interest in Micron fits a broader view he has expressed on memory stocks. He argued earlier this week that AI data centers have created a persistent shortage of memory capacity, with manufacturers now locking in revenue through extended customer contracts rather than expanding production. Cramer said he believes Micron could double again before the current AI-driven boom ends, though he acknowledged that a slowdown in data center construction or a new wave of supply additions could end the rally.


Source link

AI Companies Are Desperate for Your Work-Related Data. What’s Your Price?

0
AI Companies Are Desperate for Your Work-Related Data. What's Your Price?


AI is running into a data dilemma, and it needs your help.

Technically, it doesn’t need your help. It just needs your emails, your internal messages with coworkers, and any documents you created.

Consider this the newest stage of the great education of AI.

AI companies have run the well dry training their models with internet text and people rating their chatbot responses. Now they want AI to get hands-on job experience, and they’re doing it with simulated workplaces.

(Alistair Barr, author of the great Tech Memo newsletter, has a fantastic breakdown on how these reinforcement learning environments work.)

These training grounds need real data and workflows that models can study.

AI companies can leverage their own workforces for that. Elon Musk recently told SpaceX workers their data will be used to train Grok. “It will inherit your thoughts and ideas,” is a totally normal thing Musk said at a recent all-hands meeting.

But some employees don’t take kindly to their mouse movements and keystrokes being used for AI training. (See: Meta.)

Which brings us to Google. The tech giant just paid $10 million for corporate data from bankrupt Spirit Airlines. And it wasn’t alone. AI training startup Mercor also bid $7.5 million for the info.

It’s an important reminder, lawyers told BI, that your work data isn’t as private as you might think.

If AI companies are in the market for work-related data, are you selling yours?

That’s the question Handshake AI is asking. The AI training firm is offering up to $30,000 for “high-quality written documents.”

The request raises plenty of compliance questions. (Handshake AI stipulated that you must own the documents and be authorized to share them.)

But setting aside the legality of it all, the pitch brings up an interesting debate about how much you value your work-related data in the AI era.

Last year, when Meta was paying people to smile on camera, I posed a similar question: What’s your price for training AI models on something you’re highly skilled at?

The results were split. Some were willing to accept as little as $25 an hour. Others outright refused to do it.

Handing over some data is a lot easier than spending hours training a model. But AI has made a lot of progress over the past year, potentially giving people pause.

You also need to factor in what others might do. Just because you choose to shun AI over fears it’ll eventually automate your job away doesn’t mean your colleague will make the same choice.

So, I’ll ask again, are you selling? And if so, what’s your price?

Take our survey.


Source link

Hyperliquid’s pre-IPO market push meets $10.15M HYPE transfer – What’s next?

0
Hyperliquid's pre-IPO market push meets $10.15M HYPE transfer - What’s next?


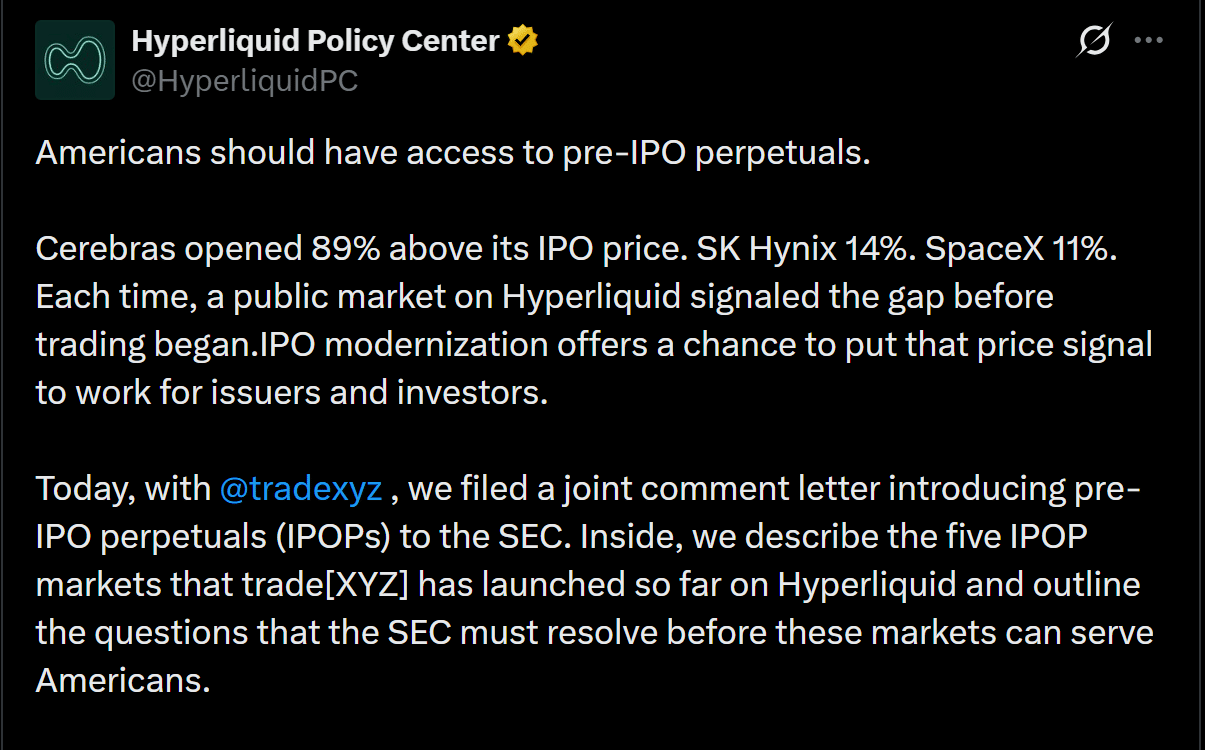
Hyperliquid [HYPE] is expanding its derivative model to include pre-IPO perpetuals, opening a new market for equity-linked speculation.

Early results from five completed markets show traders can highlight valuation gaps before public listings begin. Cerebras opened 89% above its IPO price, while SK Hynix and SpaceX opened 14% and 11% higher.

These gaps show why continuous pre-listing markets could matter, as public demand becomes visible before banks finalize offering prices.

Broader application by Hyperliquid may draw in additional equity-focused traders. As a result, this reduces its reliance on speculative activity related to cryptocurrency derivatives.

Source: X

Issuers may also receive additional pricing references, resulting in smaller first-day premium pricing at listing and allow issuers to retain more value during the listing process.

However, expansion only becomes meaningful if these markets develop deep liquidity and sustained participation.

Still, stronger volume and open interest across future IPOPs would confirm whether Hyperliquid can build a viable derivatives market outside crypto.

Hyperliquid activity expands beyond crypto

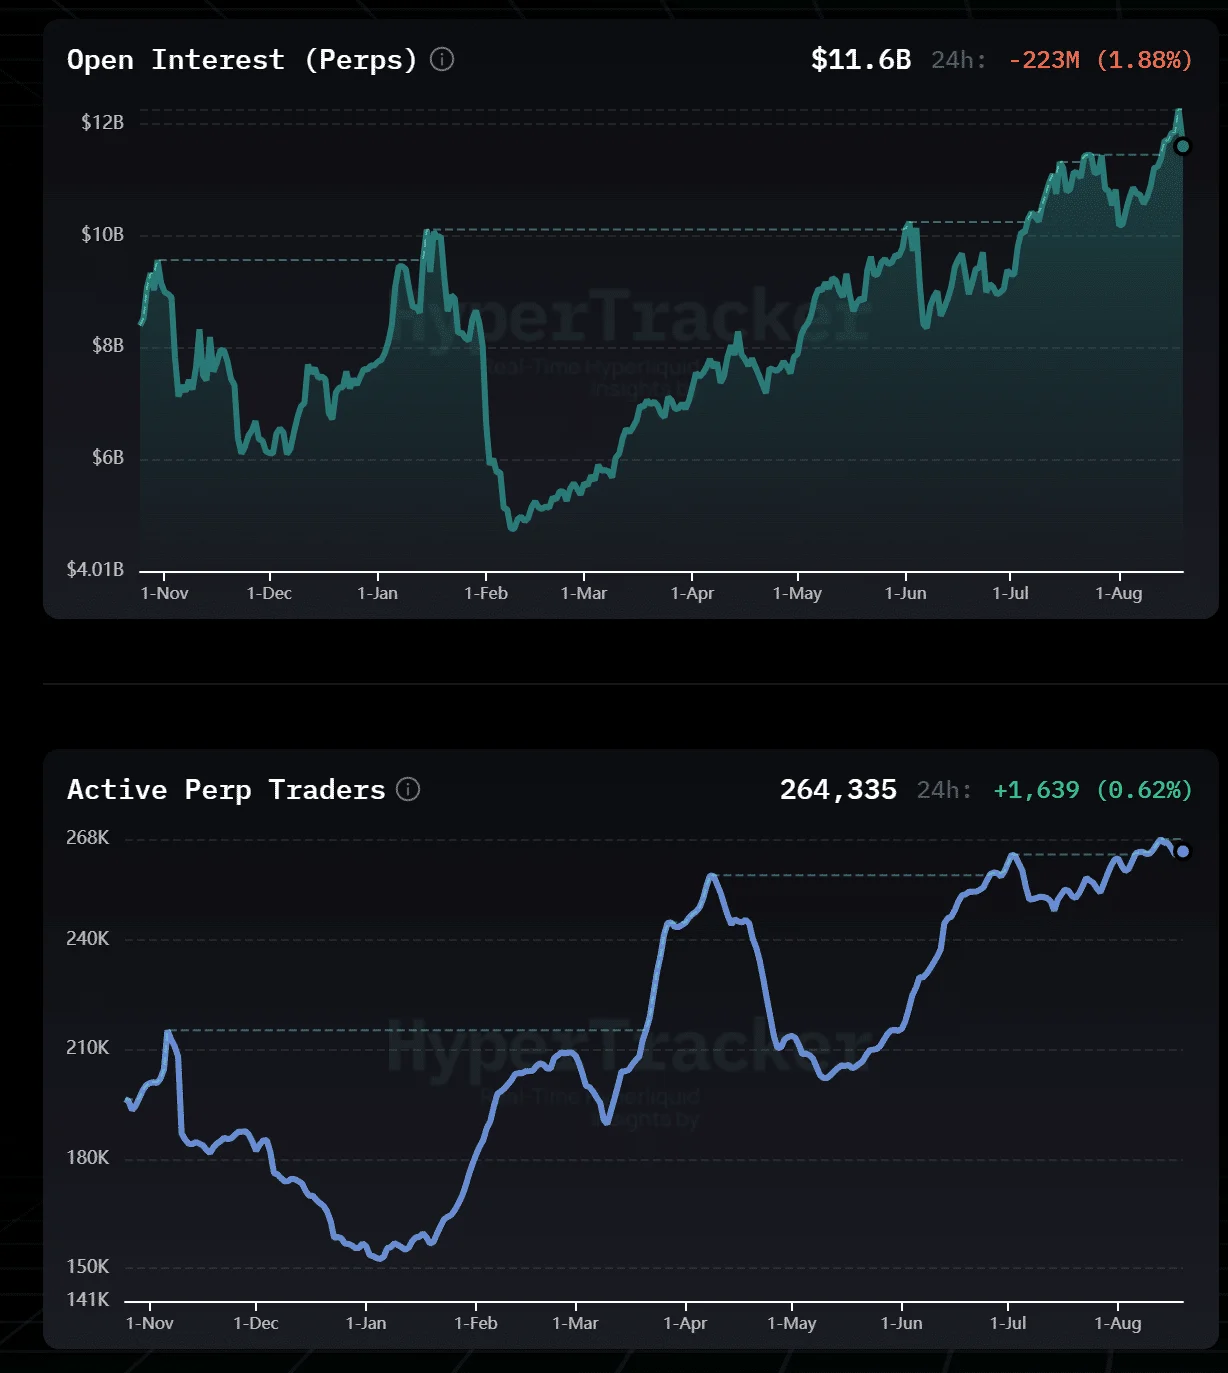
Interest in Hyperliquid’s wider market coverage is already showing through its broader derivatives activity. Open Interest (OI) at Hyperliquid has grown to over $11 billion, with over 264,000 active perpetual traders as of early August.

Source: Coinmarketman

These figures indicate that new markets have been attracting numerous participants.

However, the financial impact of these changes is relatively less clear-cut than the activity itself. Despite increased trading activity, the total amount of capital flowing into Hyperliquid’s treasury from transaction fees continues to decline.

HIP-3 markets help explain this divergence, as deployers retain part of the fees generated through their markets. Thus, an increase in traded volume or other market metrics will likely not lead to an equal increase in Hyperliquid’s treasury income.

Sustained increases in both activity and retained fees would show whether expansion is strengthening Hyperliquid’s economic base.

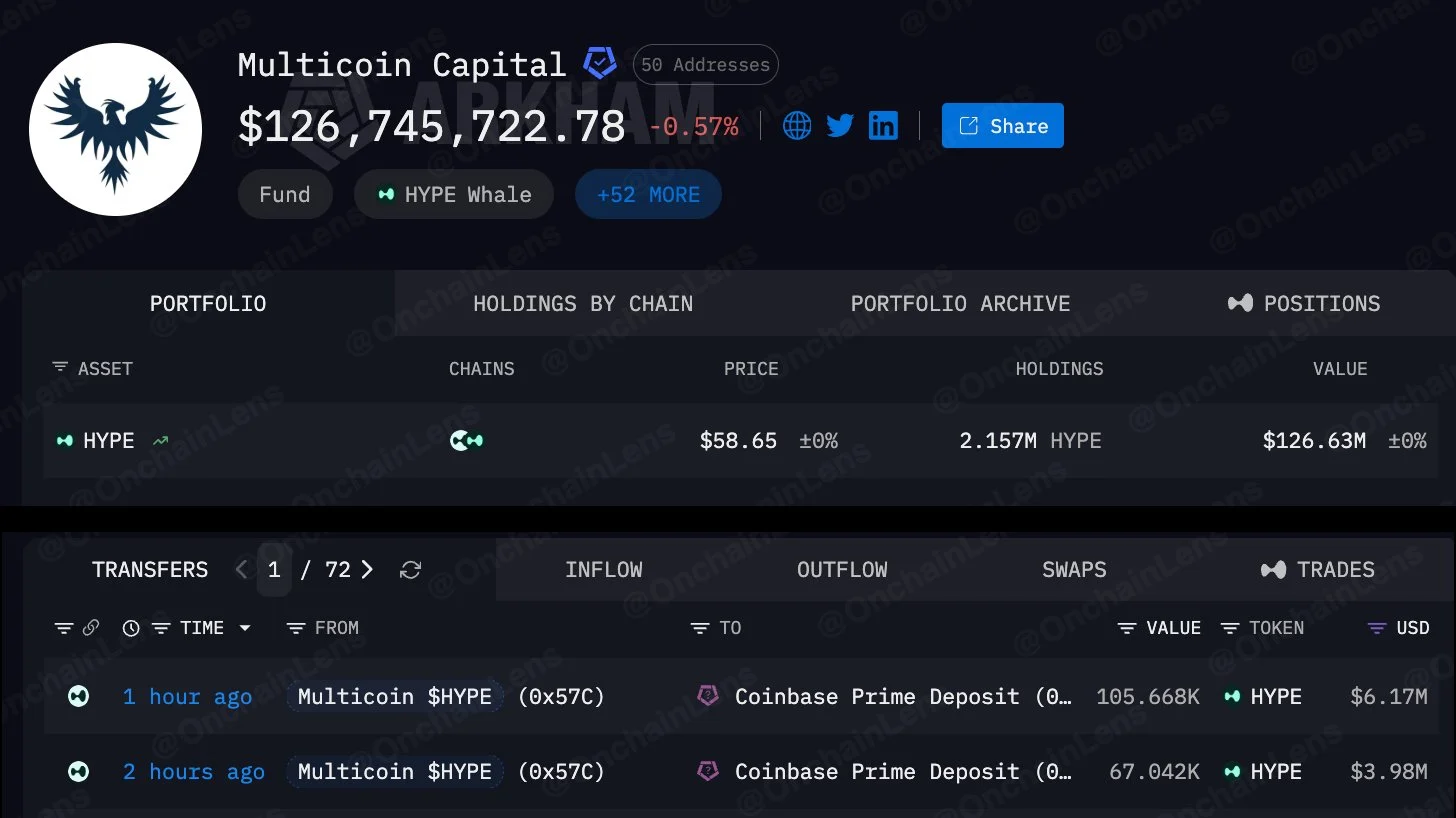
In addition to increasing its exposure to broader markets, Hype faces another form of supply pressure. In two trades, Multicoin Capital sent 172,710 HYPE worth approximately $10.15 million to Coinbase Prime.

Although these transfers put the HYPE at a higher proximity to market liquidity, they do not confirm sales.

Source: OnChain Lens

Still, Multicoin retains 2.16 million HYPE worth $126.63 million, making the remaining position far more significant than this transfer alone.

Therefore, this single transfer is significantly less than the remaining position. A series of future transfers may be interpreted by traders as continued distributions, which may negatively affect Hype’s price.

However, limited follow-through would reduce that concern, making Coinbase Prime movements and spot volume important for confirming whether actual selling develops.


Final Summary

  • Hyperliquid [HYPE] expansion is attracting activity, though fee growth remains key.
  • Multicoin’s $10.15 million HYPE transfer adds potential selling pressure despite its larger remaining position.


Source link

Seller concession limits: How much can you ask for?

0
Seller concession limits: How much can you ask for?


Seller concessions are at near-record highs in today’s buyer’s market, so there’s a good chance you can negotiate some credits or other help from your lender if you’re buying a home. 

Just be aware that all major loan programs limit concessions to a small share of the purchase price. It’s important to know the limits because if you ask for a higher amount, your lender will reduce your concessions at closing, and you’ll get less than you expected. 

Becoming familiar with the seller concession limits for your loan program before talking with the seller puts you in a stronger negotiating position.

If you’re buying a primary home or a second home with a conventional loan, the cap on concessions depends on the size of your down payment. You’re allowed to receive concessions up to 3% if your down payment is under 10%, up to 6% if your down payment is between 10% and 24.99%, and up to 9% if your down payment is 25% or greater.

For example, if you buy a home for $450,000 and make a 5% down payment, your maximum concessions are $13,500. If you put 20% down, you can get up to $27,000 in concessions.

Concessions are calculated as a percentage of the purchase price or the appraised value, whichever is lower. You can use concessions to cover closing costs, prepaid expenses, and up to 12 months of homeowners association fees. You can’t use concessions for your down payment or to expand your cash reserves, and you can’t apply them toward your minimum borrower contribution.

Unlike conventional loans, FHA loans don’t limit concessions by down payment size. The maximum seller concessions are 6% of the purchase price or the appraised value, whichever is lower. That’s true even if you’re making the minimum possible down payment of 3.5%.

“If you are really needing that additional assistance because you don’t have a ton of money saved, it may be in your best interest to go in on an FHA loan,” says Ashley Harris, director of homebuyer education at Neighbors Bank.

You can use seller concessions on an FHA loan to cover closing costs, prepaid expenses, and discount points. You can also use concessions to pay the upfront Mortgage Insurance Premium (MIP). If you’re using concessions to pay the upfront MIP, you must pay the full amount in cash at closing; you can’t split the premium between upfront and financed payments.

Seller concessions can’t pay any part of your down payment, and they can’t be used for moving expenses, paying off debts, or repairs that aren’t mandated by the FHA.

VA loans don’t place any limit on seller-paid closing costs, but limit other seller concessions to 4% of the property’s appraised value. 

Standard closing costs that the seller can pay without limits include the VA appraisal fee, discount points and rate buydowns, the loan origination fee, taxes, title insurance, and recording fees. Paying off debts or paying the VA funding fee are considered concessions and are subject to the 4% cap.

Seller concessions on a USDA loan can’t go over 6% of the purchase price and must be used for eligible closing costs, not extra incentives like paying off debts. The 6% limit doesn’t apply to money the seller deposits in an escrow account to pay for repairs.

Seller concessions typically can’t go over the allowable closing costs on your loan, regardless of the loan program. That means if you negotiate generous concessions and then find out that closing costs will be lower than you expected, you may need to give up some of the concessions the seller agreed to.

“We see that happen often. You get an estimate from your lender typically on closing costs, but a lot of those items are outside of their control and are items that you can shop for. So they can put in a great estimate for homeowners insurance, but you might get it for a lot cheaper. And now all of a sudden, rather than needing 5% towards closing costs, you only need 4%, but you negotiated 5%. Well, that money is not money that you can just take home with you,” Harris says.

You may have a couple of other options, though. Suppose you’re buying a house for $400,000 and you negotiated $20,000 in concessions, only to find out your closing costs are just $16,000. You could use the remaining $4,000 to buy down your rate, bringing your closing costs up to $20,000, because rate buydowns are generally an eligible closing expense. Alternatively, you could negotiate with the seller to reduce the sale price to $396,000, saving $4,000 on the purchase.

To use seller concessions to your full advantage, take stock of your closing budget and see where you’d benefit the most from the seller’s contribution.

  • Talk to your lender to confirm the concession limit for your loan type. Find out which items are eligible to be covered by concessions, and review your closing costs estimate.

  • Consider whether you have enough cash saved up to bring to the closing table for homeowners insurance, fees, and more. If not, it likely makes sense to use a seller credit to reduce these upfront expenses.

  • Explore discount points and temporary rate buydown options to see what they cost and how they would affect your monthly payment. You may want to use some of your negotiated concessions to make your mortgage payment more affordable, either in the short or long term

  • If your loan program allows seller concessions to go toward repair allowances or paying off debts, think about whether these uses would add breathing room to your budget as you move into your new home. 

You can ask for 3% of the purchase price if you’re putting less than 10% down, 6% if you’re putting 10% through 24.99% down, and 9% if you’re putting 25% or more down. That’s assuming that the property will be your primary residence or second home, not an investment property.

Seller concessions generally can’t exceed the allowable closing costs on your loan. In addition, concessions must stay within limits set by each loan program.

Loan programs set seller concession limits as percentages of the purchase price, so the limits change if the purchase price changes. For example, if you buy a $400,000 home with a conventional loan and a 5% down payment, seller concessions are limited to 3% of the purchase price, or $12,000. If the purchase price changes to $300,000 and you’re still making a 5% down payment, then seller concessions can’t be higher than $9,000.

If you buy an investment property with a conventional loan, you can get seller concessions of up to 2% of the lesser of the purchase price or the appraised value. Portfolio lenders set their own rules and may allow concessions on investment properties of up to 6% in some cases.

If the home appraises below the purchase price, the maximum possible seller concessions will typically go down. Most loan programs tie seller concession limits to the lesser of appraised value and purchase price, or to appraised value. And in the case of USDA loans, where the limit is based on the purchase price, an appraisal gap will often lead to renegotiating the purchase price, thereby reducing the maximum seller concessions.


Source link

Italian chain closes 50 restaurants after Chapter 11 bankruptcy

0
Italian chain closes 50 restaurants after Chapter 11 bankruptcy


Ask people to picture their favorite food, and creamy pasta, hot pepperoni pizza, and indulgent gelato beat out sushi, tacos, and even McDonald’s.

Italian food consistently ranks as the world’s most popular cuisine, edging out Chinese and Japanese in global surveys. A 2019 YouGov poll of more than 25,000 people across 24 countries put Italian in first place among 34 national cuisines.

But popularity hasn’t been enough to shield Italian restaurants from rising labor and food costs. Over the past few years, some of the biggest names in the category have filed for Chapter 11 bankruptcy, from Bravo Brio to Pizza Hut, Bertucci’s, and Buca di Beppo.

Earlier this year, I reported that fast-casual chain Fazoli’s had joined that list. In January 2026, its parent company, California-based FAT Brands Inc., filed for voluntary Chapter 11 bankruptcy in the U.S. Bankruptcy Court for the Southern District of Texas.

Now, Fazoli’s is closing restaurants across the country, and the numbers are worse than most people realize. 

Fazoli’s closes 4 more restaurants across 3 states 

Fazoli’s recently closed its restaurant in Battle Creek, exiting the West Michigan market completely, reported WoodTV

The restaurant, located at 5445 Beckley Road near Riverside Drive, was the chain’s last location in West Michigan. A spokesperson for FAT Brands confirmed the closure to the outlet on July 28. 

Following this closure, Fazoli’s remained with only two more restaurants in the Great Lakes State, down from seven it had in November 2025, according to the company’s official restaurant locator

2 remaining Fazoli’s in Michigan

  • 1500 North West Avenue, Jackson

  • 5705 South Cedar Street, Lansing 

In July 2026, Fazoli’s also shuttered one of its locations in Lincoln, Nebraska, leaving only three restaurants in the Cornhusker State, reported 10 11 Now

The restaurant at 4603 Vine Street near N. 46th Street closed on July 20. A sign on the front door read: “We regret to announce that Fazoli’s in Lincoln is permanently closed. We want to thank our guests and our community for your business.” 

3 remaining Fazoli’s in Nebraska

  • 2434 S. 132nd Street, Omaha

  • 8002 Cass Street, Omaha

  • 2012 Pratt Avenue, Bellevue 

Earlier this year, Fazoli’s also closed two more Central Kentucky locations. According to a Lexington Herald Leader report from May, the restaurant at 3775 Harrodsburg Road in the Palomar shopping center and the one at 1016 N. Main Street in Nicholasville have closed their doors for good. 

Following these closures, Fazoli’s retains 26 restaurants in the Bluegrass State in Ashland, Bowling Green, Danville, Elizabethtown, Florence, Frankfort, Georgetown, Hazard, Henderson, Lexington, London, Louisville, Madisonville, Morehead, Murray, Owensboro, Paducah, Paintsville, Pikeville, Richmond, Somerset, and Winchester. 

Fazoli’s closes four more restaurants across three states, bringing its total shutdowns to 50 restaurants over nine months.jetcityimage / Getty Images

Fazoli’s closes 50 restaurants in 9 months, exits 1 state entirely 

Using a web archive, TheStreet tracked precisely how many Fazoli’s restaurants have closed over the last nine months. 

According to the company’s official location directory, there were 142 Fazoli’s restaurants across the United States on Aug. 17, 2026. A web archive screenshot from Nov. 5, 2025, shows 192 restaurants. 

The data suggest that over the last nine months, Fazoli’s has closed a total of 50 restaurants, exiting Alabama entirely. 

Indiana lost the most restaurants, at 11, with 18 remaining. States that now have only one Fazoli’s restaurant include California, Mississippi, North Carolina, Oklahoma, South Dakota, and Virginia. 

Fazoli’s locations by state

Store counts on Aug. 17, 2026, vs. Nov. 5, 2025

What sets Fazoli’s apart from other Italian restaurants? 

There are approximately 44,848 Italian restaurants across the United States, generating around $112.5 billion in revenue annually, according to data from IBIS World

Here’s what differentiates Fazoli’s from major players like Olive Garden and Domino’s Pizza: 

  • Service model: Fazoli’s is a quick-service restaurant built around drive-thru speed, delivering pasta, baked dishes, and sides in minutes, reported TheTakeout

  • Lower average ticket: A 2026 analysis of major Italian-inspired chain restaurants calculating the mean or average cost of six categories (appetizers, entrées, side dishes, desserts, drinks, and kids’ meals) concluded that Fazoli’s prices are the most affordable, according to TastingTable

  • Breadstick superiority perception: Fast-casual food analyses often highlight that Fazoli’s breadsticks, baked continuously in small batches and heavily brushed with garlic butter, routinely beat Olive Garden in consumer taste tests, as reported by Chowhound

Aside from breadsticks, Fazoli’s menu offerings include freshly prepared pasta entrees, sub sandwiches, salads, pizza, and desserts. The restaurant was founded in 1988, in Lexington, Kentucky, aiming to offer high-quality Italian food quickly and conveniently. 

Its core motto was “Fast. Fresh. Italian.” 

“At Fazoli’s, we promise more than just a meal; we offer an experience where every guest is an integral part of our family. Here, breaking breadsticks is not just a tradition; it’s an invitation to savor every delicious moment. Join us at Fazoli’s, where every visit is a memorable chapter in our shared story of Italian delight,” reads Fazoli’s Our Story page

From one restaurant in Kentucky, Fazoli’s grew into a nationally recognized brand. At its peak, it had 208 locations across 28 states, becoming one of the largest quick-service Italian chains in the U.S. 

Why has Fazoli’s been closing so many restaurants? 

On Jan. 26, FAT Brands, which owns a portfolio of 18 restaurant concepts with more than 2,200 locations worldwide, including Fatburger, Johnny Rockets, and Round Table Pizza, among others, filed for Chapter 11 bankruptcy. 

“Our dynamic portfolio of brands has demonstrated tremendous resilience in a challenging restaurant operating environment over the last few years. We are well positioned for long-term profitability and growth. The Chapter 11 process will provide us with the opportunity to strengthen our capital structure to support our concepts and ensure they remain at the forefront of their sectors,” stated FAT Brands CEO Andy Wiederhorn.

Related: McDonald’s says it alienated its most loyal customers 

FAT Brands has been overwhelmed by debt tied to securitized borrowings. Its total debt was estimated at around $1.5 billion to $1.58 billion due to leveraged acquisitions and financing strategies.

The company planned to use the filings to deleverage its balance sheet, maximize value for its stakeholders, and support continued growth of its brands. 

The restaurant operator had already closed 32 locations before filing for bankruptcy protection, reported TheStreet’s Kirk O’Neil. 

Under its Chapter 11 bankruptcy process, FAT Brands has been closing select restaurants across the Fatburger, Smokey Bones, and Fazoli’s brands. 

Fazoli’s officially gets new owners 

In June 2026, FAT Brands, or at least most of what it once held, secured new owners. FBG Bid Co., an entity composed of some of the previous bondholders of the bankrupt company, bought several of its restaurant chains in a $595 million credit bid. 

The transaction included 13 restaurant brands spanning more than 1,700 locations worldwide: Round Table Pizza, Fatburger, Marble Slab Creamery, Johnny Rockets, Fazoli’s, Great American Cookies, Buffalo’s Cafe & Express, Hurricane Grill & Wings, Pretzelmaker, Native Grill & Wings, and Ponderosa and Bonanza Steakhouses, according to the official press release

Why are Italian restaurants struggling? 

While there are challenges unique to Italian restaurant chains, there are also widespread obstacles facing the entire restaurant industry in the United States. Namely, more than nine in 10 operators cite food, labor, insurance, energy, and swipe fees as the biggest challenges, according to National Restaurant Association

Moreover, 42% of restaurant operators confirmed their restaurant was not profitable in 2025. It is important to note that consumer demand remains strong, but their spending power is limited, affecting overall foot traffic and average spending. 

Italian restaurants also face additional challenges, including:

  • Shift in consumer preferences: “Sales in Italian restaurants are declining as customers explore other global cuisines, creating a business surge for restaurants offering diverse culinary experiences,” according to an IBIS World July 2026 report

  • High volatility of ingredient prices: Italian cuisine relies heavily on wheat (pasta), cheese, and specialized oils, categories that have seen some of the most fluctuating raw ingredient prices, “ultimately affecting profitability and manufacturing costs,” Fortune Business Insights noted. 

Rising input costs and supply disruptions have significantly affected pizza kitchens, “from tariffs on imported cheese to pandemic-era shocks in food production.” In fact, in 2025, purchases of food and beverages accounted for about 23.4% of revenue at the average pizzeria, according to an MMCG Invest report

Related: McDonald’s Shell gas deal saves you money at the pump

This story was originally published by TheStreet on Aug 17, 2026, where it first appeared in the Restaurants section. Add TheStreet as a Preferred Source by clicking here.


Source link