
Kite [KITE] crypto’s price surged 12.34% at press time, as AI sector rotation reinforced its outlook, with the expanding trading activity suggesting growing participation behind the rally.
Notably, this latest price advance emerged alongside improving conditions across the wider altcoin market. Furthermore, the Altcoin Season Index registered a weekly gain of 25%, implying increased capital rotation beyond Bitcoin [BTC].
Crucially, market participation also expanded rapidly alongside the price advance, with the spot volume jumping 76.43% to $34.6 million.
Moreover, the rally carried a stronger activity instead of relying solely on thin market conditions. Besides, AI-sector interest also gave buyers an outlook capable of supporting continued focus toward KITE.
Table of Contents
Fresh leverage follows the rally
The market participants on the derivatives also increased their exposure as KITE advanced its price recovery.
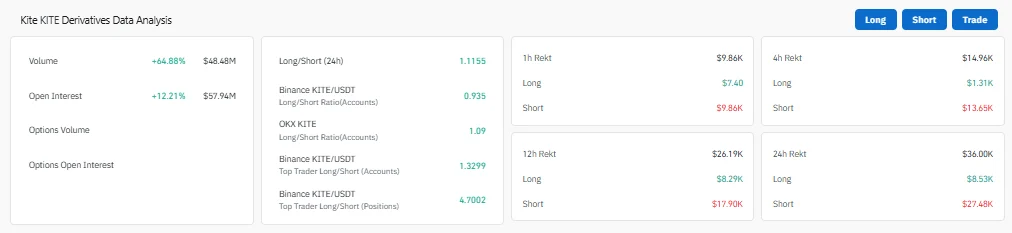
Notably, KITE’s Futures volume climbed 64.88% to $48.48 million, as its Open Interest (OI) increased 12.21% to $57.94 million as of writing. These simultaneous expansions suggested fresh leveraged positions entered as investors responded to KITE’s price increase.
Additionally, the positioning also leaned heavily towards further upside among the Binance’s top traders. Specifically, the top trader’s Long/Short ratio by positions hit 4.7002, reflecting a significant long exposure.
Meanwhile, short liquidations, on the other hand, reached $27.48K over 24 hours, compared with only $8.53K in long liquidations. Those liquidations, therefore, likely strengthened the expansion as rising prices flushed bearish positions from the market.
The expanding leverage, however, also exposed KITE’s sensitivity to sharp price reversals near resistance.
Can KITE clear the $0.16 barrier?
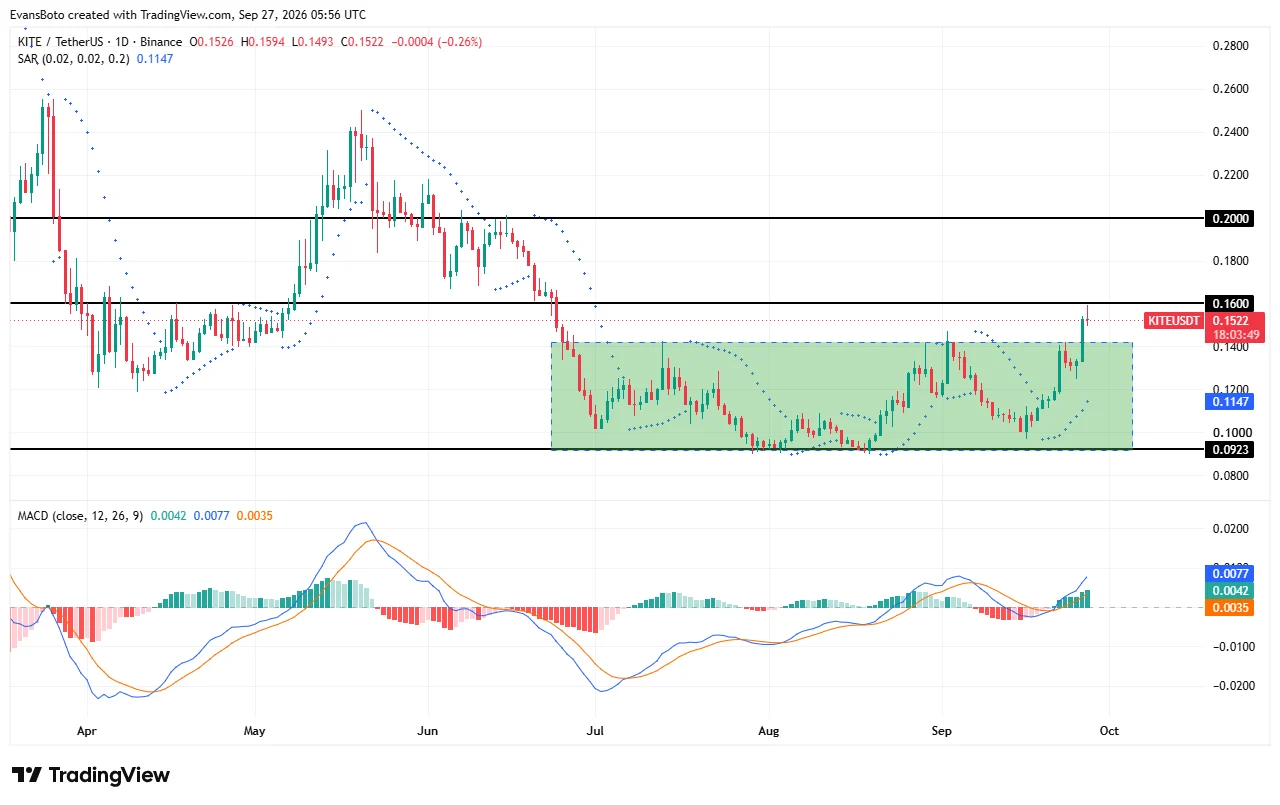
KITE’s recent rally pushed the price beyond the upper boundary of its multi-month consolidation around $0.14.
The bulls then pushed KITE towards the $0.16 price, where the next key resistance remained immediately overhead.
Importantly, the breakout gained technical support from the MACD indicator before the price hit the resistance. Notably, at the time of writing, its MACD line at 0.0076 stood comfortably above its signal line at 0.0035.
The RSI indicator, however, climbed to 71.12, placing KITE within the overbought conditions territory. Even so, such conditions did not necessarily invalidate the breakout, but rather increased the possibility of near-term profit-taking activity.
A strong upward price momentum above $0.16 could validate the breakout and open a path towards the higher resistance at $0.20. However, failure around the $0.16 region could instead send KITE back toward its recently cleared range boundary.
Downside liquidity complicates the breakout
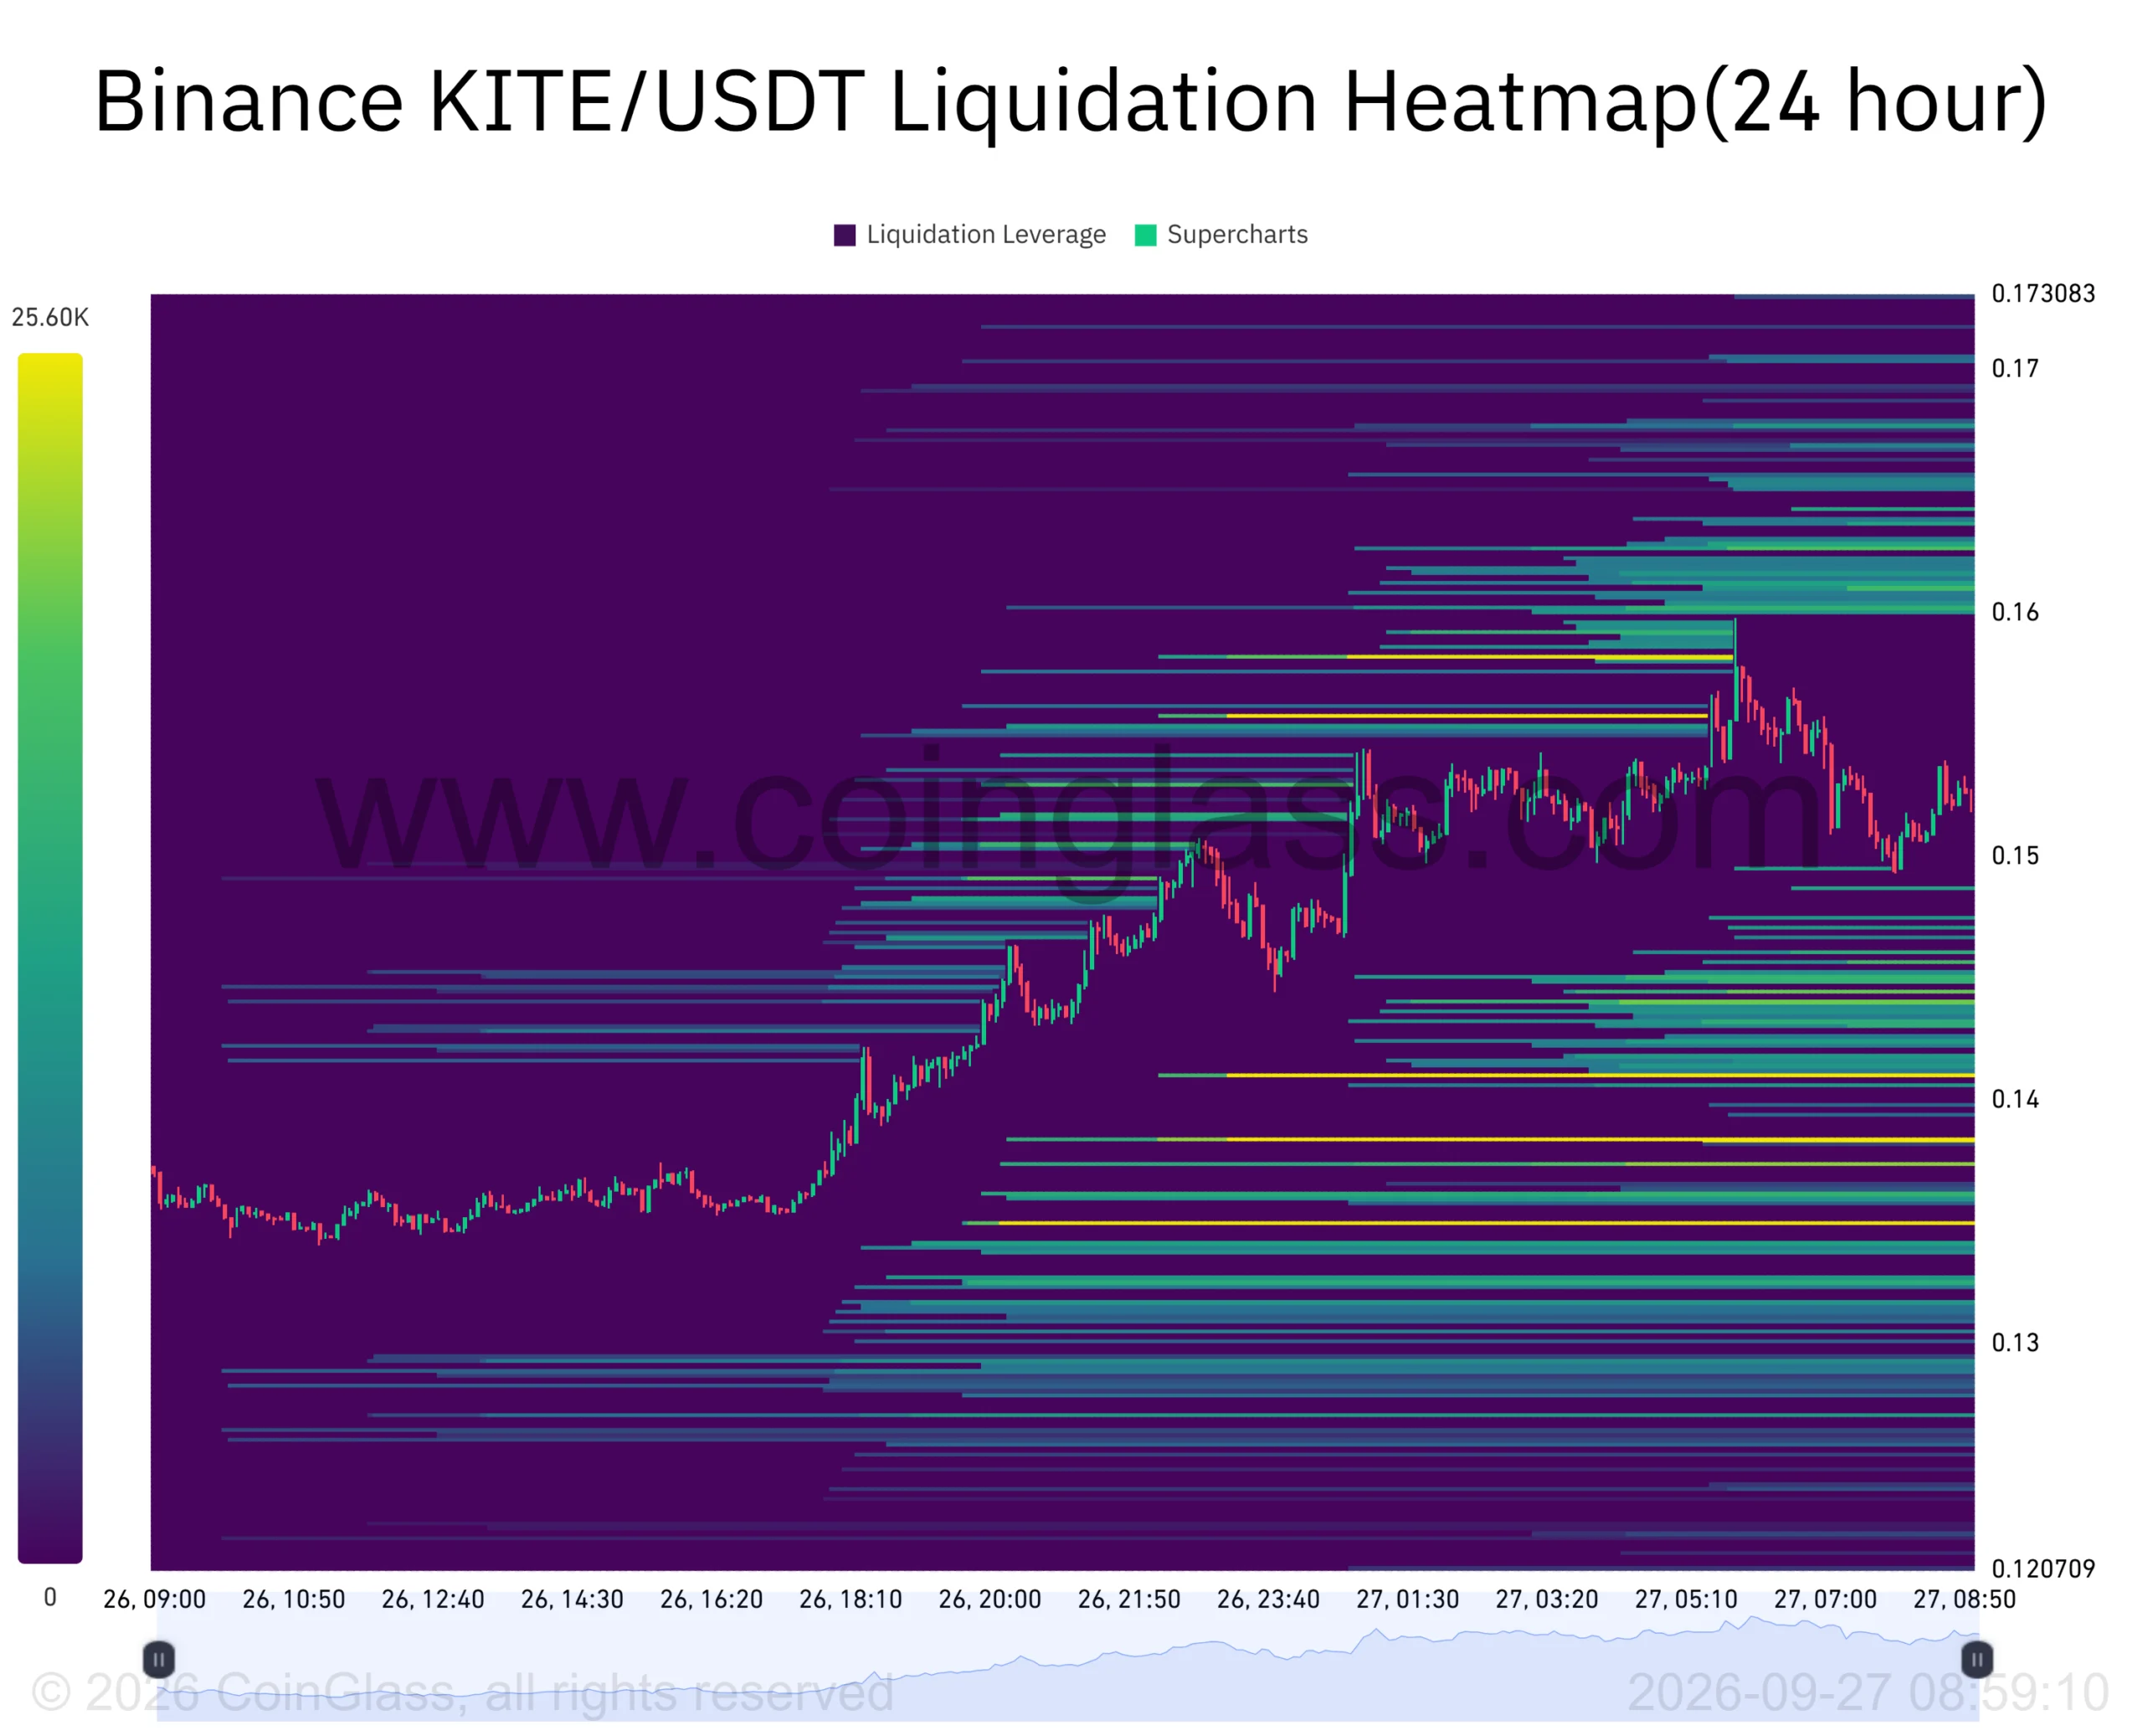
Despite KITE’s expanding technical structure, the Binance Liquidation Heatmap provided a significant downside risk. Notably, dense liquidation liquidity clusters had accumulated beneath the market following the rapid price rally.
Additionally, several notable clusters stretched below the $0.15 level, while stronger clusters appeared around the $0.14 zone. Further liquidity remained deeper around the $0.13 area, introducing numerous potential downside attraction pools.
KITE, meanwhile, had already expanded sharply from the $0.135 zone. The rapid price rally left the token trading considerably above several lower liquidity clusters.
The weakening demand around the $0.16 region could, therefore, encourage a liquidity sweep toward those lower concentrations.
Ultimately, the $0.14 zone would become particularly crucial as it also aligned closely with KITE’s breakout area.
Final Summary
- KITE’s 12% rally gained support from AI rotation and sharply expanding market participation.
- Dense liquidity below price could trigger a pullback if $0.16 rejects buyers.