The Coinbase Bitcoin Premium Index has been negative for 60 days in a row since the 19th of May, which has put a lot of pressure on Bitcoin right now.
As per CoinGlass’s most recent reading, the index has experienced the longest streak on record, reaching -0.1025%. This indicates that Bitcoin has been trading at a lower price on Coinbase than on Binance for the past two months.
Table of Contents
What does this mean for Bitcoin?
Such a long streak was last seen between the 16th of January and the 24th of February, which lasted approximately 40 days. That was followed by a notable 30-day period around the market crash on the 11th of October.
.
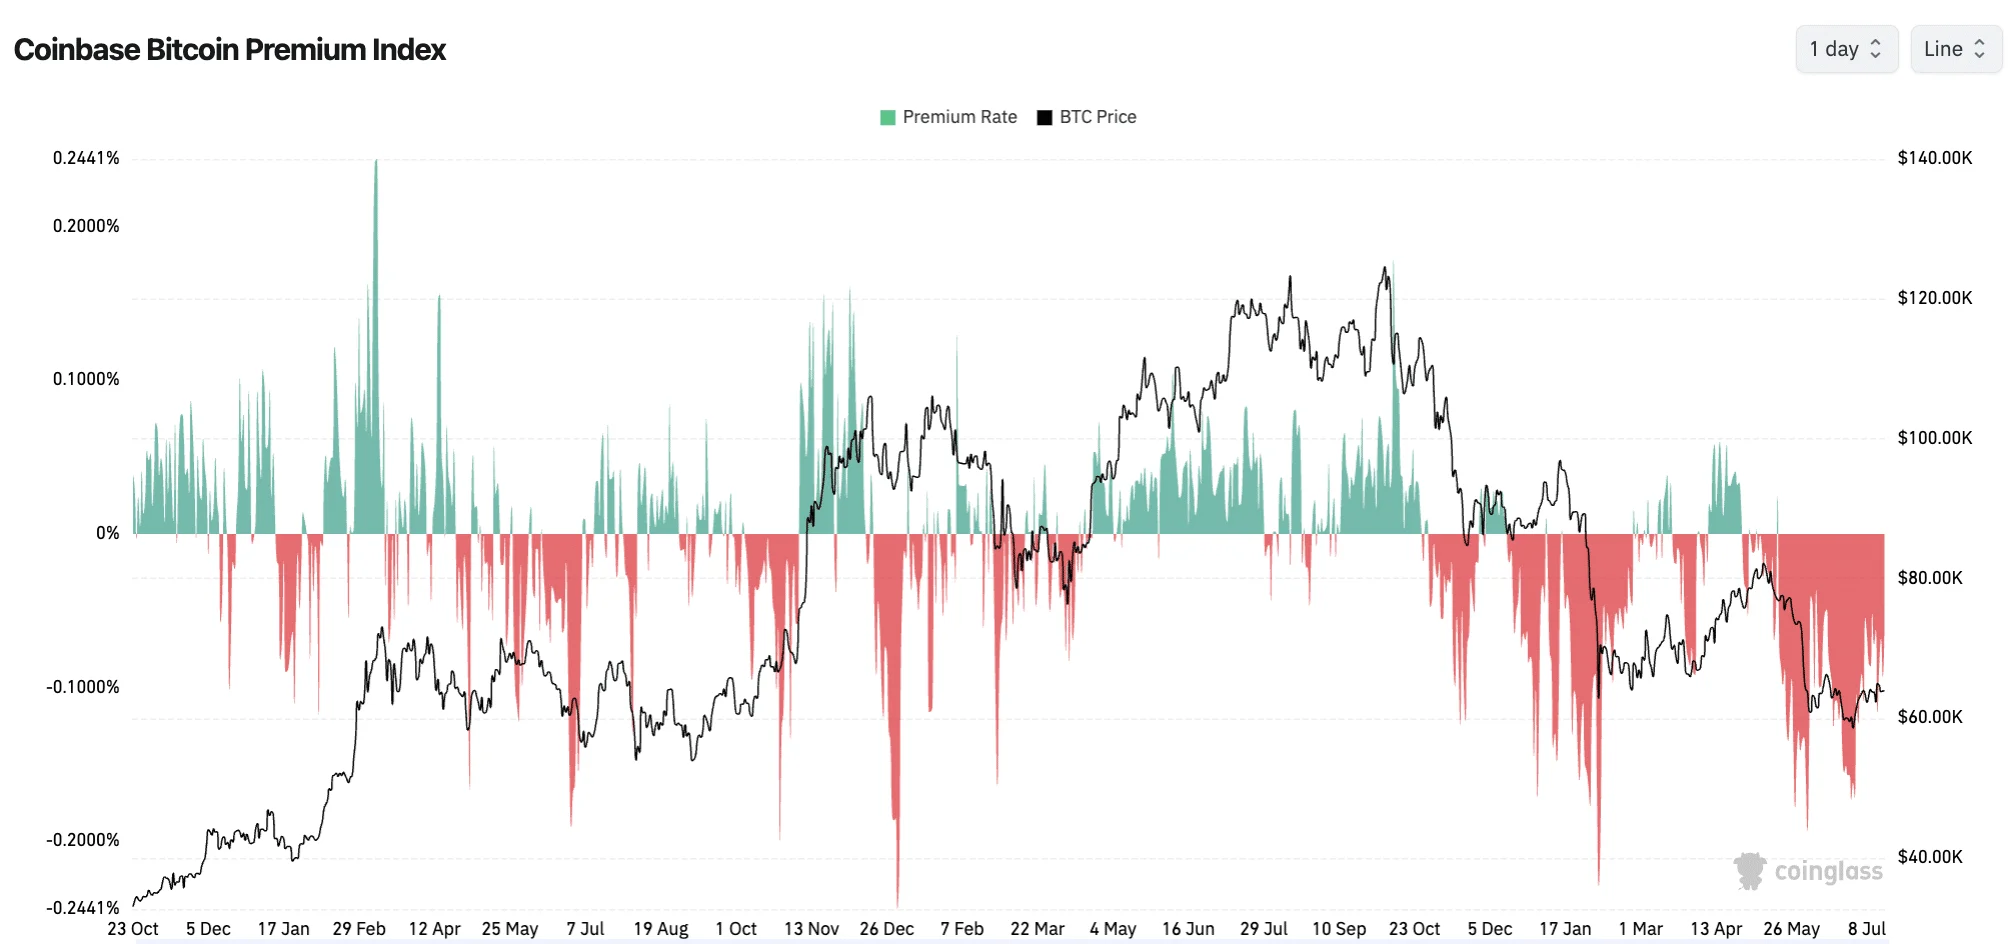
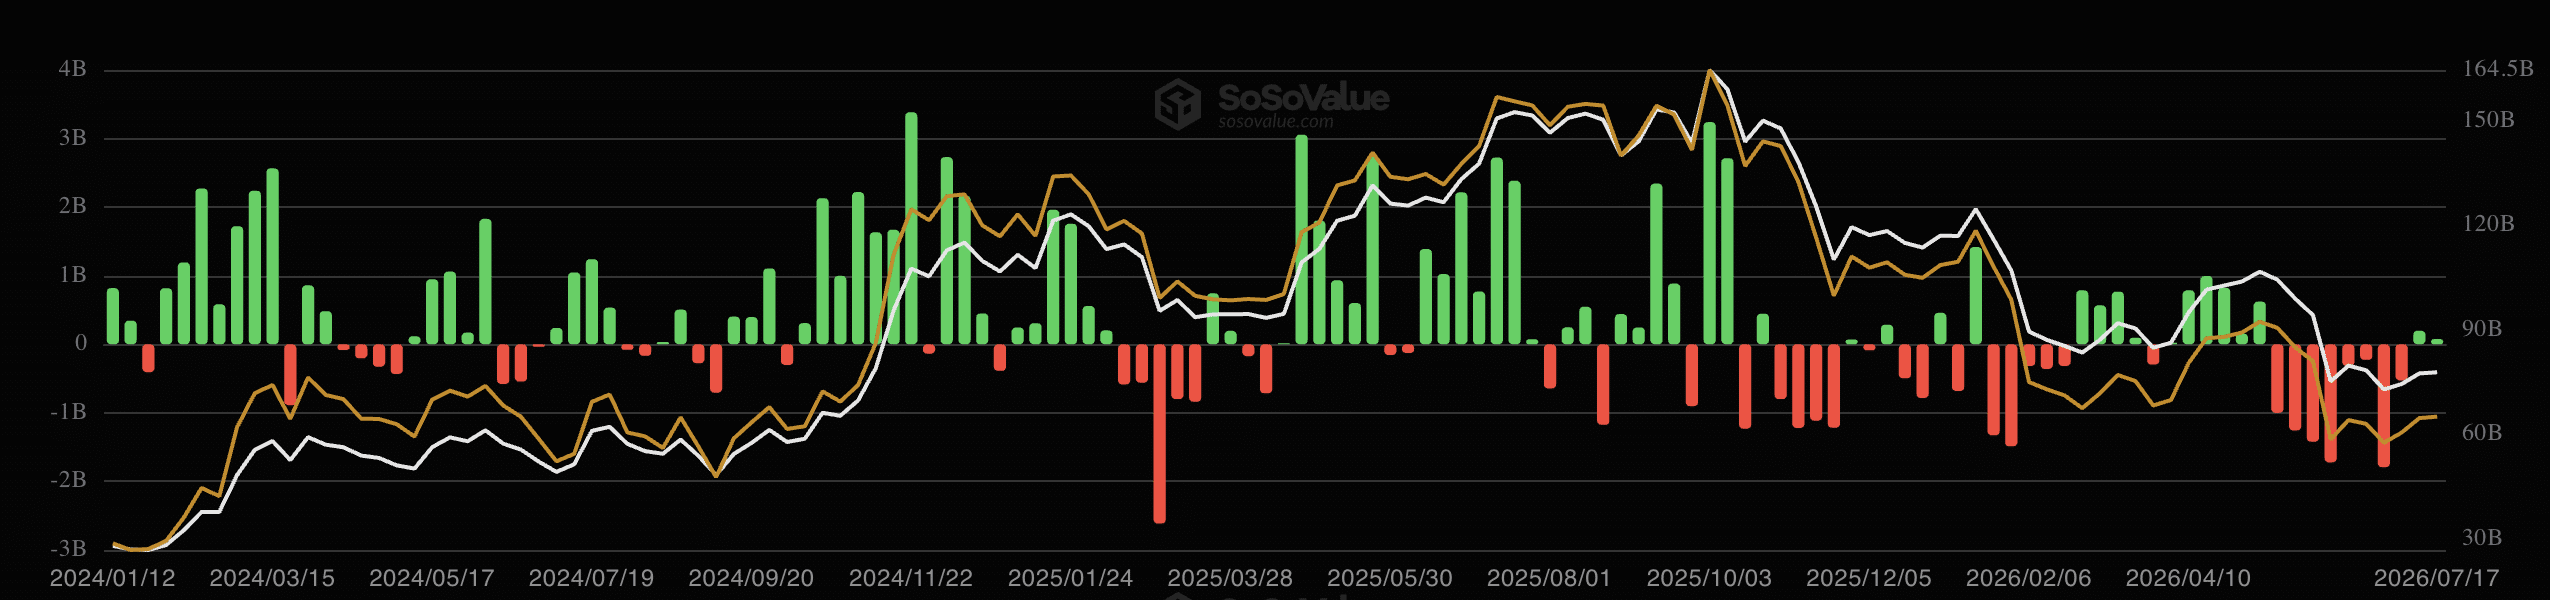
That said, such prolonged negative readings are concerning as they have historically corresponded with times when ETF outflows have occurred.
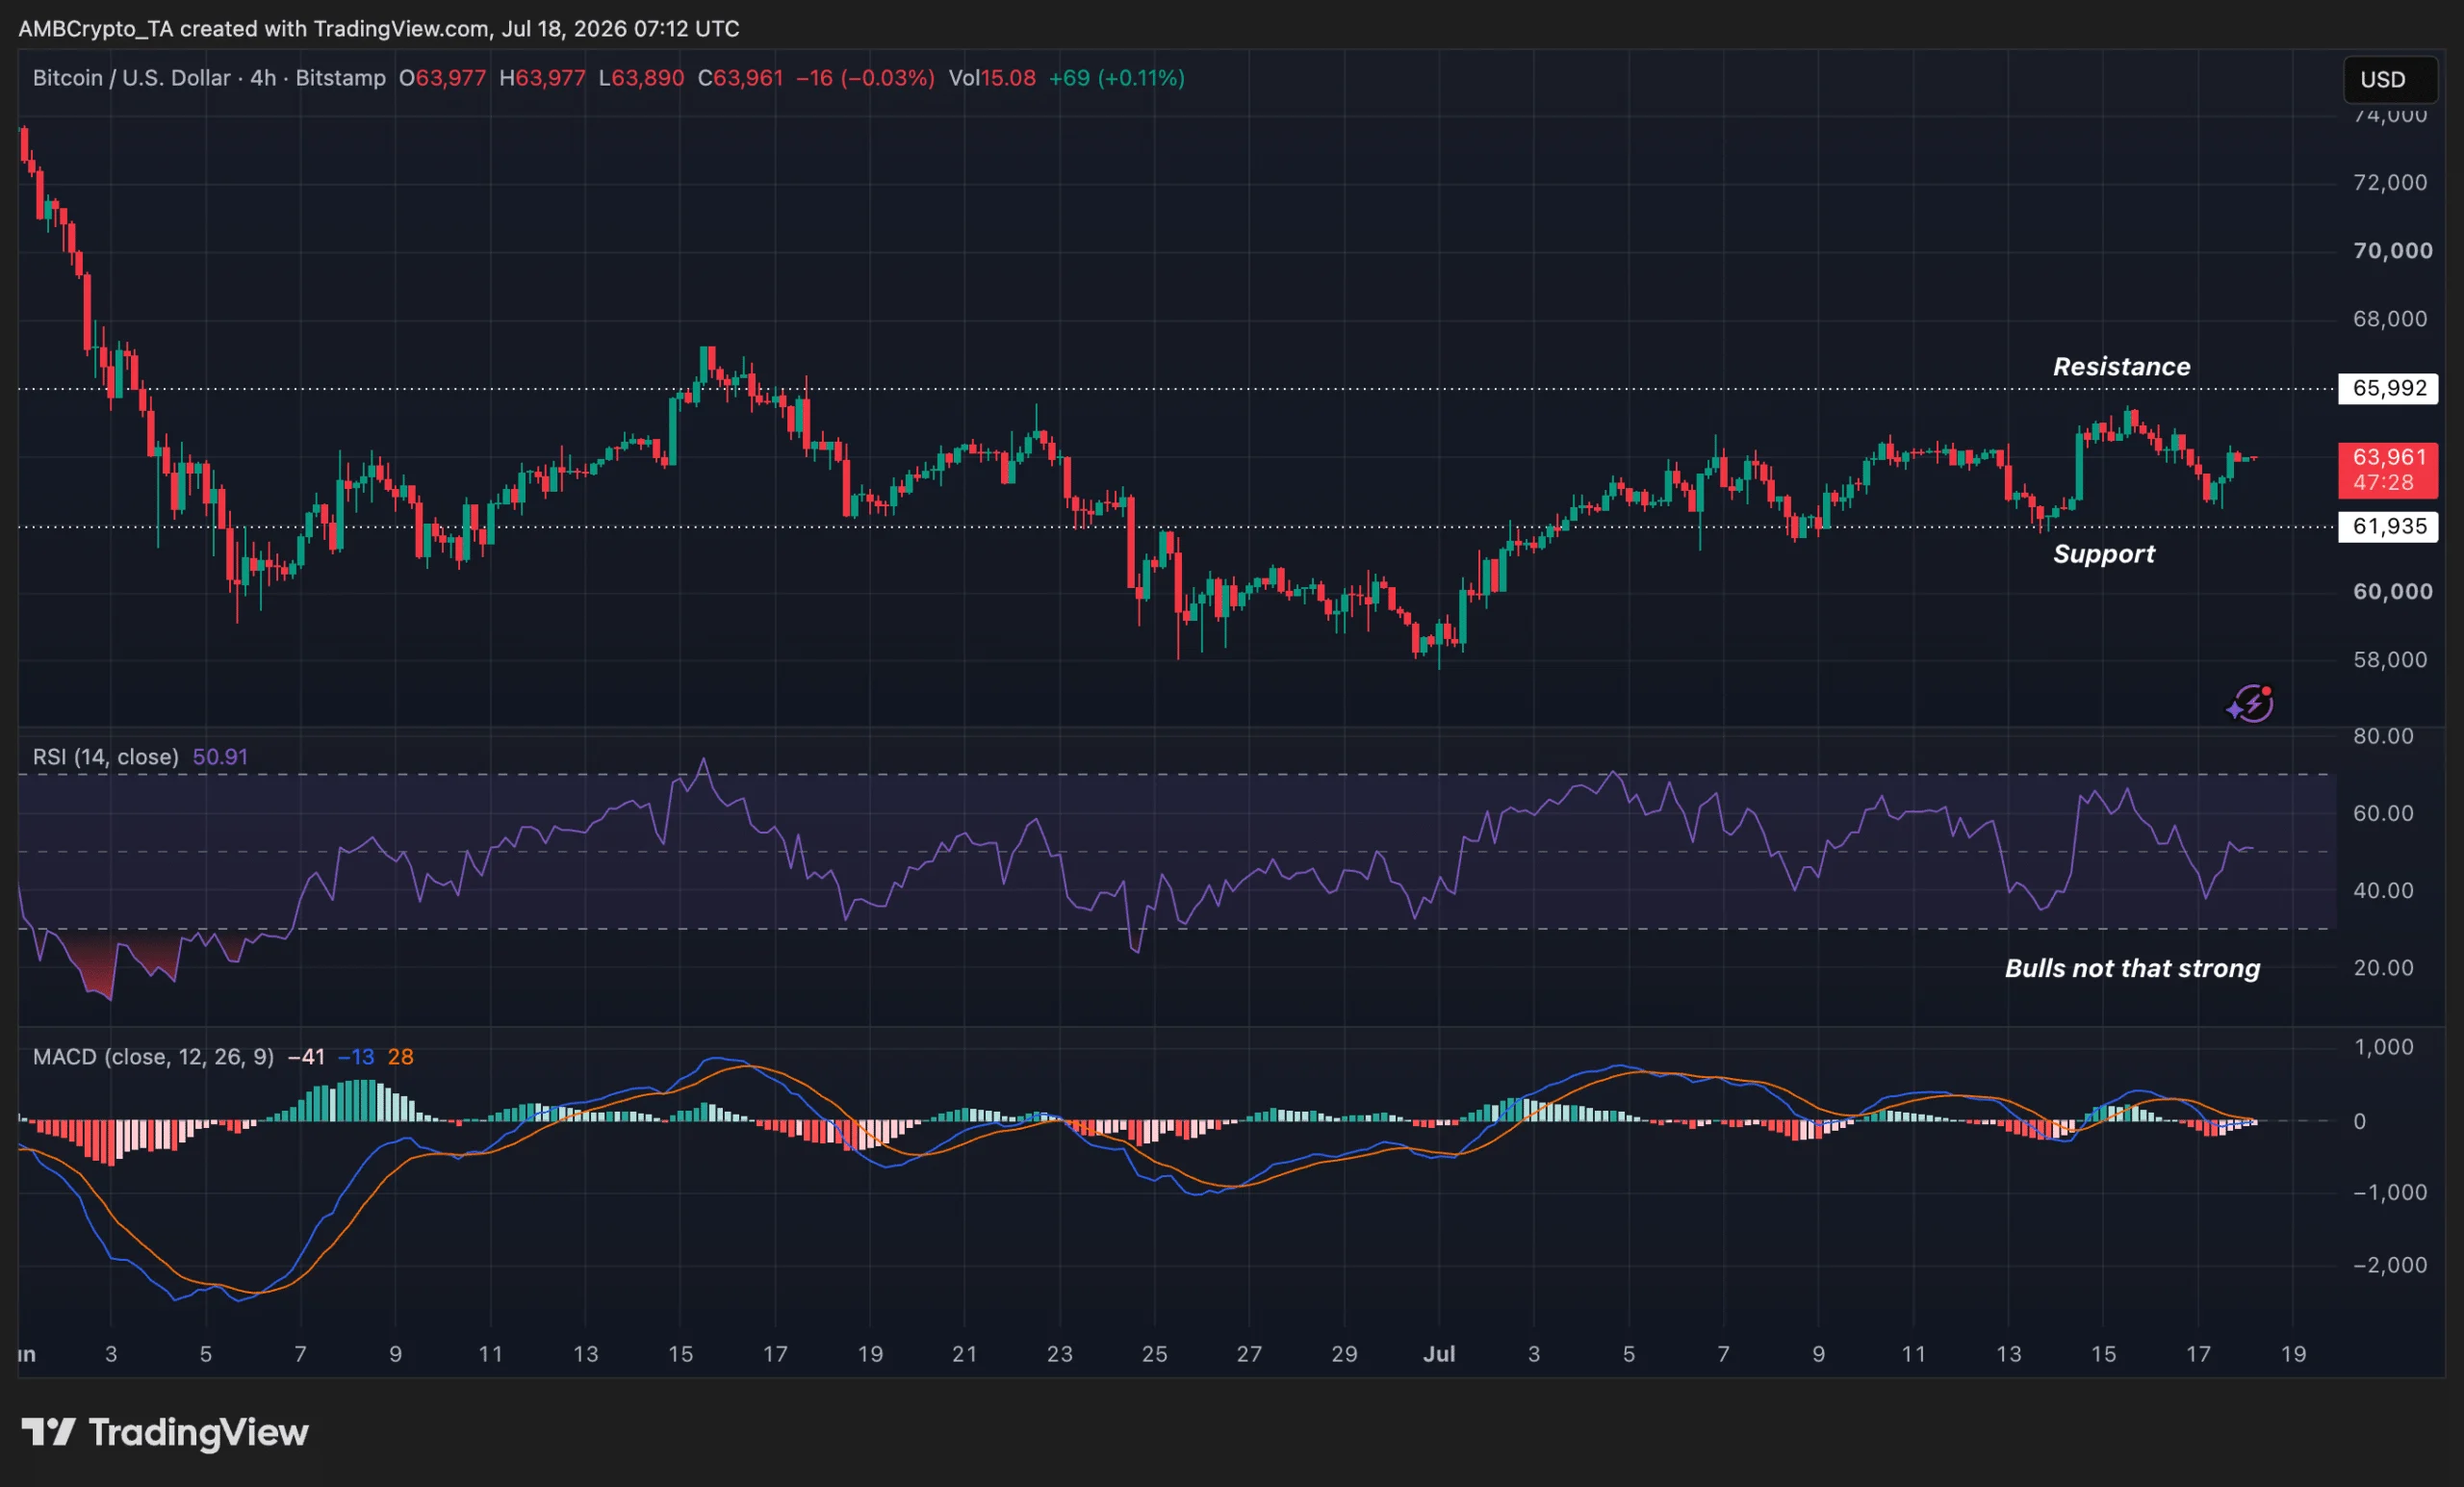
This comes as the price of Bitcoin increased by 1.8% over the previous day, trading at $63,935.02 at press time.
However, the drop from $76,954 last seen on 19th May raises concerns. The RSI and MACD indicators further suggested that despite the hike, the bulls were not strong enough.
In contrast, during the same time period, the Bitcoin ETF saw maximum outflows. However, with net inflows of $197 million from 6th to 10th July, the ETFs managed to end the eight-week outflow trend.
Bitcoin’s risk index provides an interesting nuance
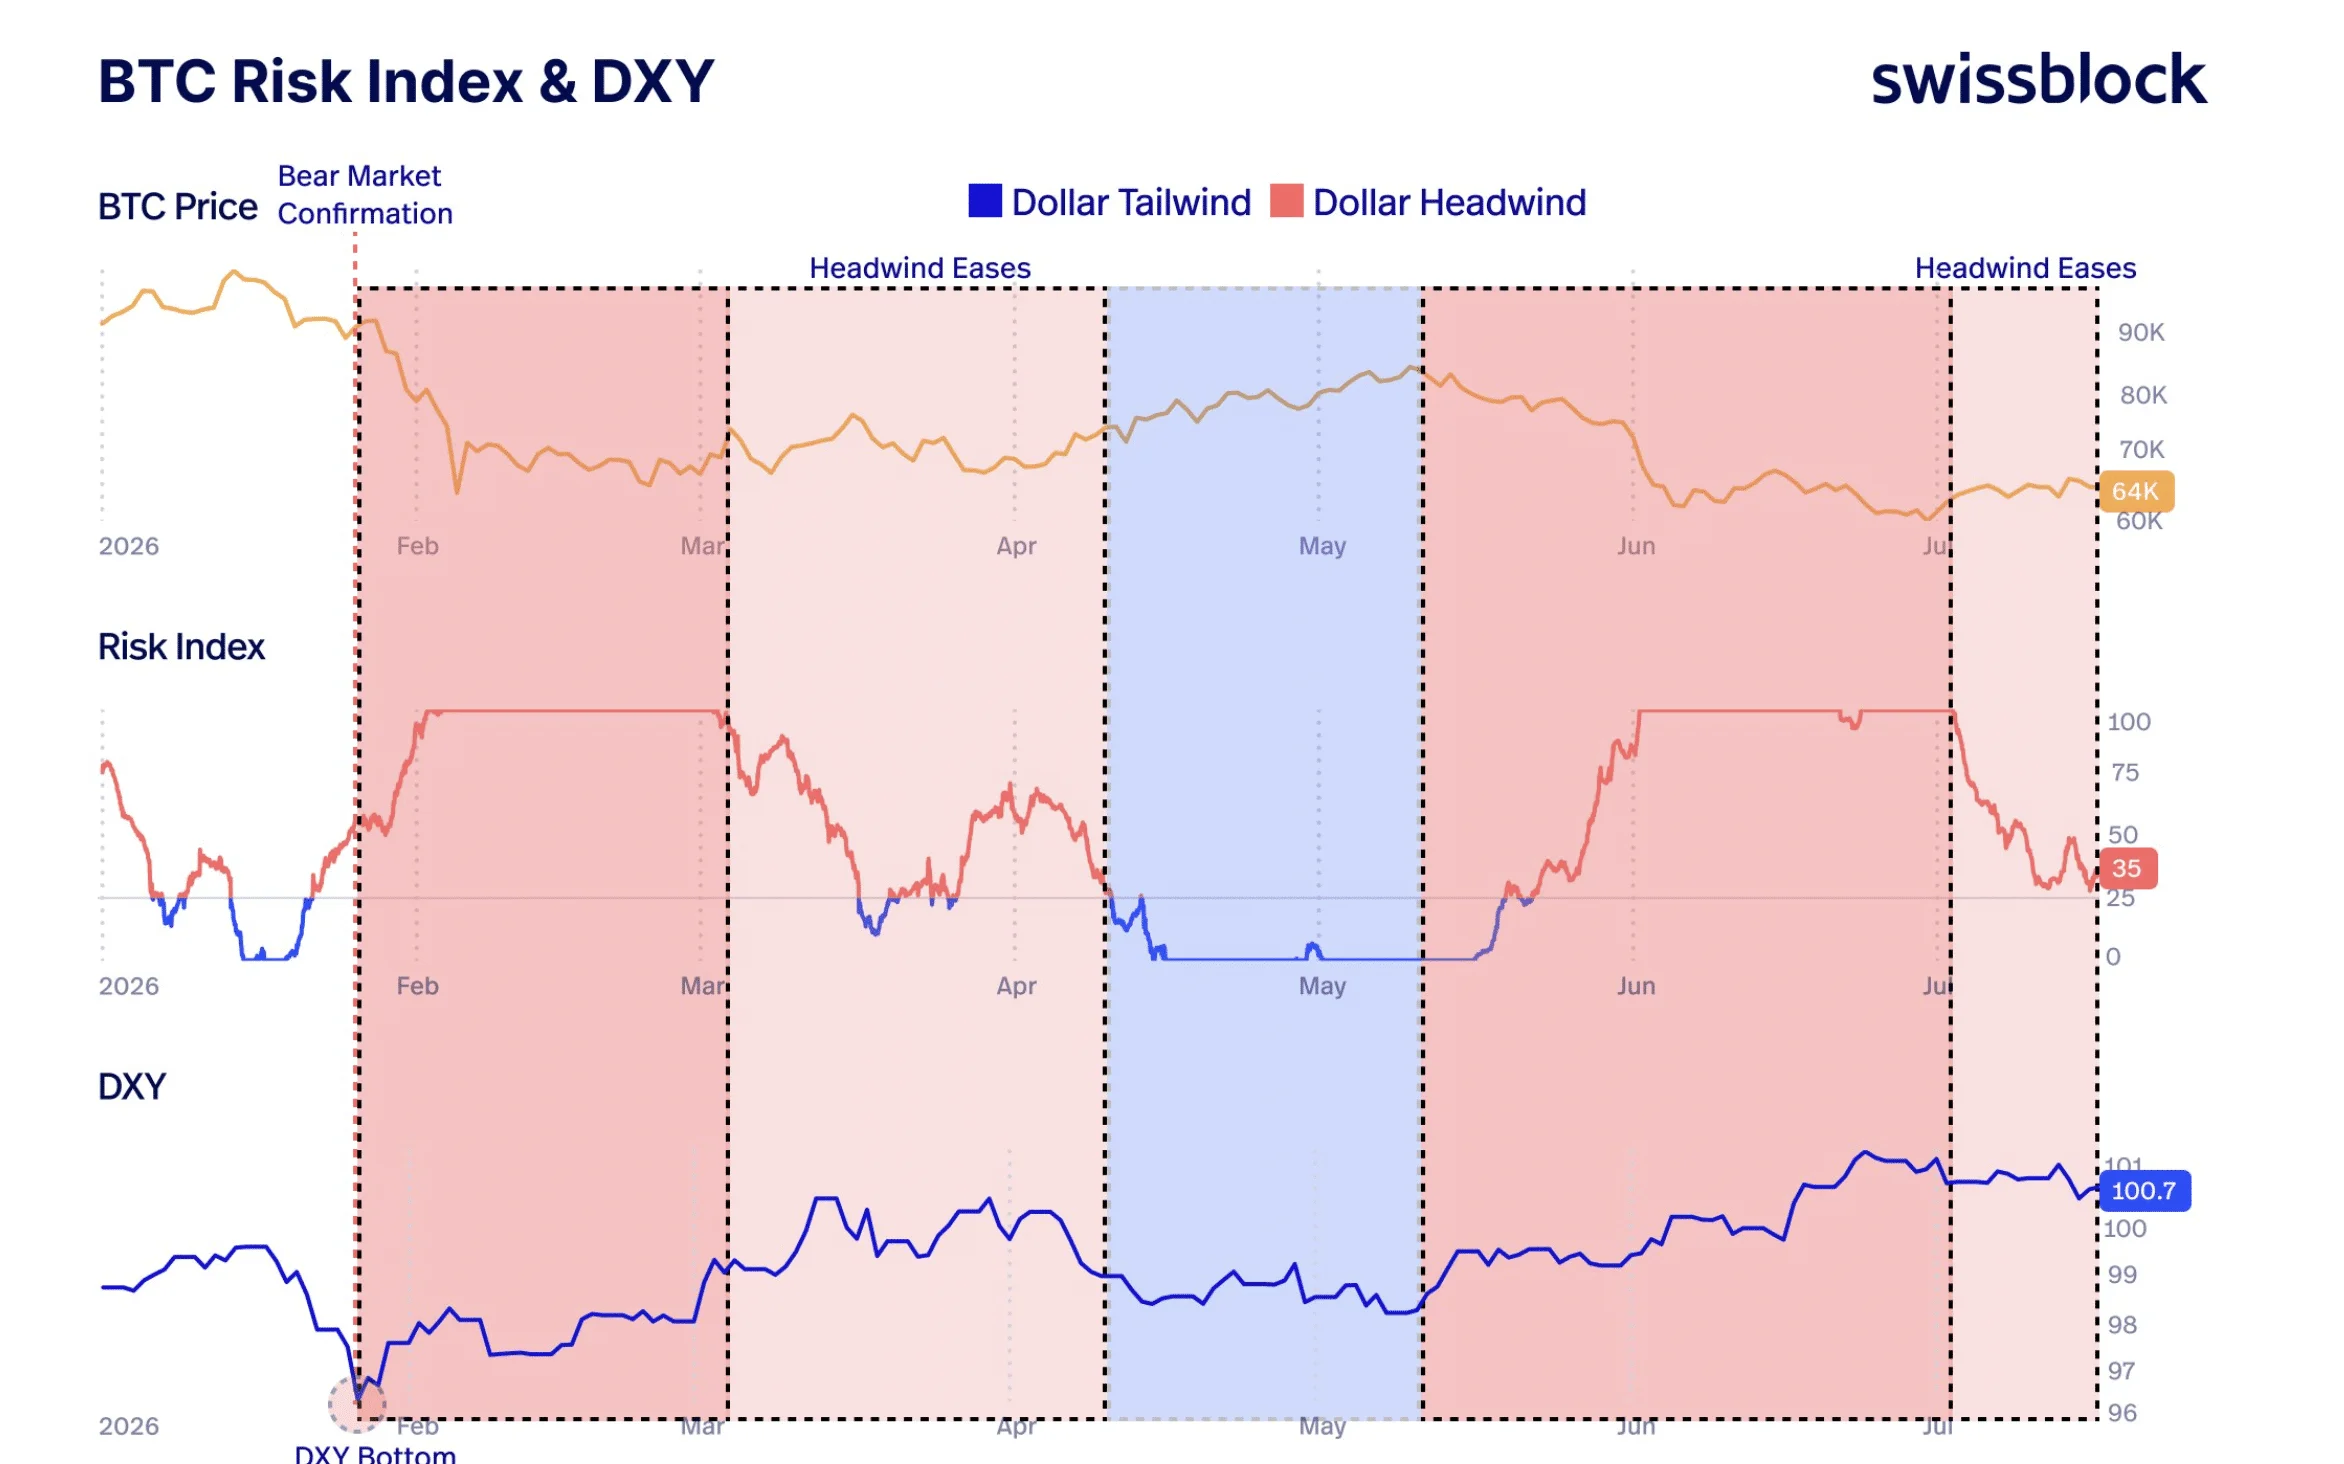
Meanwhile, this year, the U.S. Dollar Index (DXY) and the Bitcoin Risk Index have been very similar. With less appetite for risky assets and tighter liquidity, Bitcoin entered a risk-off phase as the dollar gained strength.
The only significant rebound of the year occurred when the DXY declined, resulting in a more advantageous environment. Naturally, one of the main macro headwinds for Bitcoin may be abating now that the dollar is losing ground and the Bitcoin Risk Index is cooling.
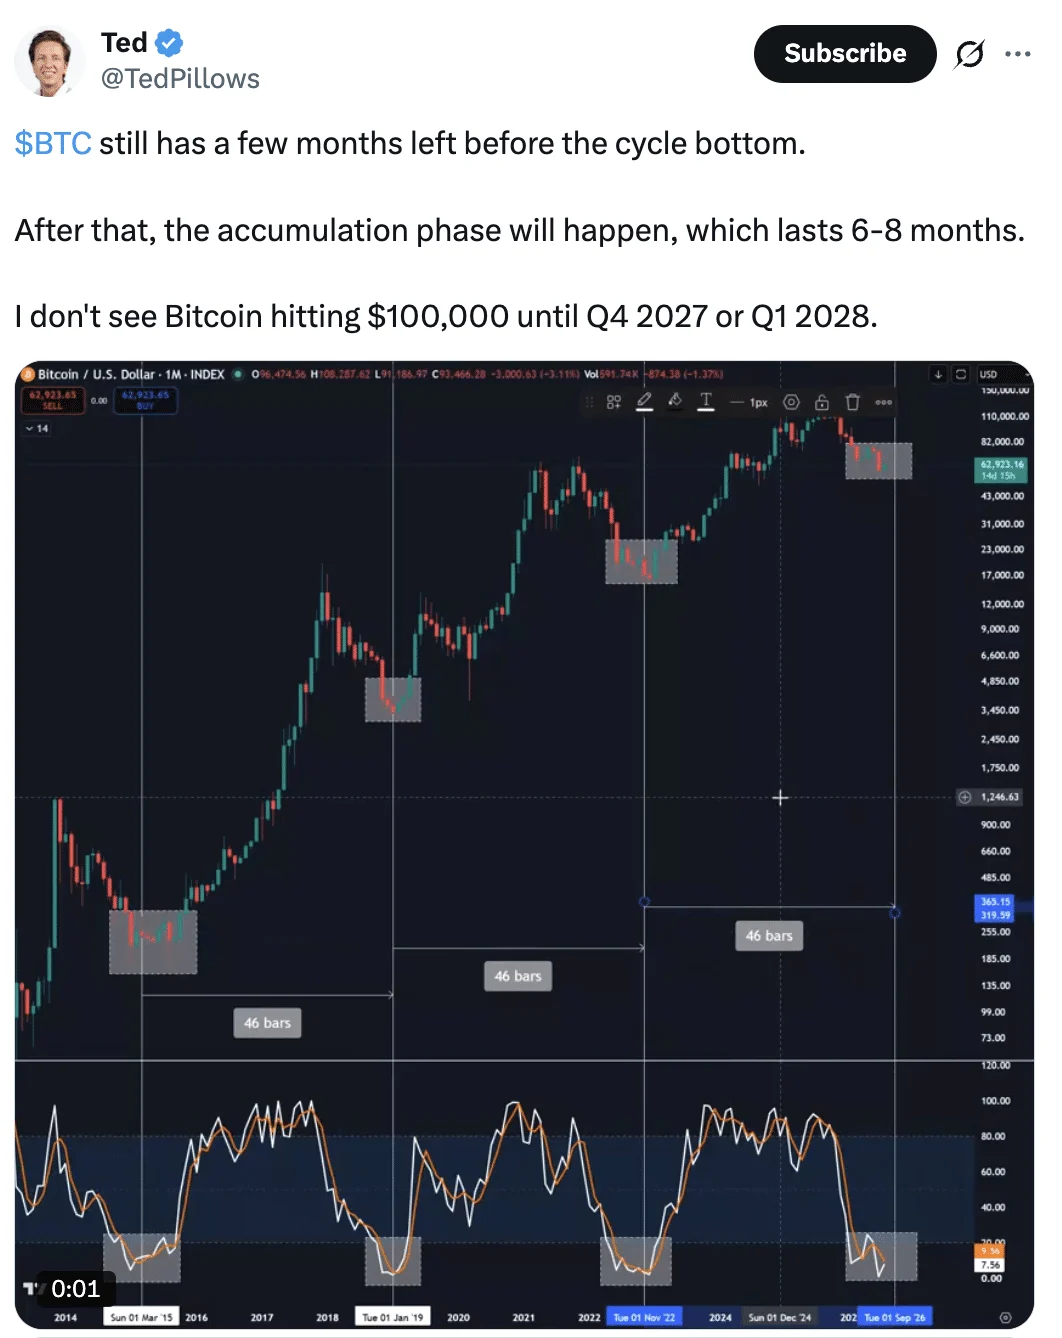
However, analysts predict that the cycle bottom will form over the next few months rather than right away.
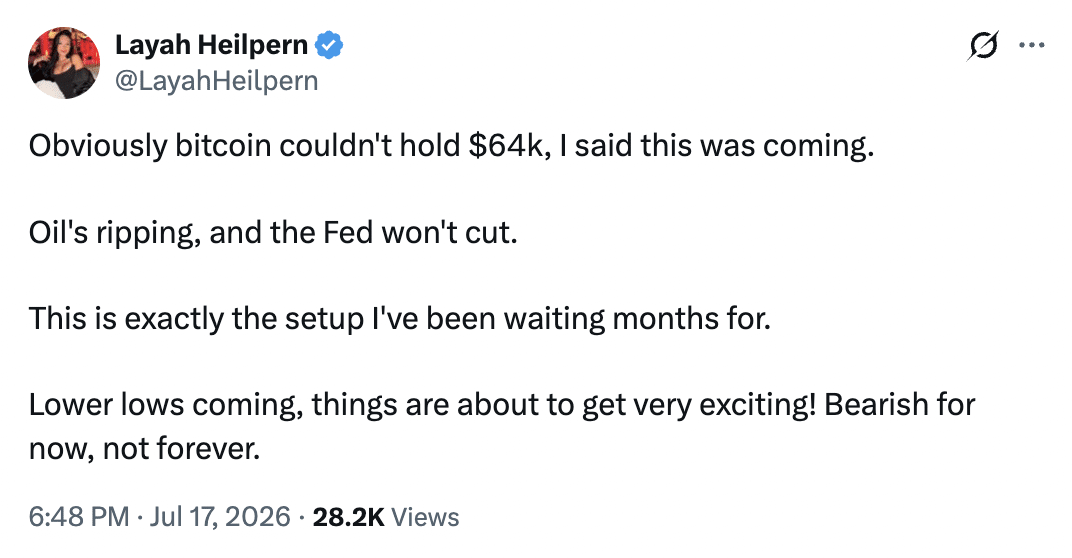
Similar to this, another analyst says that Bitcoin’s failure to hold the $64,000 support level validates their prediction of additional declines.
Is $100k possible?
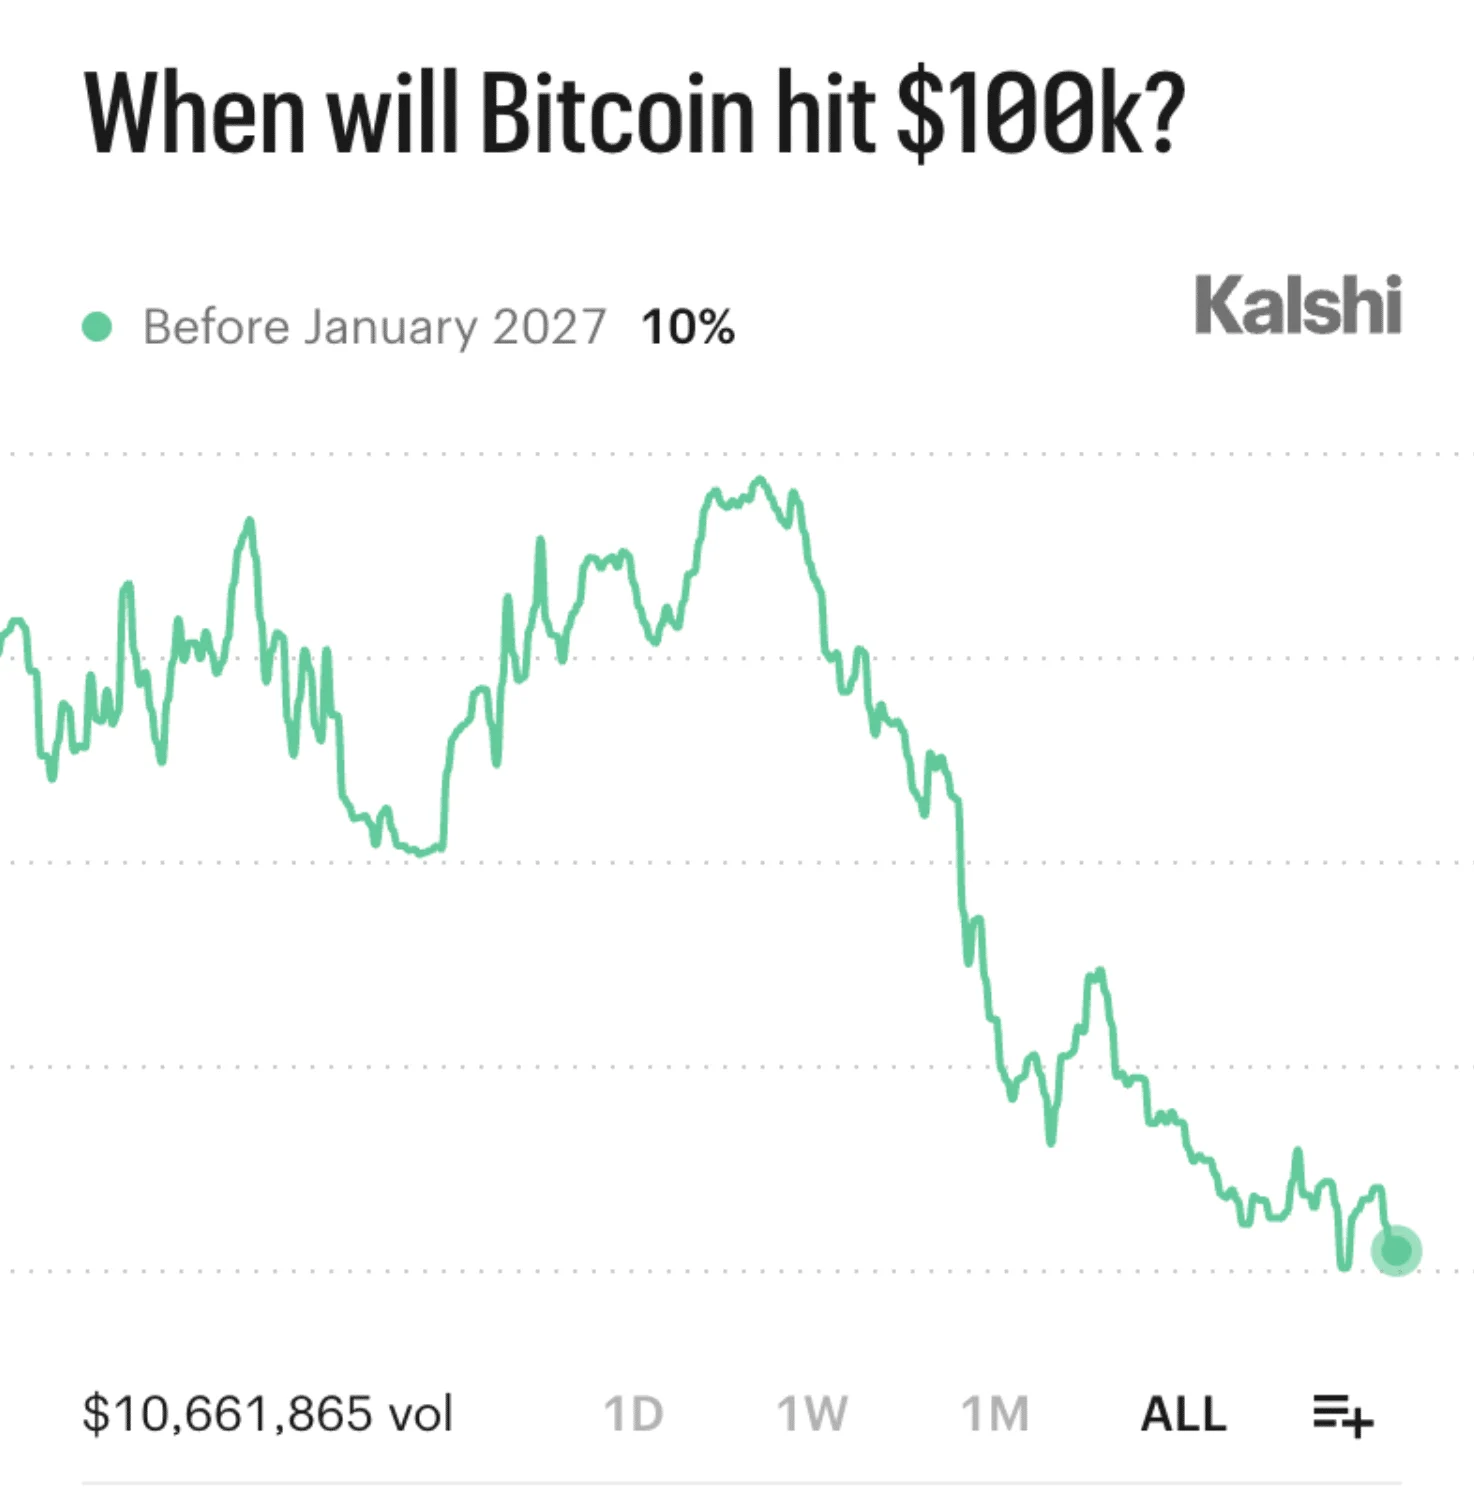
Nonetheless, Kalshi traders gave Bitcoin a 10% chance of reaching $100,000 before year-end.
This marked the event’s lowest implied probability on record. It suggested traders saw only a one-in-ten chance of that outcome.
At the same time, Fidelity Research analyst Zack Wainwright believes that a larger portion of the circulating supply is being held by investors with strong convictions rather than active traders.
However, over 40% of this supply of long-term holders is underwater, which means that they were purchased at prices higher than the current market value of Bitcoin and are now sitting at unrealized losses.
Final Summary
- Though Bitcoin has seen a hike in the past 24 hours, it has dropped from $76k to $63k from 19th May to press time.
- Many analysts believe that Bitcoin is starting to form a bottom, and further declines are expected.