
Pi Network [PI] ranks among the biggest losers from the capital flush that swept the crypto market over the weekend.
The sell-off has dragged PI down nearly 12%, and the pressure shows little sign of easing as seller momentum builds. CoinMarketCap data puts trading volume up 129% at $17.7 million, underlining the strength behind the move.
The bigger concern is that PI could print a new all-time low, undercutting the one it set in the early hours of Monday, the 13th of July.
Table of Contents
PI’s descending channel keeps an all-time low in play
A fresh all-time low stays firmly in play, given how PI has reacted to the support level it recently breached.
The token has traded inside a descending channel for months, consolidating lower between parallel support and resistance lines. Such structures often precede a stronger upswing, yet they break to the downside just as readily.
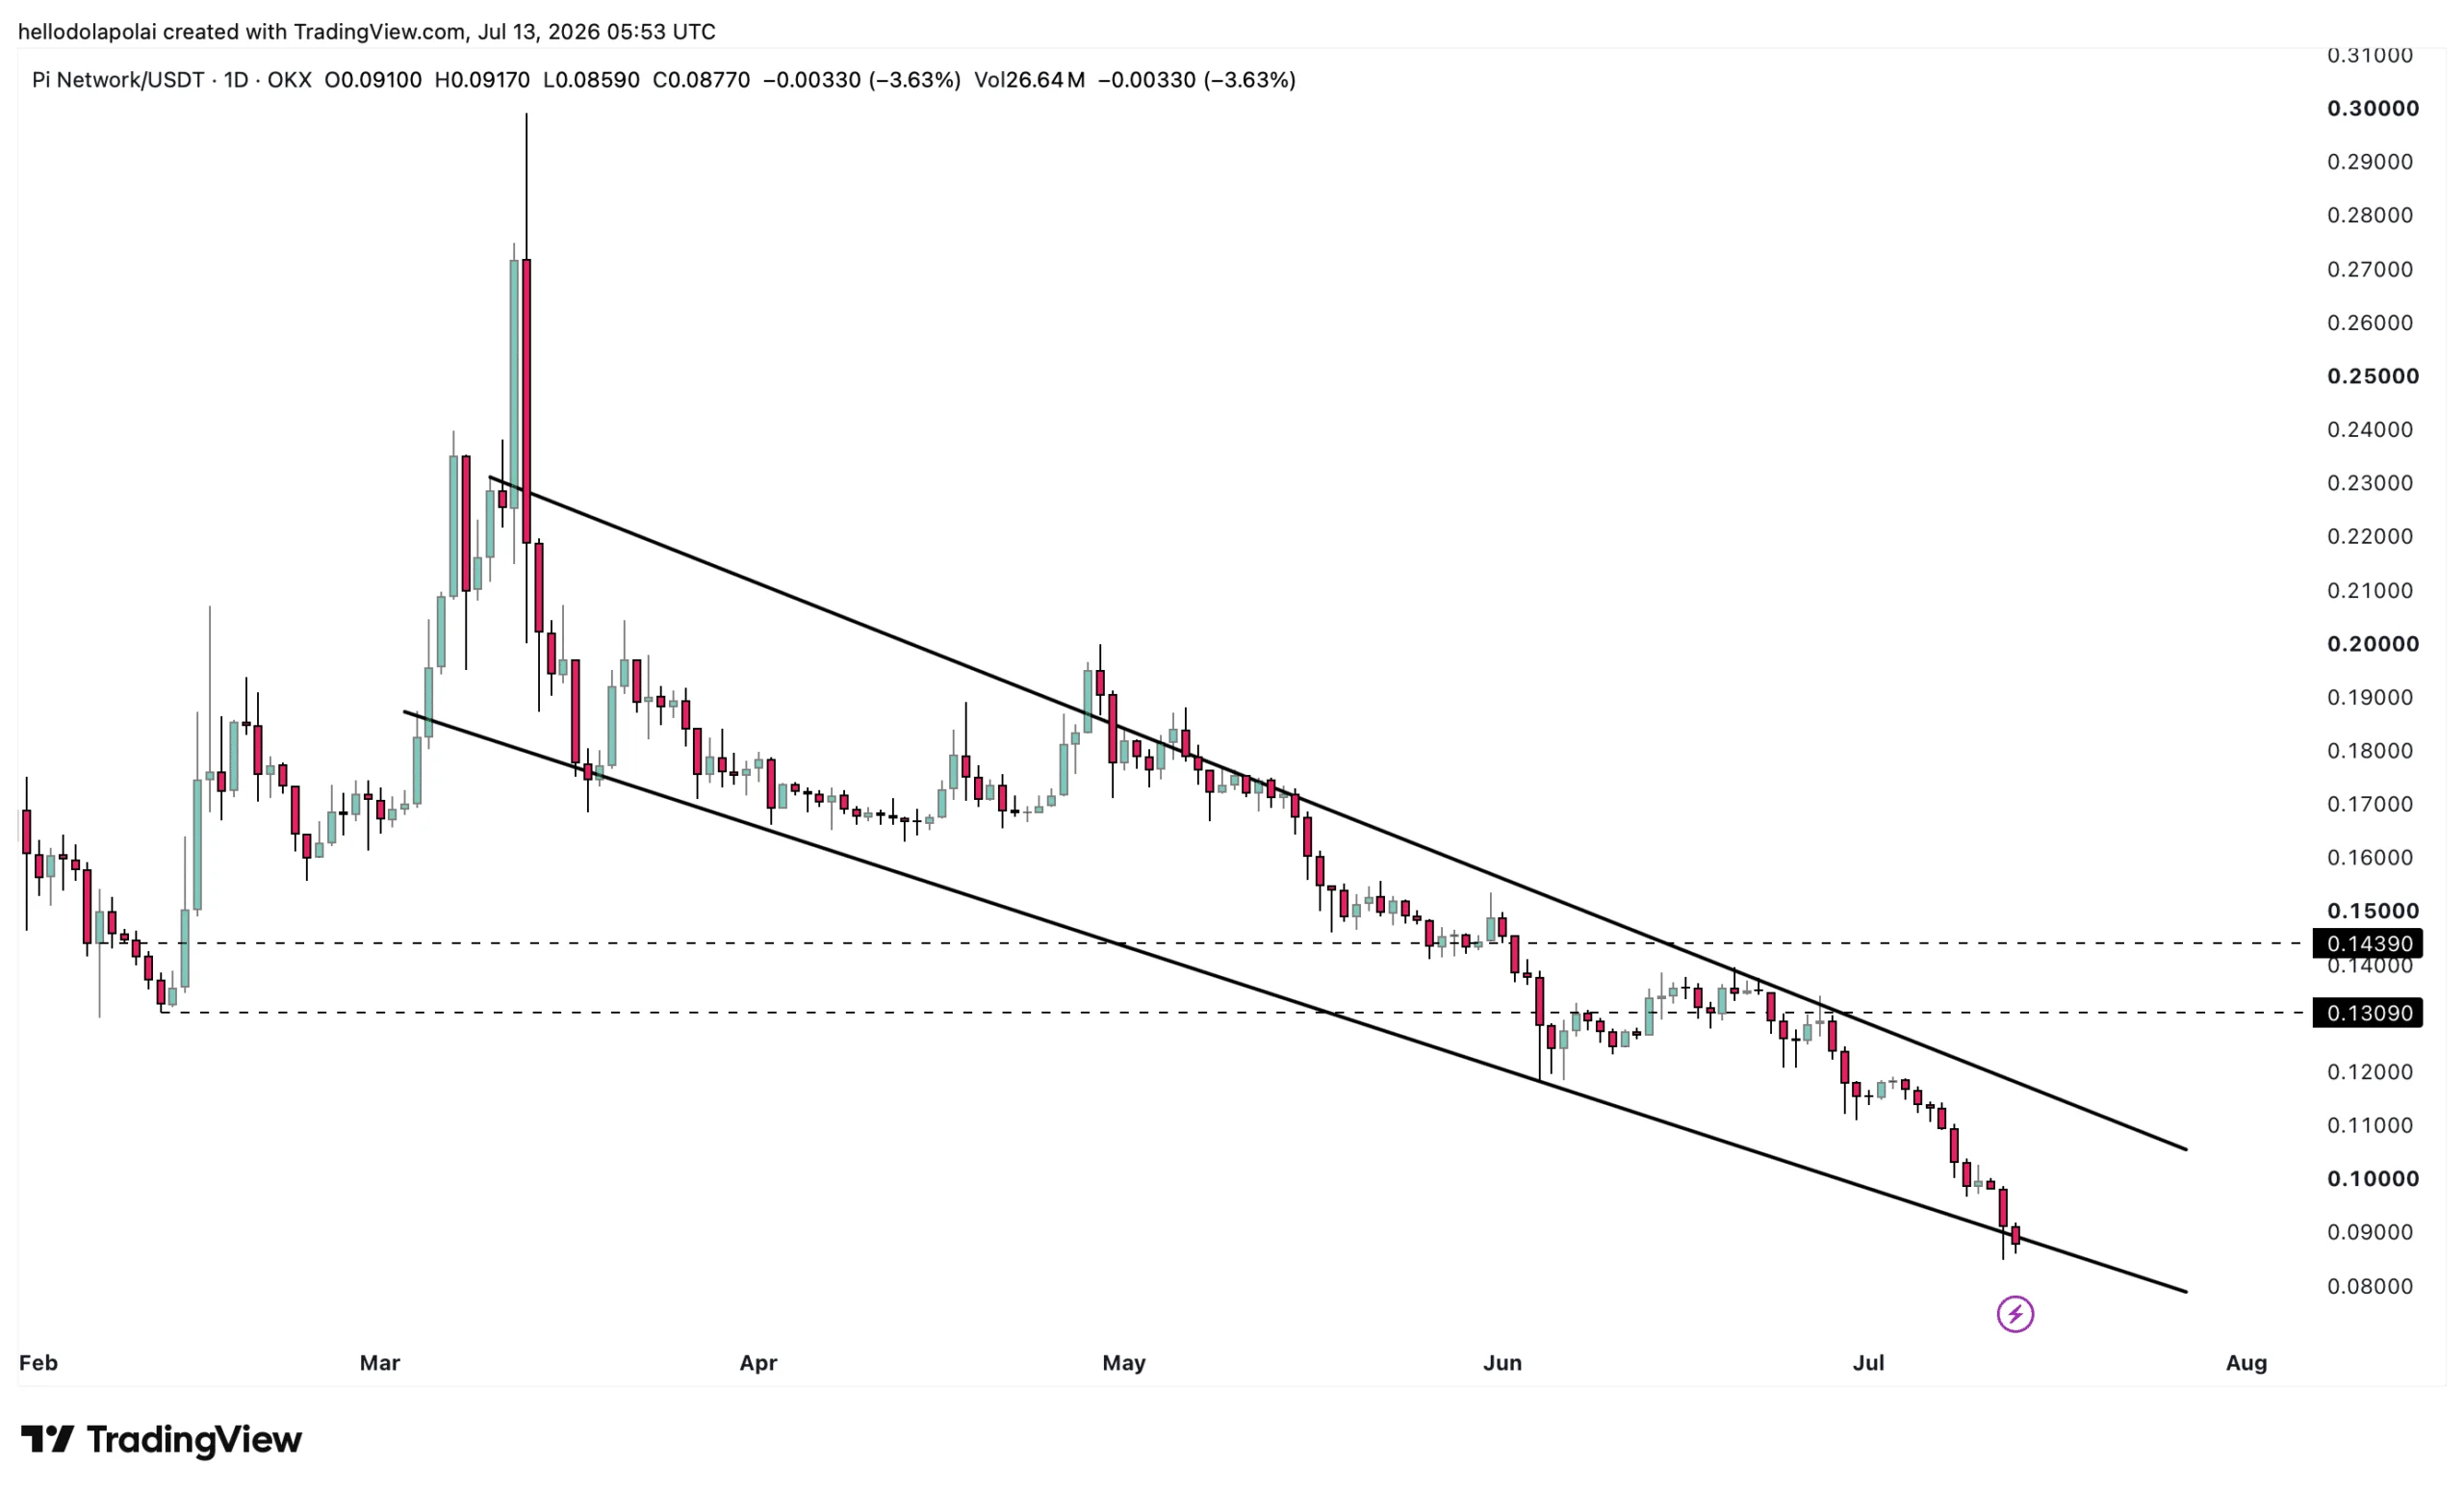
For PI, the odds now favor a breakdown, and the outcome hinges on whether the price closes above or below the support line it is currently testing. A close beneath that line, with selling pressure intact, points to further downside, while a reclaim would keep PI ranging within the channel.
Bears tighten their grip as outflows deepen
The bears hold full control, with sell-side volume climbing steadily.
The Accumulation/Distribution indicator, which reads whether buyers or sellers dominate an asset’s trades, confirms their grip, with its cumulative reading down to -343 million at press time.
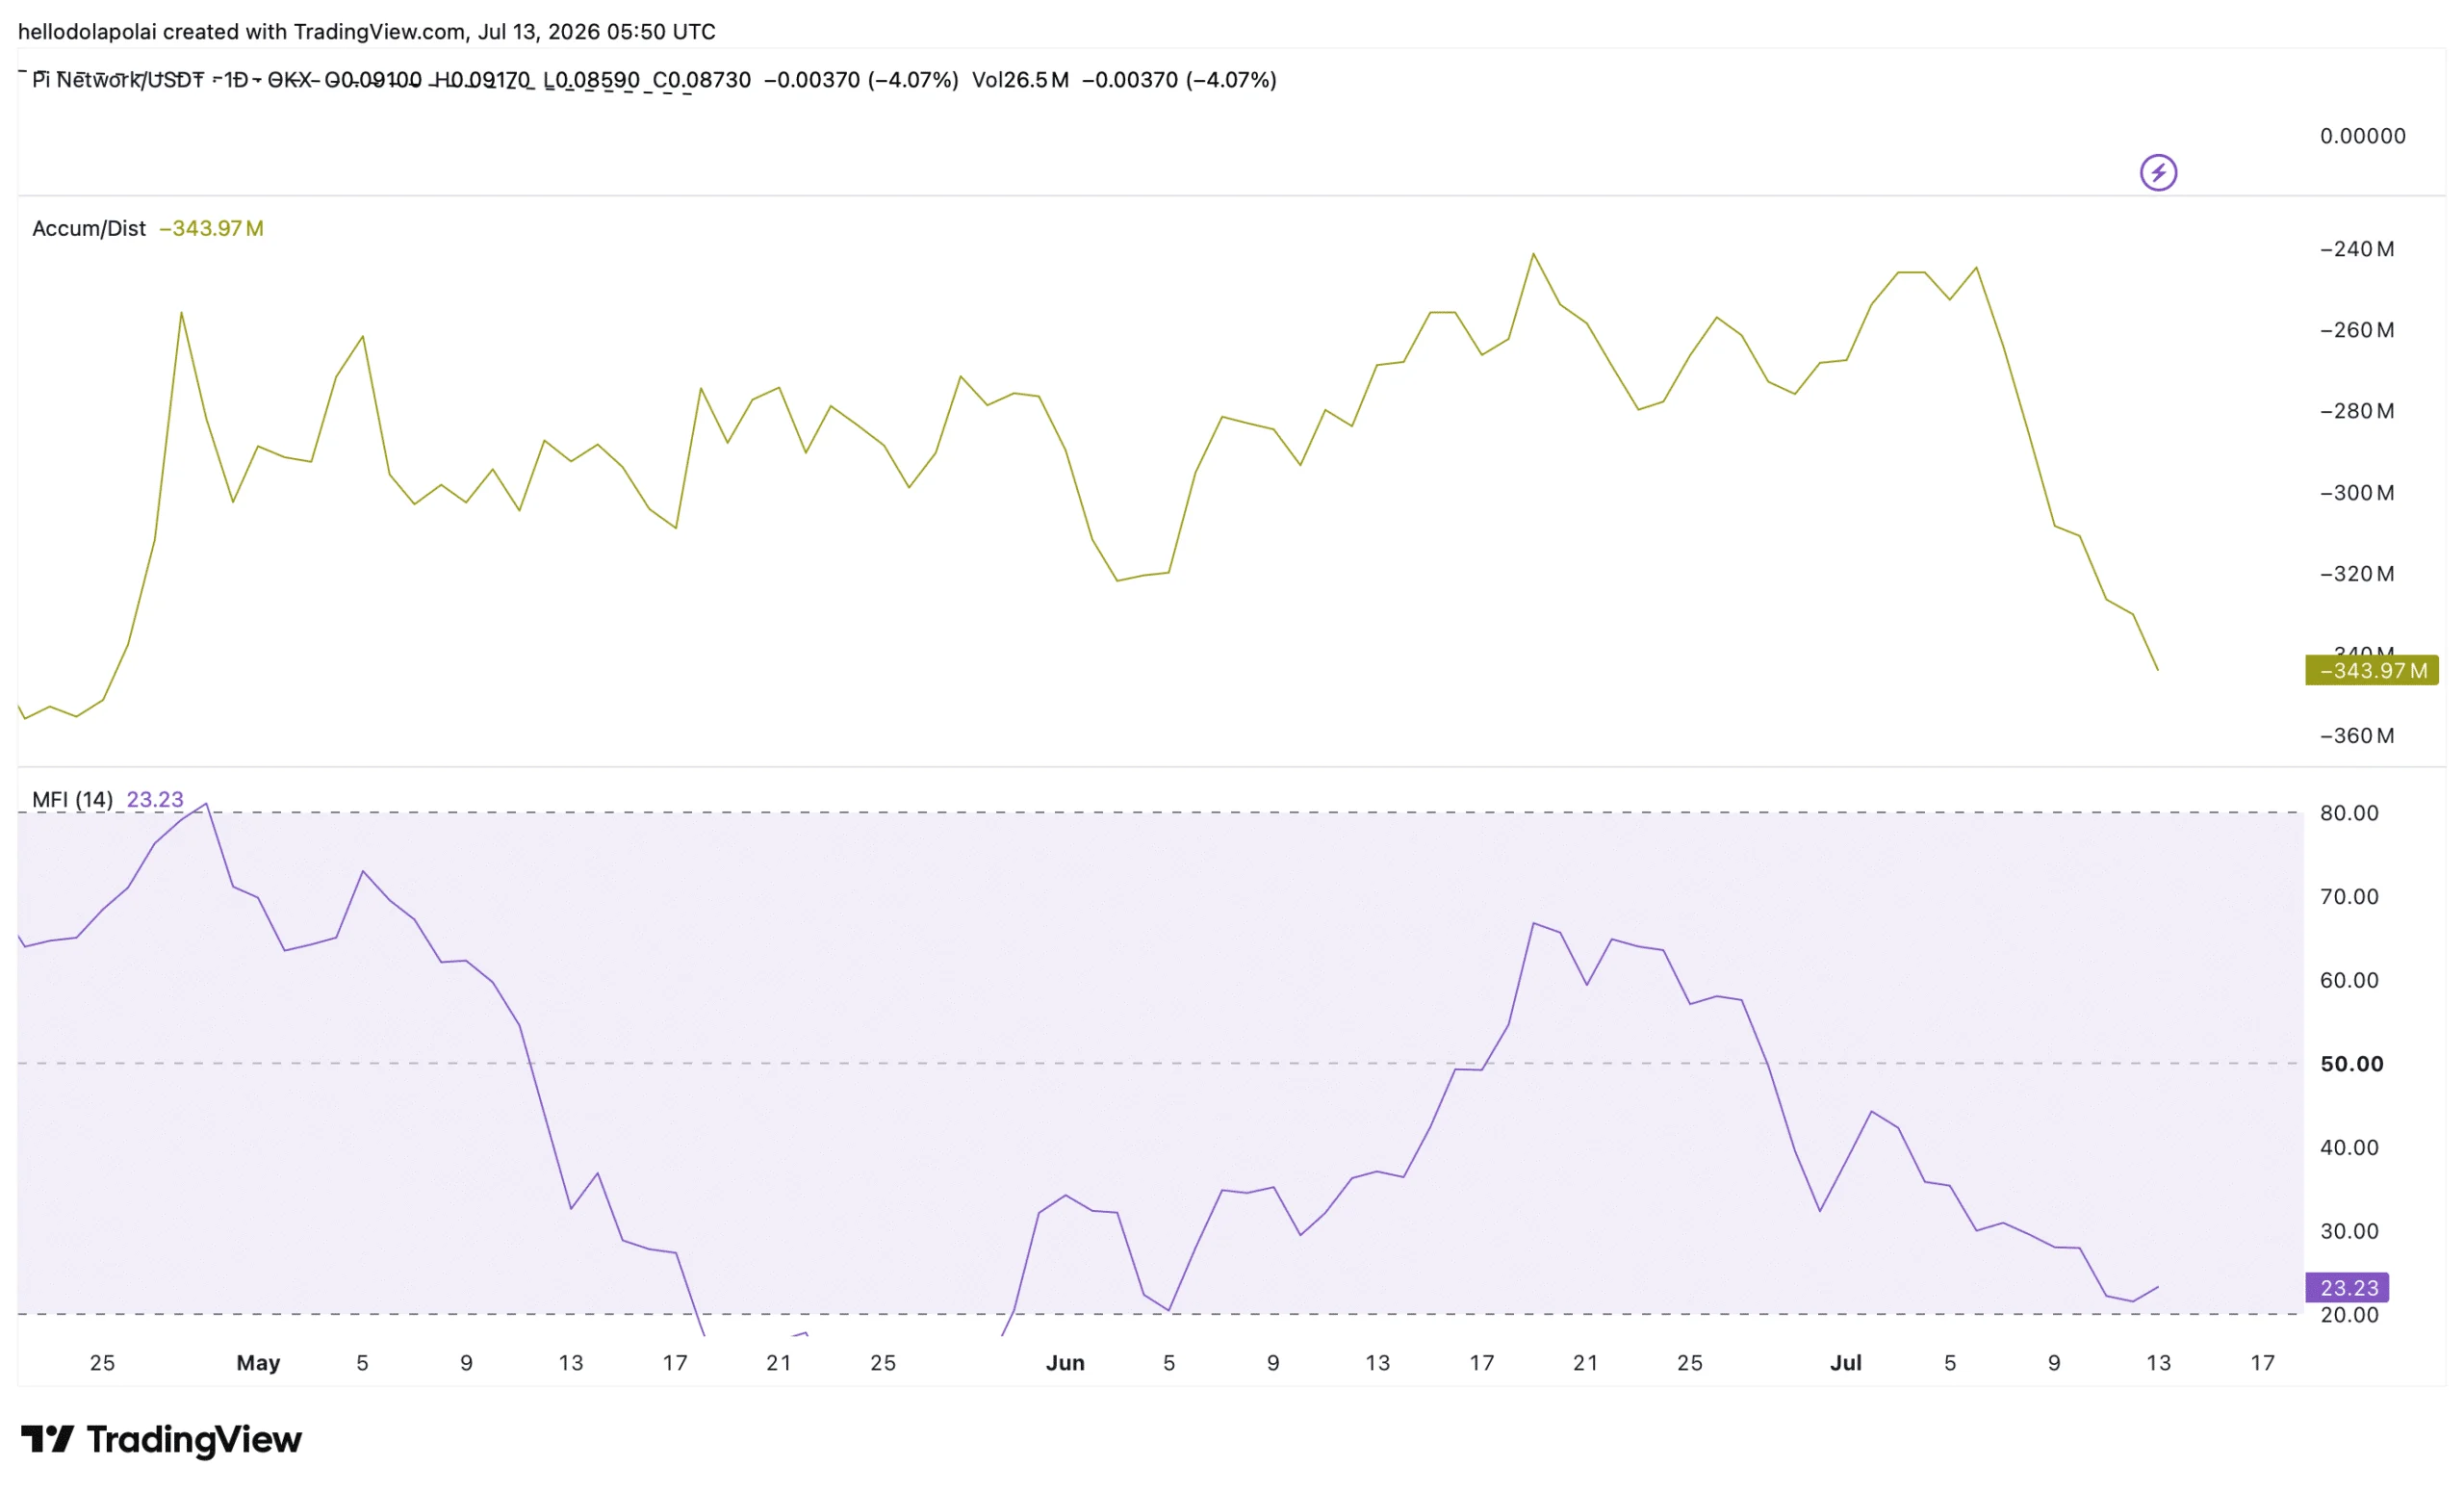
The Money Flow Index, which tracks capital moving into and out of an asset, has slid sharply alongside it. The MFI now reads 23, near the low end of the 20-to-50 capital-outflow zone, though it has ticked up slightly.
Should the MFI hold in that lower band without breaking 20, sell pressure and capital outflows could intensify. A move below 20 would instead mark PI as oversold, opening the door to a rebound and fresh inflows.
Funding Rate points to deeper losses
The Funding Rate, which tracks whether traders position their capital bullishly or bearishly, shows the market leaning heavily to the downside. At the time of writing, the rate had plunged to roughly -0.0565%, with capital concentrated on the short side.
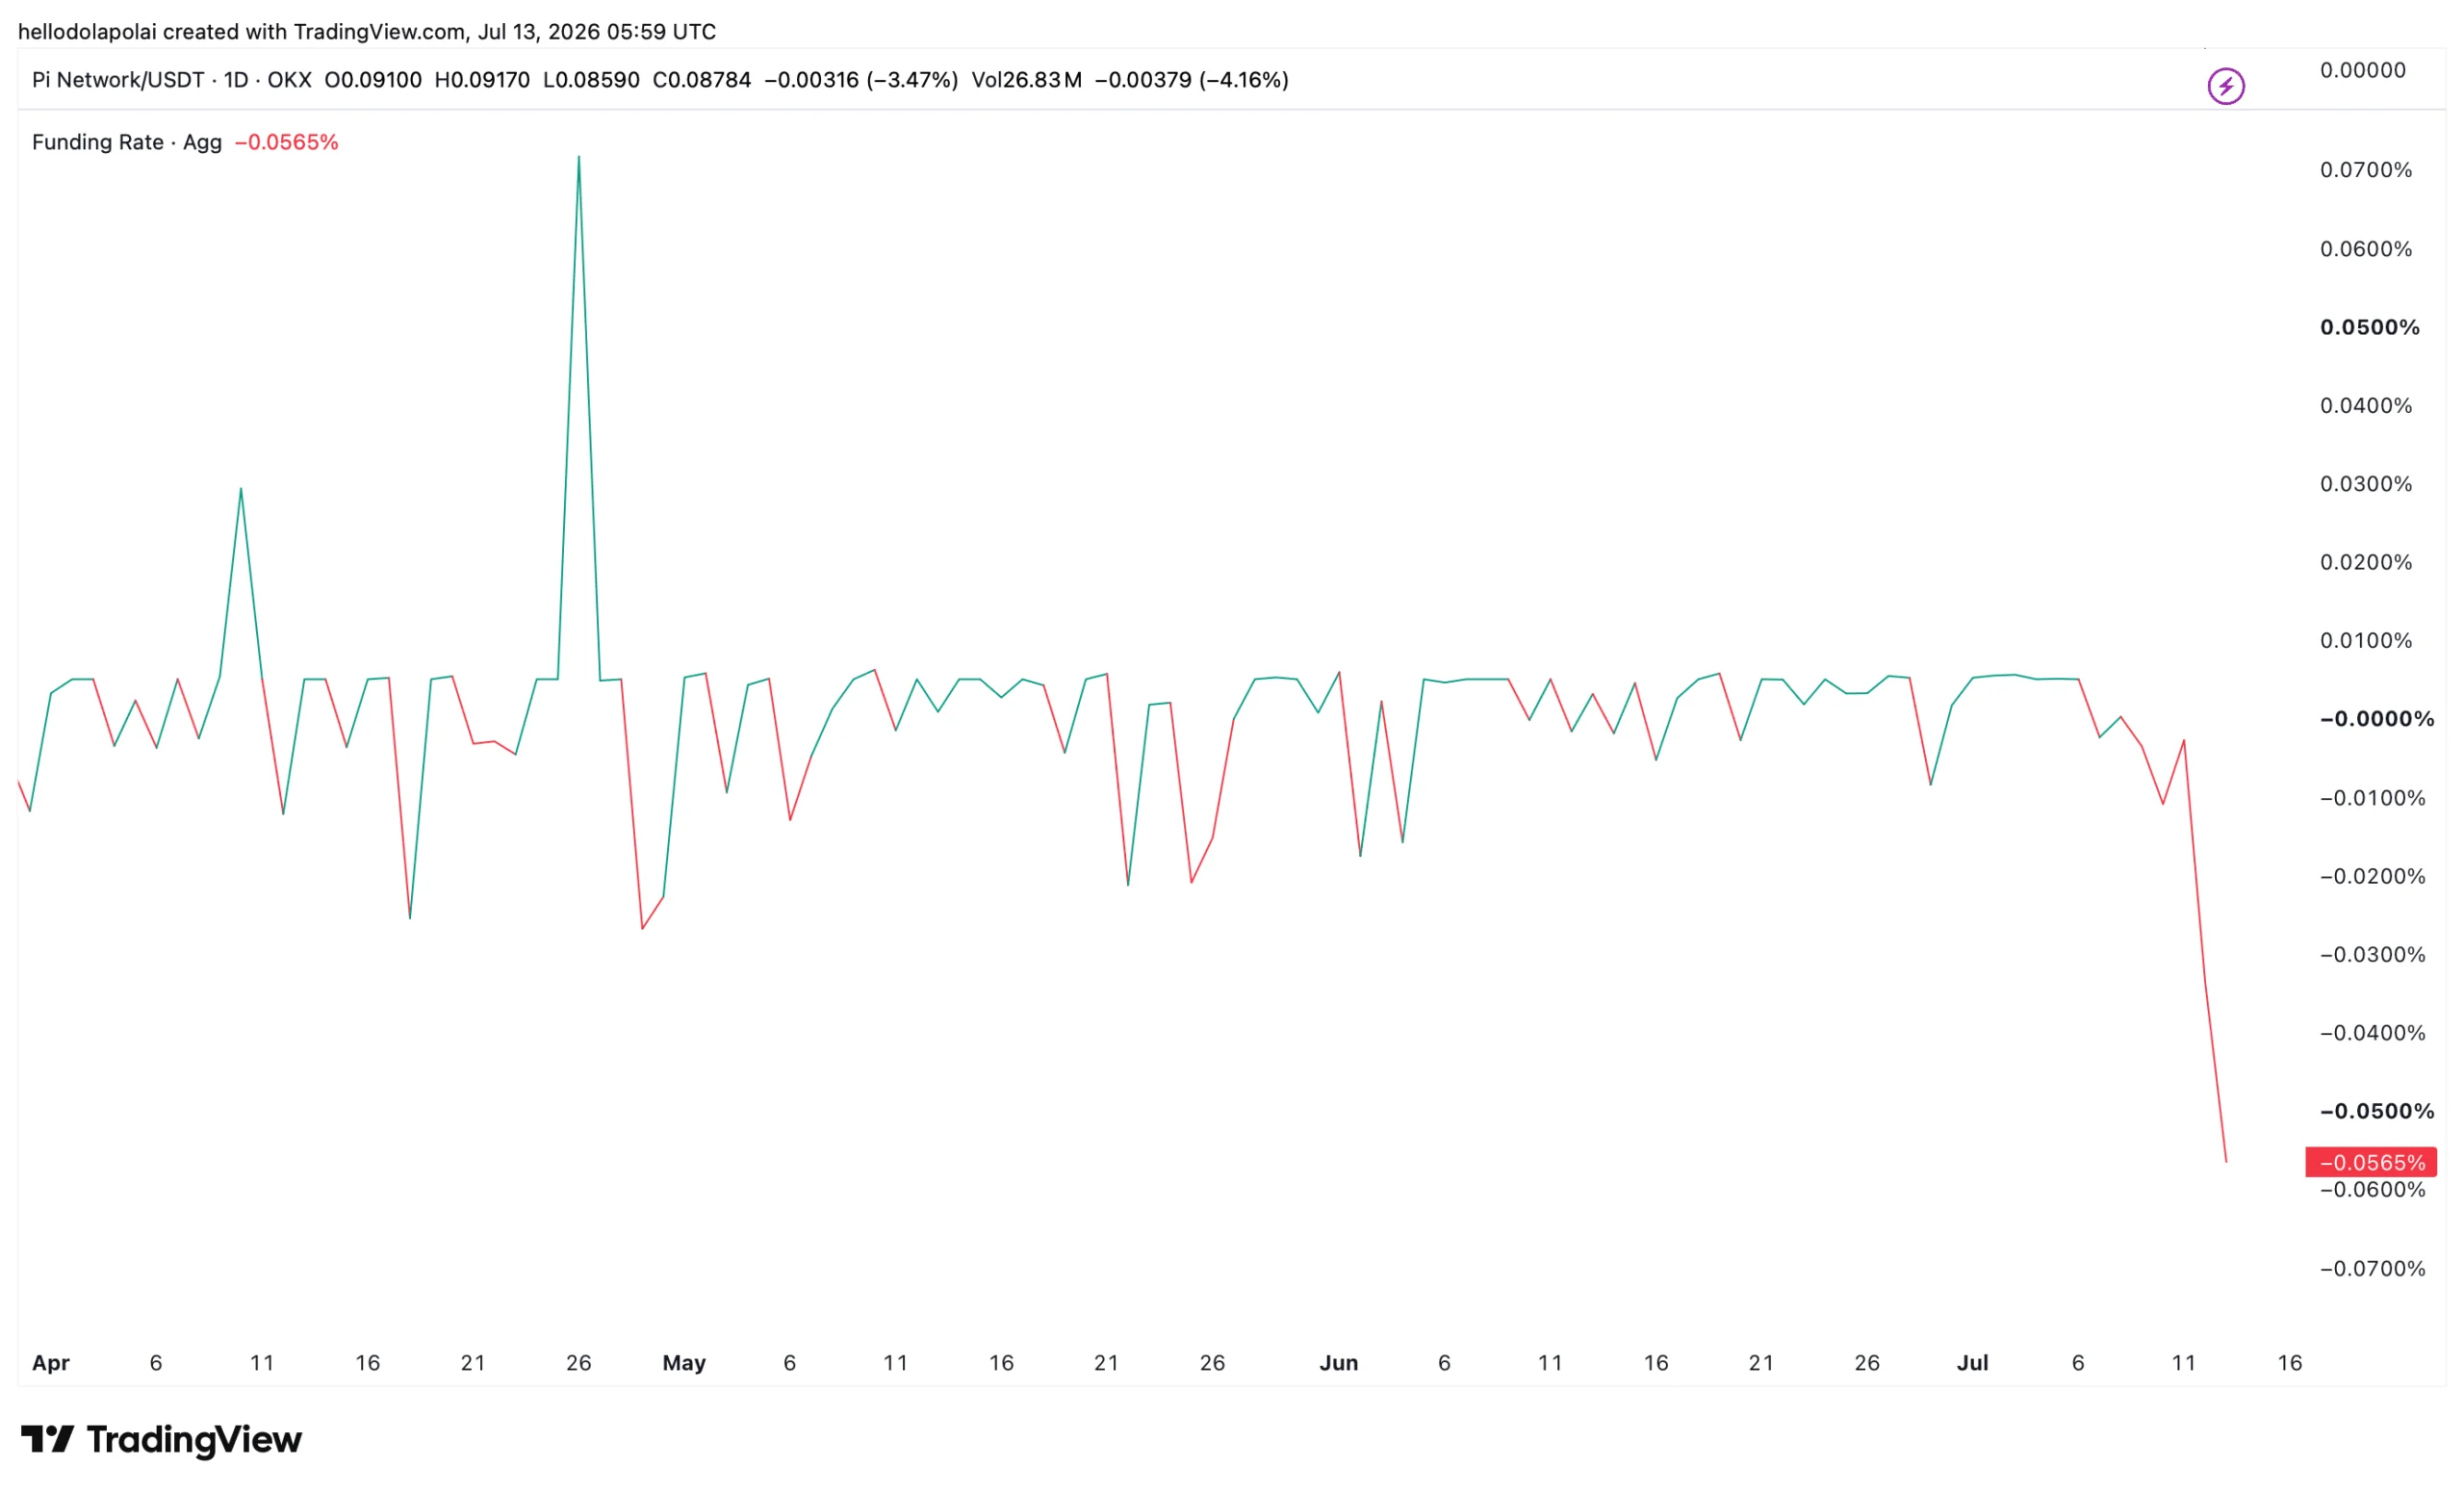
A deepening bearish tilt, at a moment when market momentum is already fragile, suggests PI stays on its downward path and logs further losses.
Final Summary
- PI dropped almost 12% over the weekend as trading volume jumped 129% to $17.7 million, and sellers show no sign of slowing.
- Accumulation/Distribution, Money Flow Index, and Funding Rate readings all lean bearish, keeping a new all-time low firmly on the table unless PI reclaims its current support.