Bitcoin [BTC] and the rest of the crypto market experienced increased volatility on the 9th of September. Bitcoin rallied to $79,760 on the day, but just 14 hours later, it had shed 2.49% in value to fall to $77,770.
Why is crypto falling today?
The retracement saw BTC retest the local support zone at $77.9k. The move resulted in the highest 1-day liquidation numbers in nearly a week, with $269.96 million in longs and $116.62 million in short positions forcefully closed.
The spot Bitcoin ETF flows indicated a slowdown in demand. Over the previous two trading days, ETFs saw a combined outflow of $166.8 million, according to Farside Investors’ data.
AMBCrypto reported that long-term holders have been taking profits. Selling pressure from this cohort could have contributed to the short-term correction. The good news for the bulls was that the $76k demand zone held, keeping hopes of a recovery alive.
In the long-term, the $76k-$82k is a key battleground for both bears and bulls. 35% of the Bitcoin supply has been accumulated at this level or higher.
Most importantly, the price correction was part of a broader market retreat. Higher oil prices spurred fears of inflation acceleration, and the U.S. Federal Reserve rate hike probability has reached 60.2%.
The Bitcoin short-term bias is bullish but facing threats

On the 4-hour chart, BTC maintained a bullish price structure. Last week’s push to $82,300 confirmed continuation, and although the current retracement is deep, price remains above the $77k demand zone (cyan).
Moreover, BTC needs to fall below $76,264 to flip its 4-hour structure bearishly.
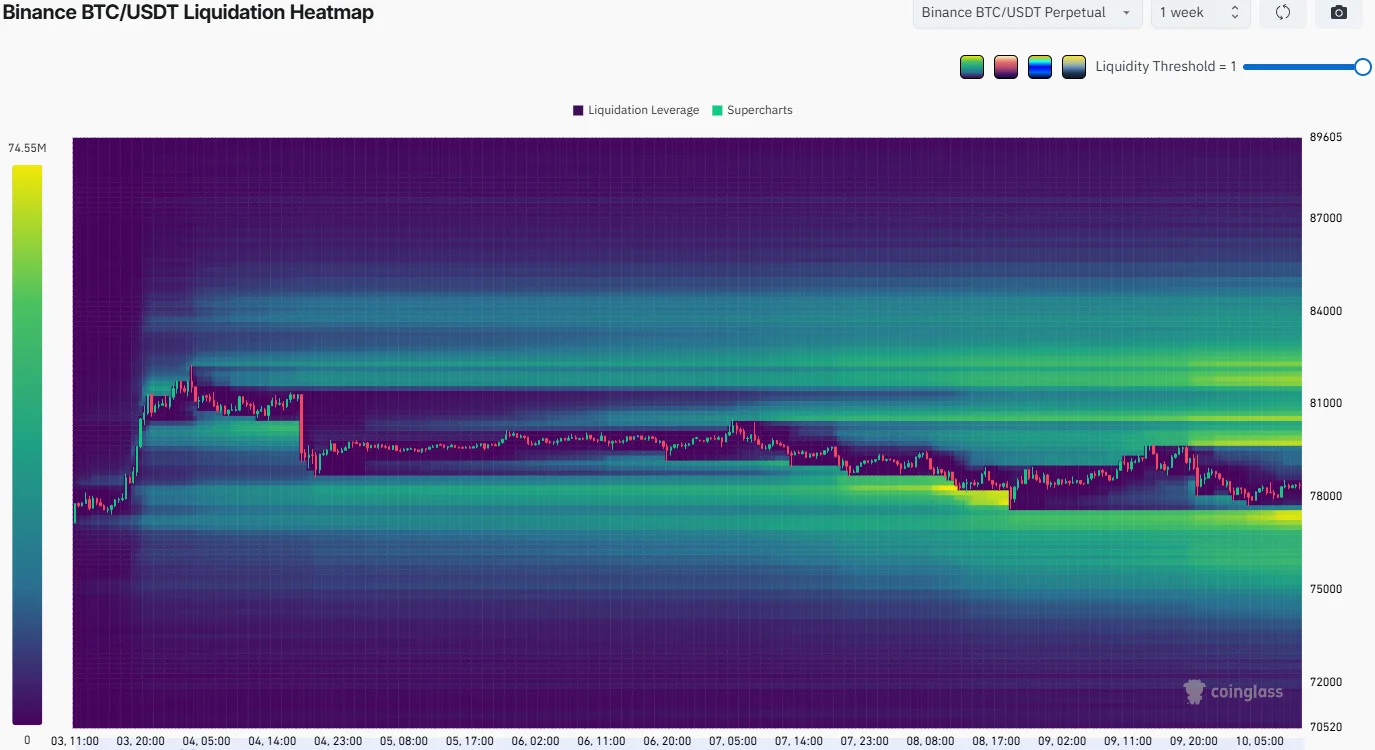
The 1-week liquidation heatmap highlighted the key nearby magnetic zones. The nearest and densest one was at $77.4k. There is a chance that price volatility could see BTC pulled down to this level before a move higher.
To the north, the $79.7k, $80.5k, and $82k levels were other magnetic zones to keep an eye on.
Final Summary
- Negative spot ETF flows and long-term holder profit-taking contributed to the price retracement in the past 24 hours, accompanied by more than $200 million in long liquidations.
- Higher oil prices spurred fears of inflation acceleration, and the U.S. Federal Reserve rate-hike probability has reached 60.2%.