Home Blog Page 104

OKB nears $100 resistance as volume and network activity rise

0
OKB nears $100 resistance as volume and network activity rise


OKB showed renewed bullish momentum as network activity and trading volume strengthened its breakout setup.

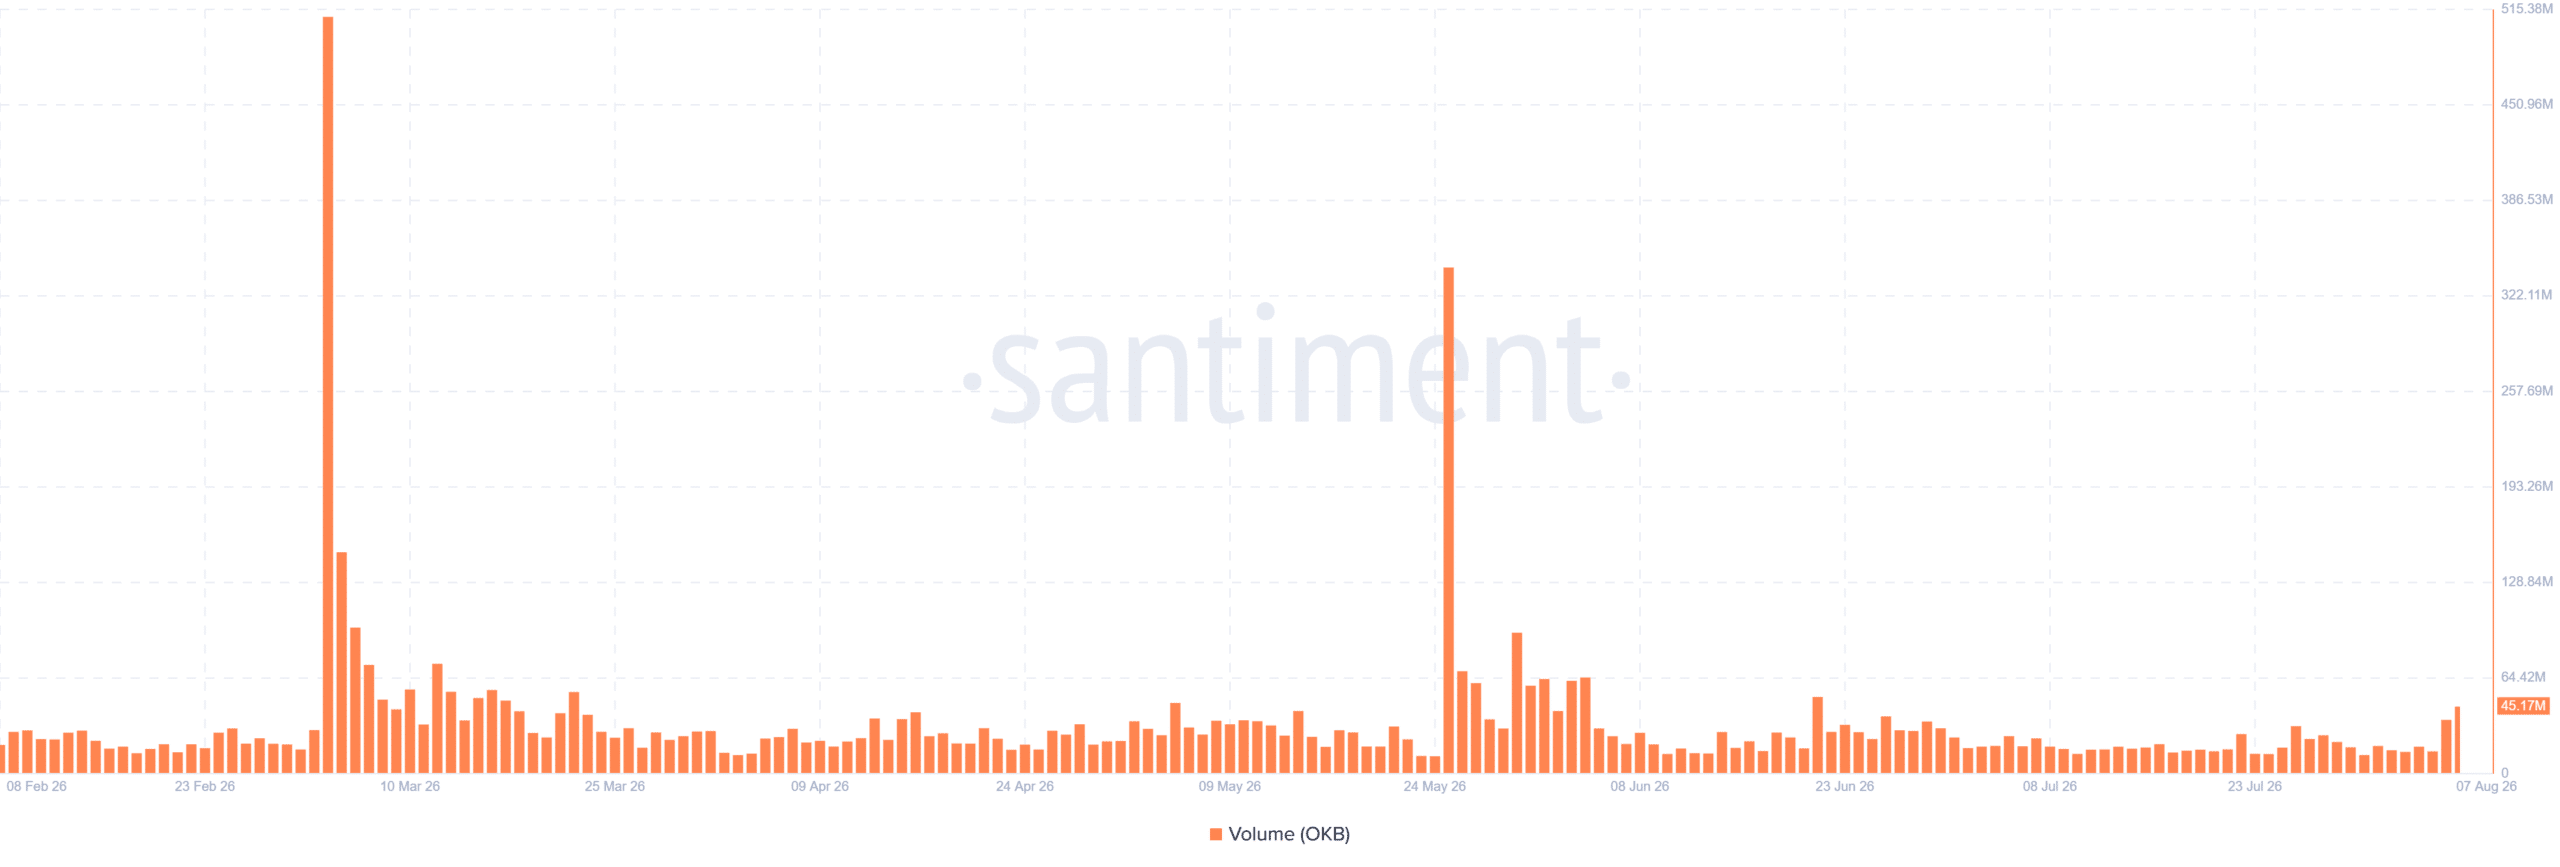
The token traded near $93.17 after gaining 5.9% in 24 hours. Daily trading volume surged 63% to $45.14 million.

The volume increase suggested stronger market participation as OKB approached a major resistance level.

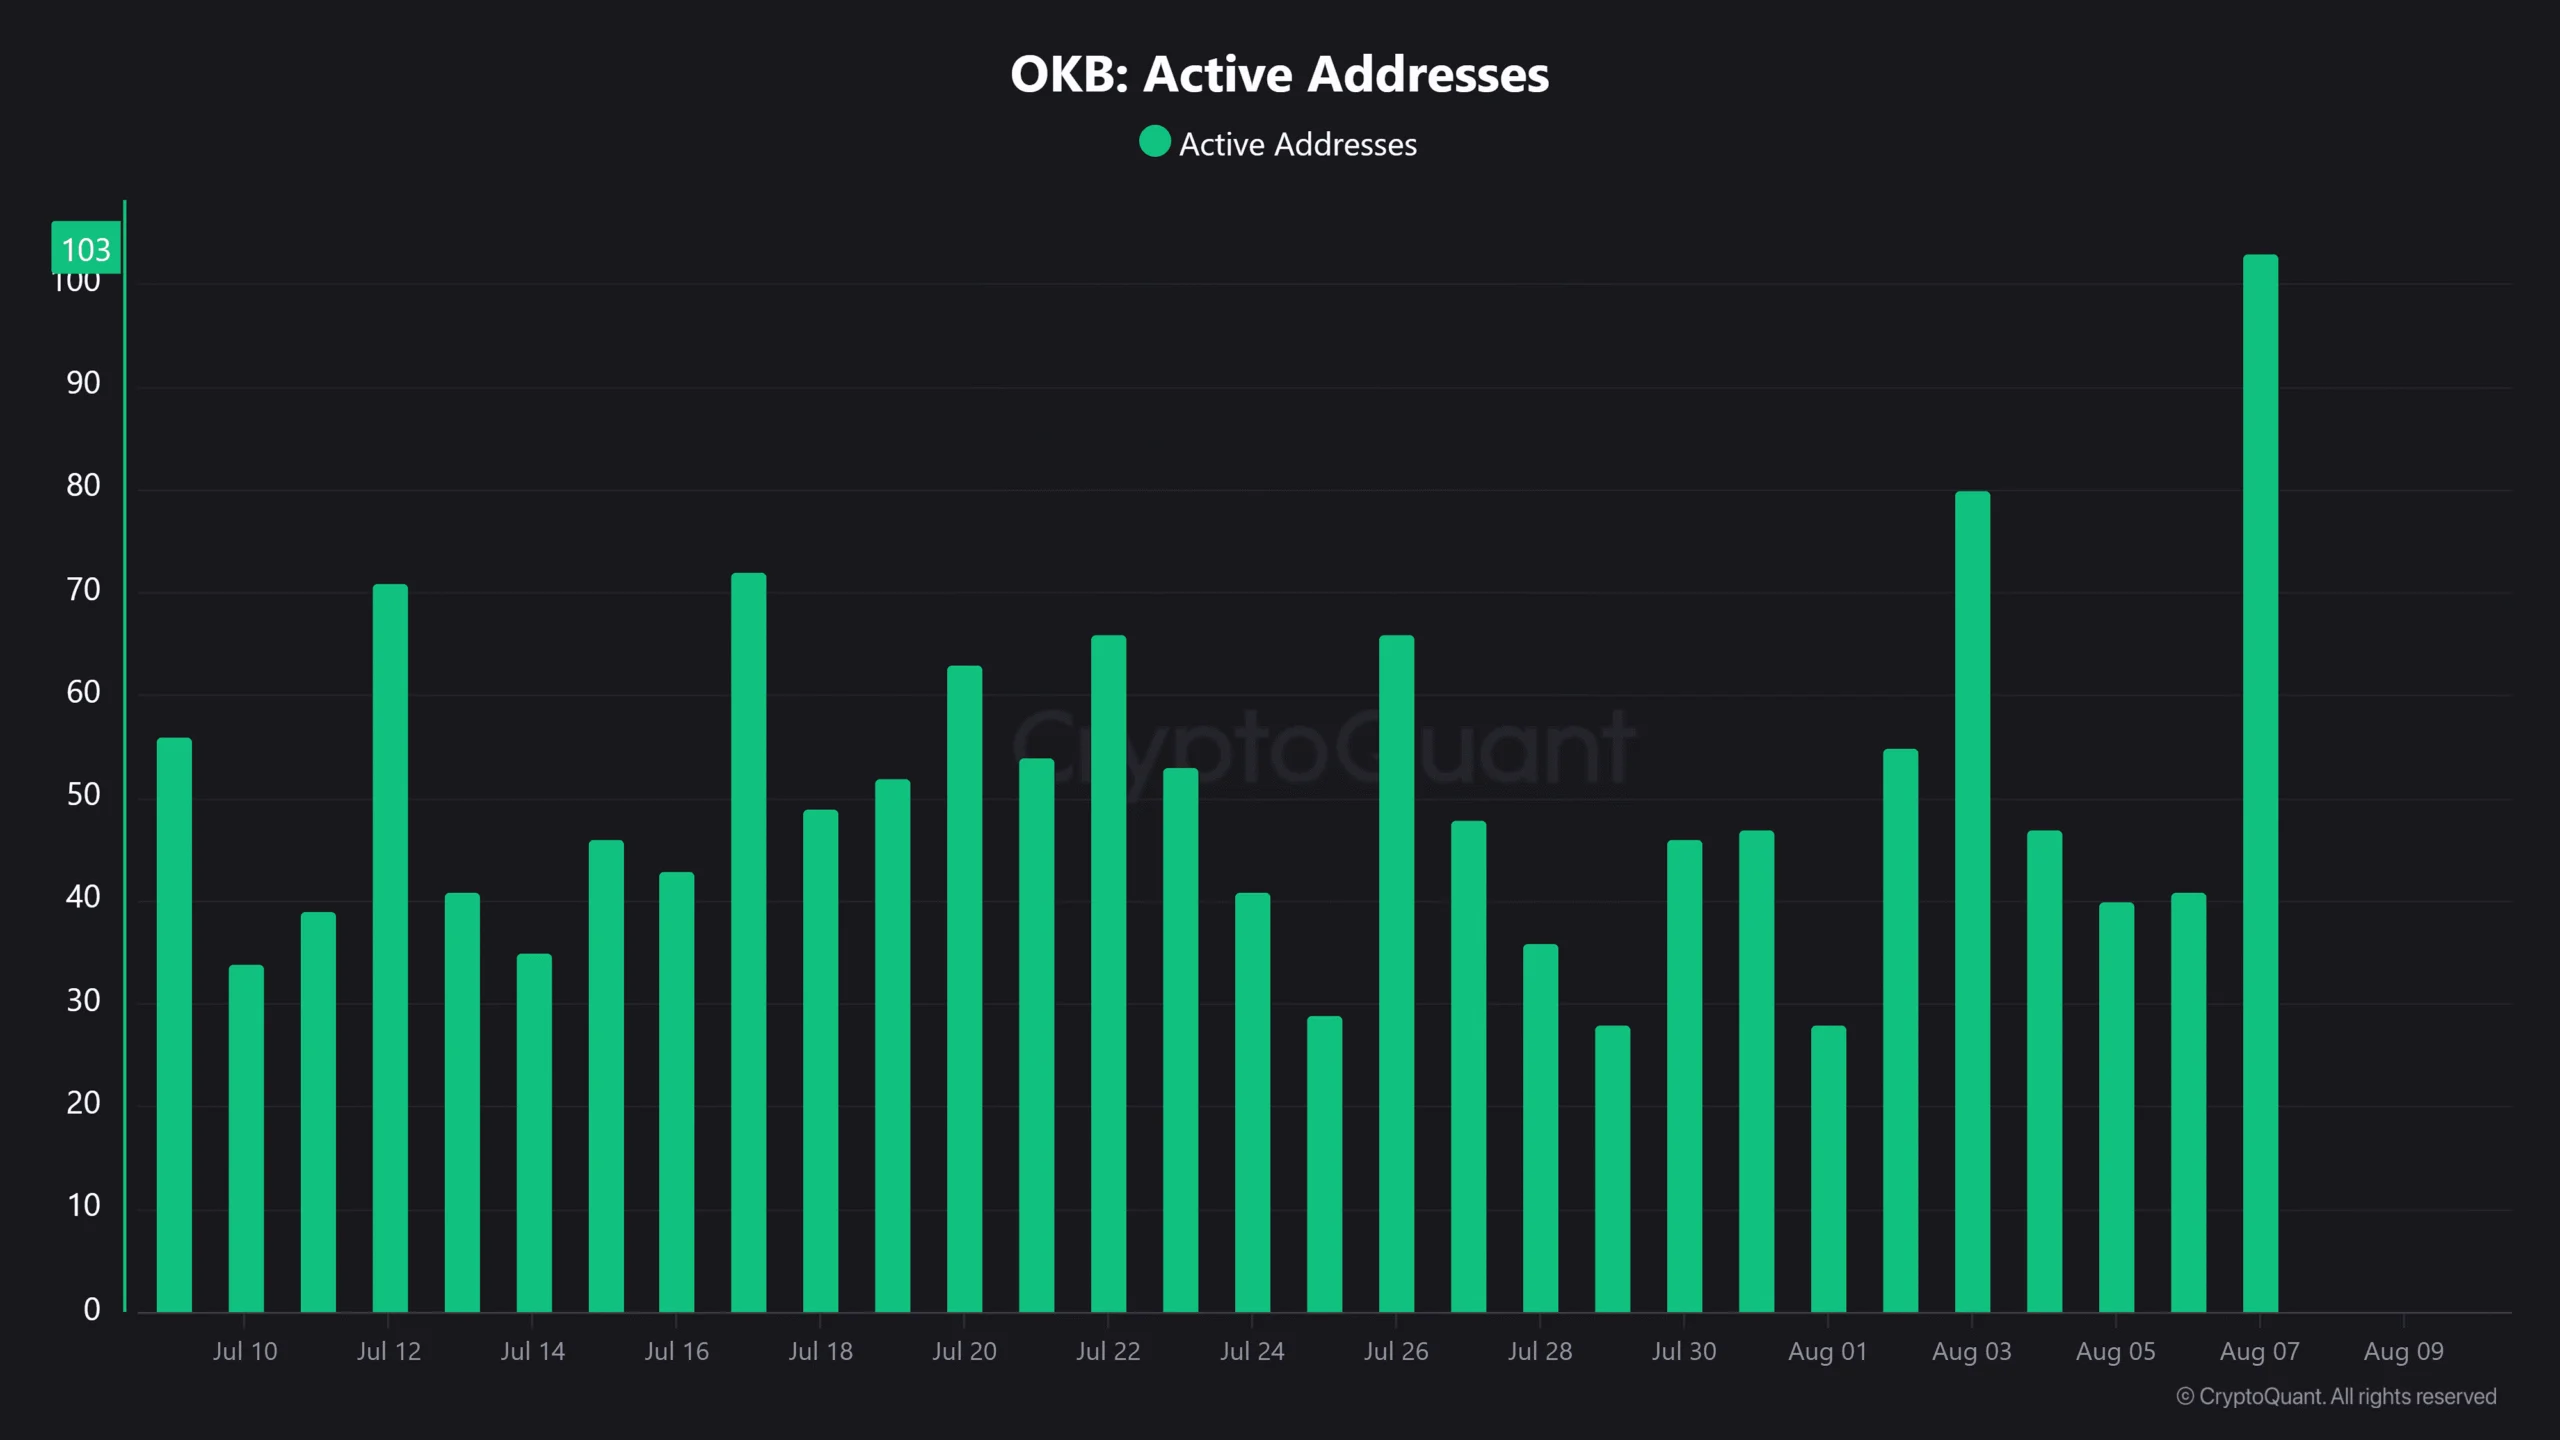
Network activity also supported the bullish outlook. Active Addresses climbed to 103, their highest level this month. That signaled increased on-chain participation alongside OKB’s latest price move.

OKB Active Addresses
Source: CryptoQuant

Can OKB break above $100?

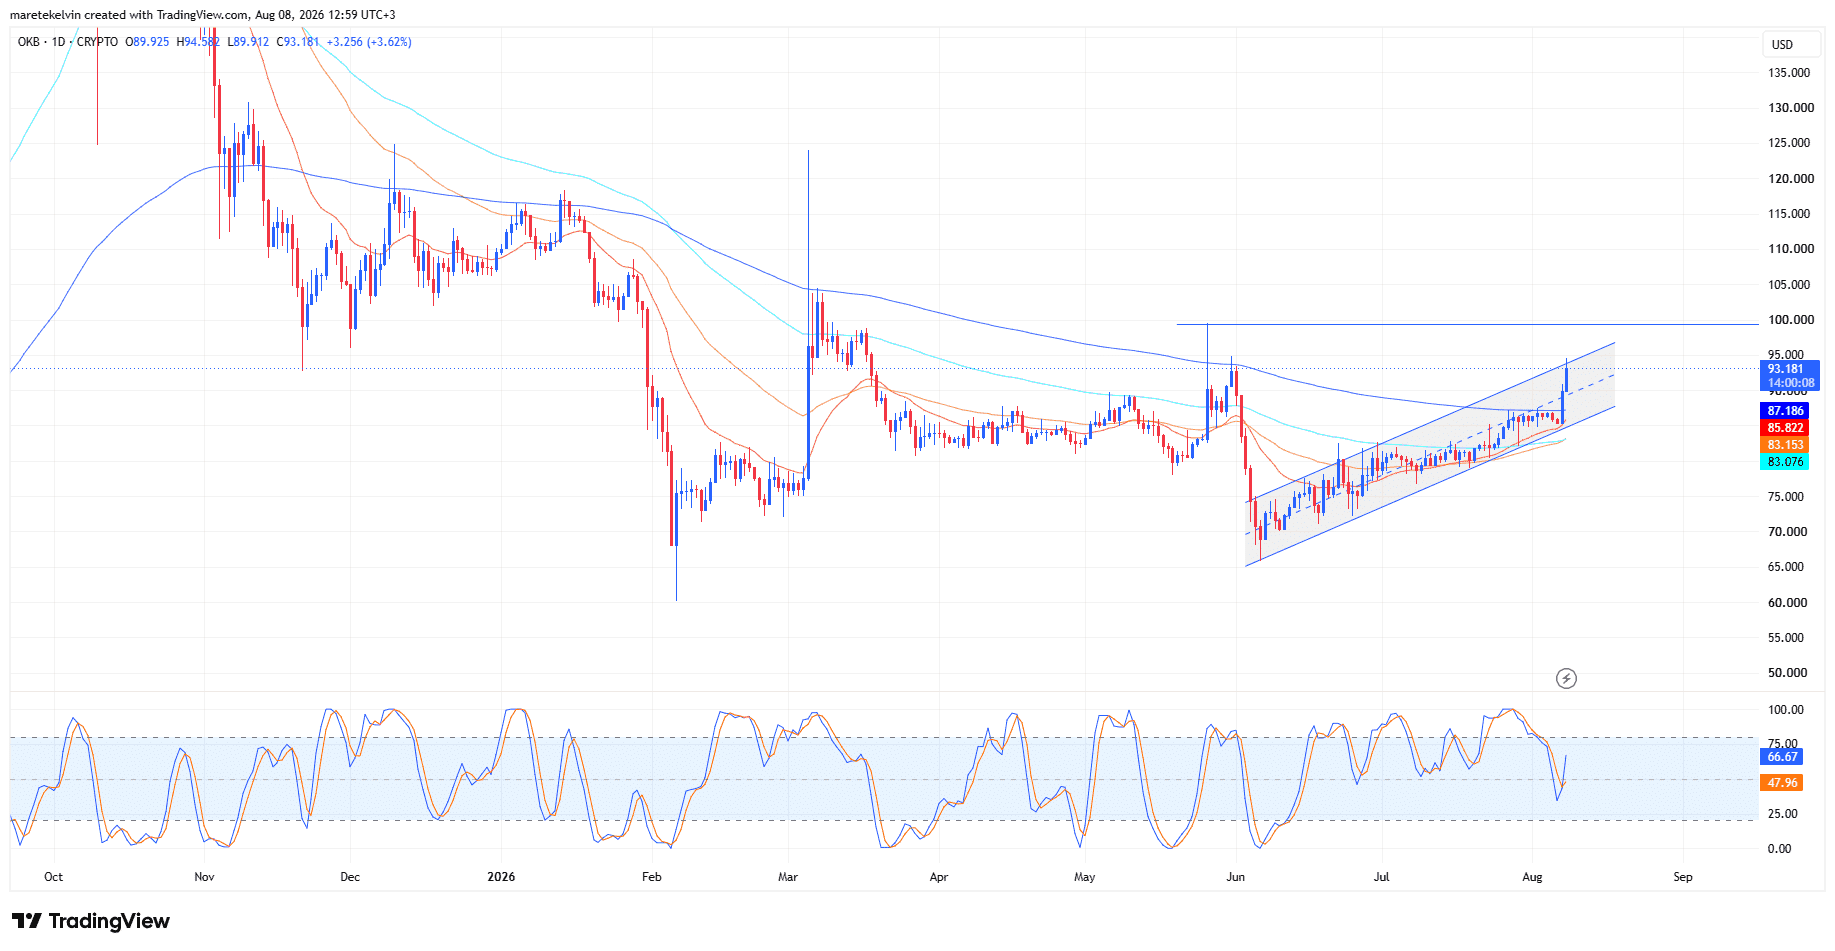
On the daily chart, OKB traded within a bullish flag after recovering from its June lows. The token approached $100, a psychological level that aligned with the pattern’s upper resistance.

A decisive breakout above $100 could confirm the broader recovery’s continuation.

OKB also traded above its 20-day, 50-day, 100-day, and 200-day EMAs. Holding above those Moving Averages kept the medium-term structure tilted toward the bulls.

However, Stochastic RSI rose toward elevated levels and stood near 66.67. The reading showed that buyers had control. It also raised the chance of short-term consolidation.

OKB price analysisOKB price analysis
Source: TradingView

Is volume supporting OKB’s rally?

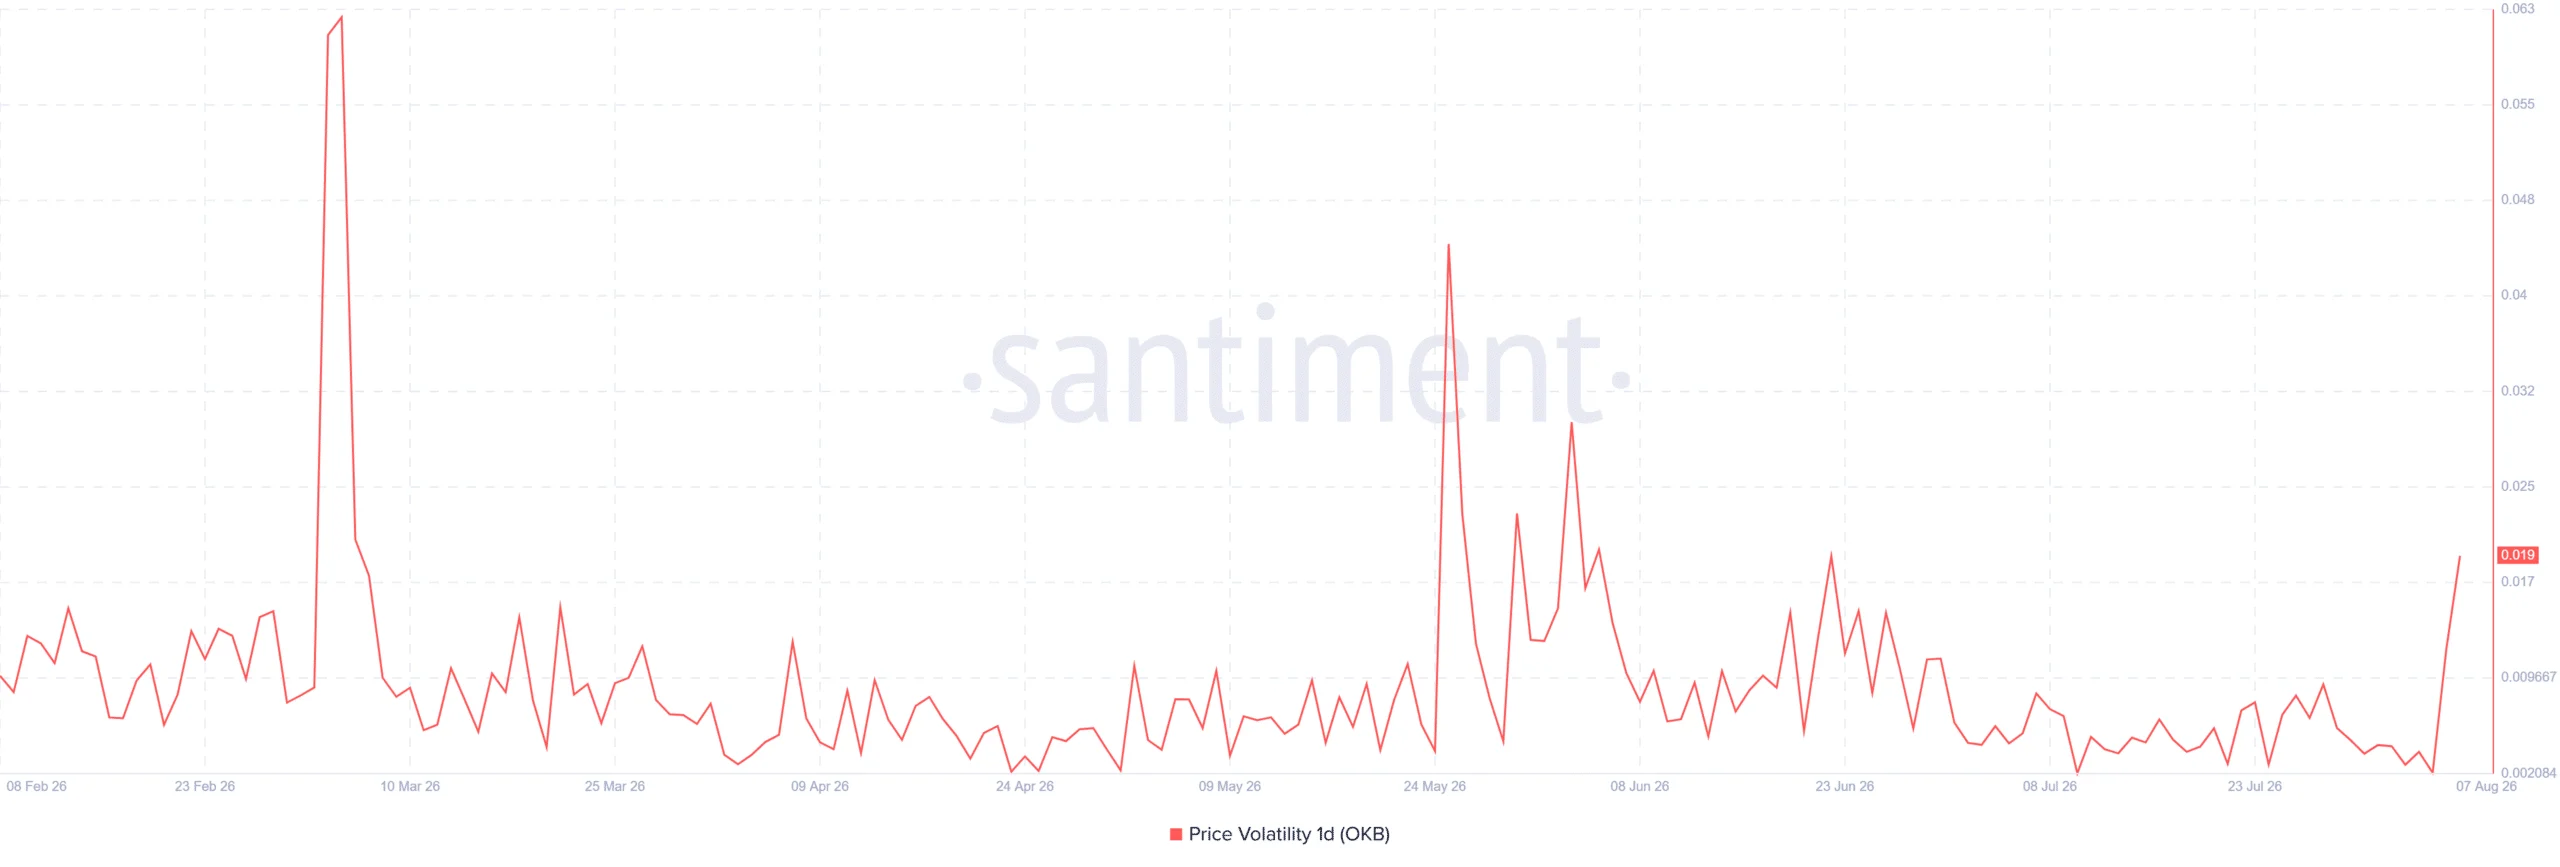
OKB’s latest move came with a sharp increase in volatility.

The Daily Volatility metric climbed to roughly 1.9%, its highest level since late June.

Historically, higher volatility coincided with larger OKB price swings. That made the $100 test particularly important.

OKB price volatilityOKB price volatility
Source: Santiment

Meanwhile, daily trading volume reached $45.14 million after a 63% increase. A sustained volume increase during a breakout would strengthen the case that buyers absorbed available selling pressure.

A daily close above $100 could confirm the bullish flag breakout. Rejection could send OKB toward its EMA support cluster near $85 to $87.

OKB Trading VolumeOKB Trading Volume
Source: Santiment

Final Summary

  • OKB Active Addresses reached 103, their highest reading this month, supporting the token’s bullish setup.
  • A daily close above $100 could confirm an OKB bullish flag breakout, while $85 to $87 remains key support.


Source link

Oklo Inc. Q2 2026 Earnings Call Summary

0
Oklo Inc. Q2 2026 Earnings Call Summary


Oklo Inc. Q2 2026 Earnings Call Summary – Moby

Strategic Execution and Platform Integration

Our analysts just identified a stock with the potential to be the next Nvidia. Tell us how you invest and we’ll show you why it’s our #1 pick. Tap here.

  • Achieved first criticality at the Groves isotope facility in less than one year from groundbreaking, demonstrating a record-setting pace for privately funded nuclear deployment.

  • Transitioned from a design-focused entity to a functioning nuclear operator by building in-house capabilities across site development, federal safety authorization, and reactor commissioning.

  • Advancing a vertically integrated ‘Power, Fuel, and Isotopes’ platform to capture value across the entire nuclear lifecycle and reduce dependency on fragmented third-party supply chains.

  • Strengthened the execution engine through the strategic acquisitions of ARMEC and Creative Engineers, shortening feedback loops between engineering, specialized manufacturing, and deployment.

  • Leveraging the Groves experience as ‘reusable execution infrastructure’ to reduce uncertainty for upcoming Aurora powerhouse deployments at INL and the Ohio clean energy campus.

  • Positioned the company as a central participant in the DOE’s Genesis and NLCIC initiatives, aligning with national efforts to scale domestic fuel enrichment and recycling capabilities.

Deployment Roadmap and Guidance Assumptions

  • Targeting a 2028 commercial start-up for the Aurora INL powerhouse, supported by the recent DOE approval of the Preliminary Documented Safety Analysis (PDSA).

  • Implementing a diversified fuel strategy that utilizes commercial HALEU, government surplus materials, and recycled fuel to ensure fleet scalability regardless of specific market constraints.

  • Planning the next isotope facility deployment by iterating on the repeatable model established at Groves, with first isotope revenue expected from the Idaho lab in early 2027.

  • Updated 2026 cash flow guidance reflects a strategic decision to pull forward procurement and interconnection costs to de-risk the critical path for first-of-a-kind projects.

  • Advancing PJM interconnection applications and engineering planning with Kiewit to support the phased build-out of the 1.2 gigawatt Ohio clean energy campus.

Operational Milestones and Financial Adjustments

  • Raised 2026 operating cash use guidance to $120M-$150M and PP&E spend to $400M-$500M to accommodate accelerated procurement and opportunistic fuel purchases.

  • Groves represents the first reactor pilot program facility to achieve criticality on private land, validating the DOE authorization pathway for private developers.

  • The Centrus LOI provides a domestic HALEU supply pathway for up to five Aurora powerhouses, with deliveries expected to commence in 2029.

  • Acquisitions of ARMEC and CEI integrated 30+ years of specialized sodium system and nuclear manufacturing expertise directly into Oklo’s internal supply chain.


Source link

The U.S. lost 23,000 jobs in July, far shy of forecasts for a gain of 80,000

0
The U.S. lost 23,000 jobs in July, far shy of forecasts for a gain of 80,000

The U.S. labor market showed weakness for the second consecutive month in July, possibly giving the Federal Reserve room to hold rates in place despite high inflation.

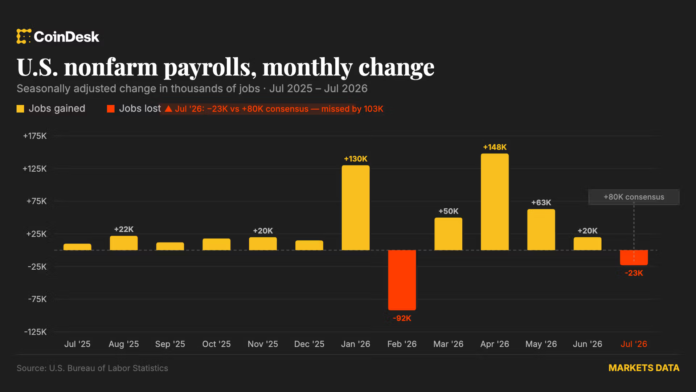
According to the government’s Nonfarm Payrolls Report released Friday morning, the U.S. lost 23,000 jobs last month. That was far below the consensus expectation of a gain of 80,000 jobs, and down from June’s addition of 20,000 (revised down from an originally reported 57,000).

May’s job gains were also revised sizably lower — down to 63,000 from an originally reported 129,000.

The last negative jobs print was in February, when the U.S. lost 156,000 jobs.

The unemployment rate dipped to 4.1%, compared with the expected 4.2% and June’s 4.2%.

Market reaction is swift, with U.S. stock index futures gaining and interest rates dipping. Also moving higher are precious metals, with gold now up 3% for the day and silver up just shy of 6%. There’s little action in crypto, with bitcoin remaining modestly higher on the session at $65,000.


Source link

SpaceX Stock Lands Upgrade, Rocket Lab Surges After Electron Mission

0
SpaceX Stock Lands Upgrade, Rocket Lab Surges After Electron Mission


SpaceX stock vaulted Friday, continuing its Thursday rebound, on an upgrade from Argus. Rocket Lab surged above a key resistance level after completing its 92nd Electron mission, Other space stocks trended higher Friday. Argus on Friday upgraded SpaceX (SPCX) to buy from hold, TheFly reported, following the rocket maker’s Q2 beat from Tuesday. Despite SpaceX forecasting higher-than-expected capital expenditures, primarily…

Copyright ©2026 Investor’s Business Daily, LLC. All rights reserved. 87990cbe856818d5eddac44c7b1cdeb8


Source link

Bitcoin’s fate hinges on 10-month resistance – Break it, and…

0
Bitcoin’s fate hinges on 10-month resistance – Break it, and…


Bitcoin [BTC] continued to struggle as restricted capital inflows kept it near half its October 2025 all-time high.

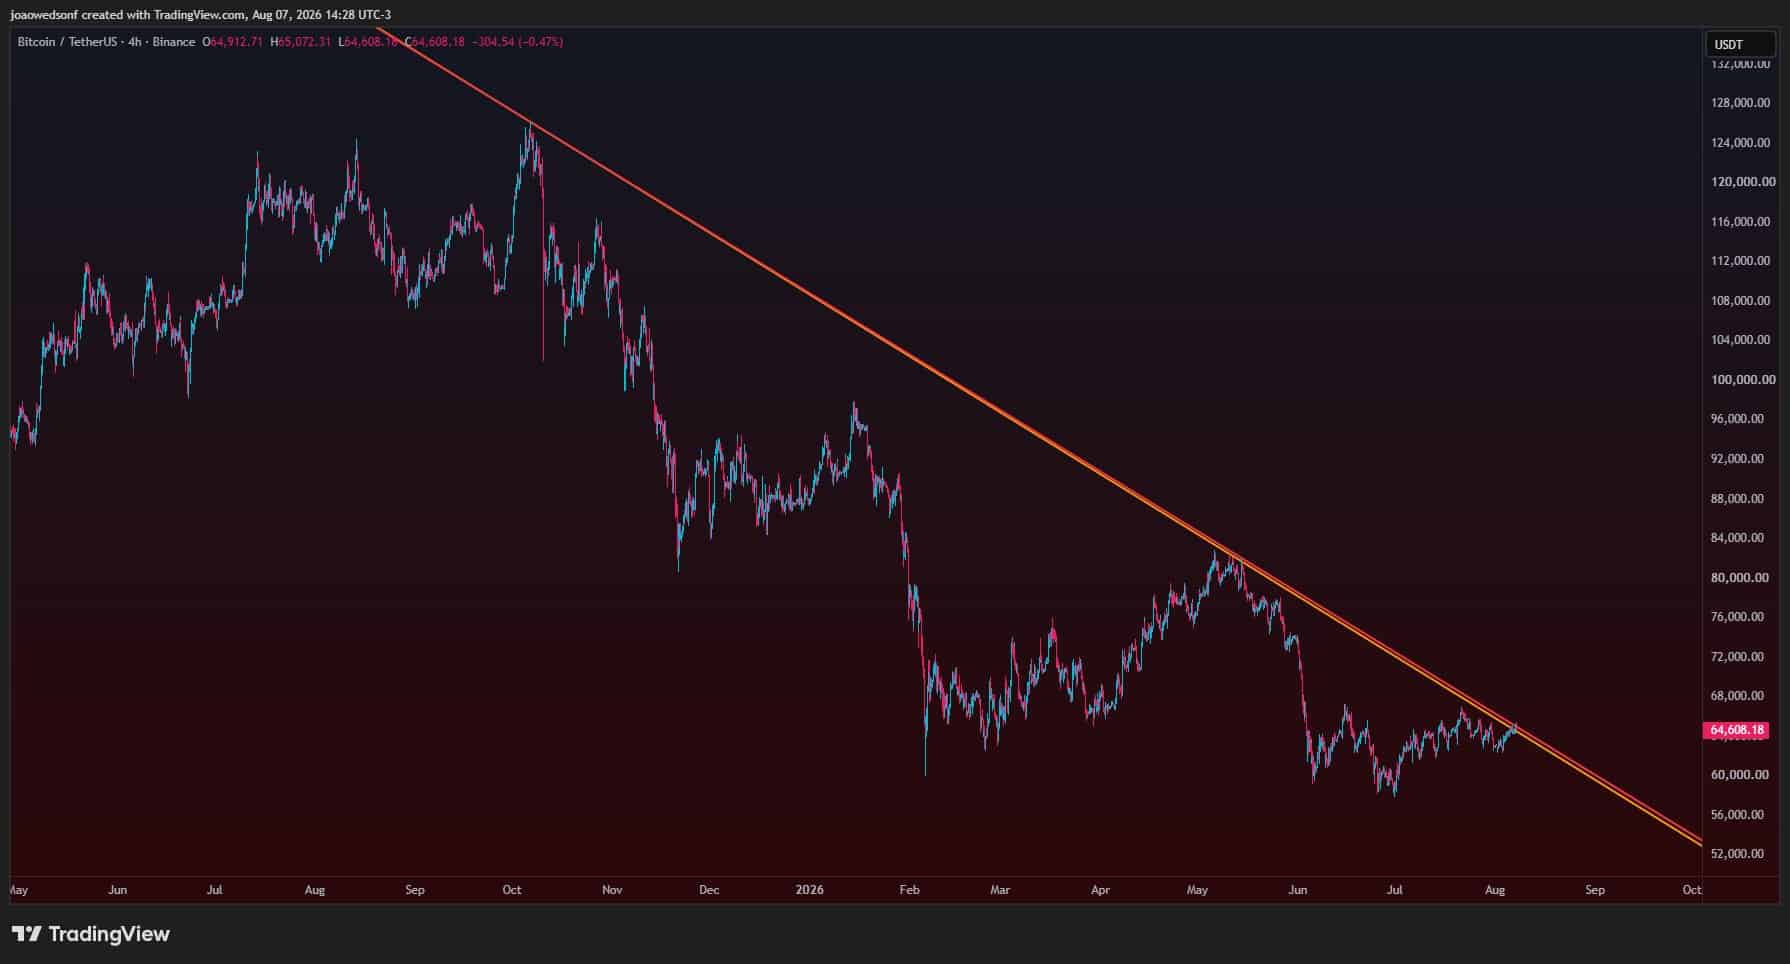
Chart analysis from Alphractal’s Joao Wedson suggested Bitcoin could remain subdued until it cleared a key resistance structure.

Bitcoin price chart.
Source: TradingView/X

Wedson mapped the structure from Bitcoin’s October 2025 peak. The chart tracked a descending path where Bitcoin tested the upper resistance boundary three times across more than ten months.

However, BTC failed to produce a decisive breakout rally.

The formation usually turned bullish after a breakout gained sustained momentum. Bitcoin had yet to deliver such a move. A strong breakout could send Bitcoin back toward the channel’s origin near its October peak.

Can Bitcoin break key resistance?

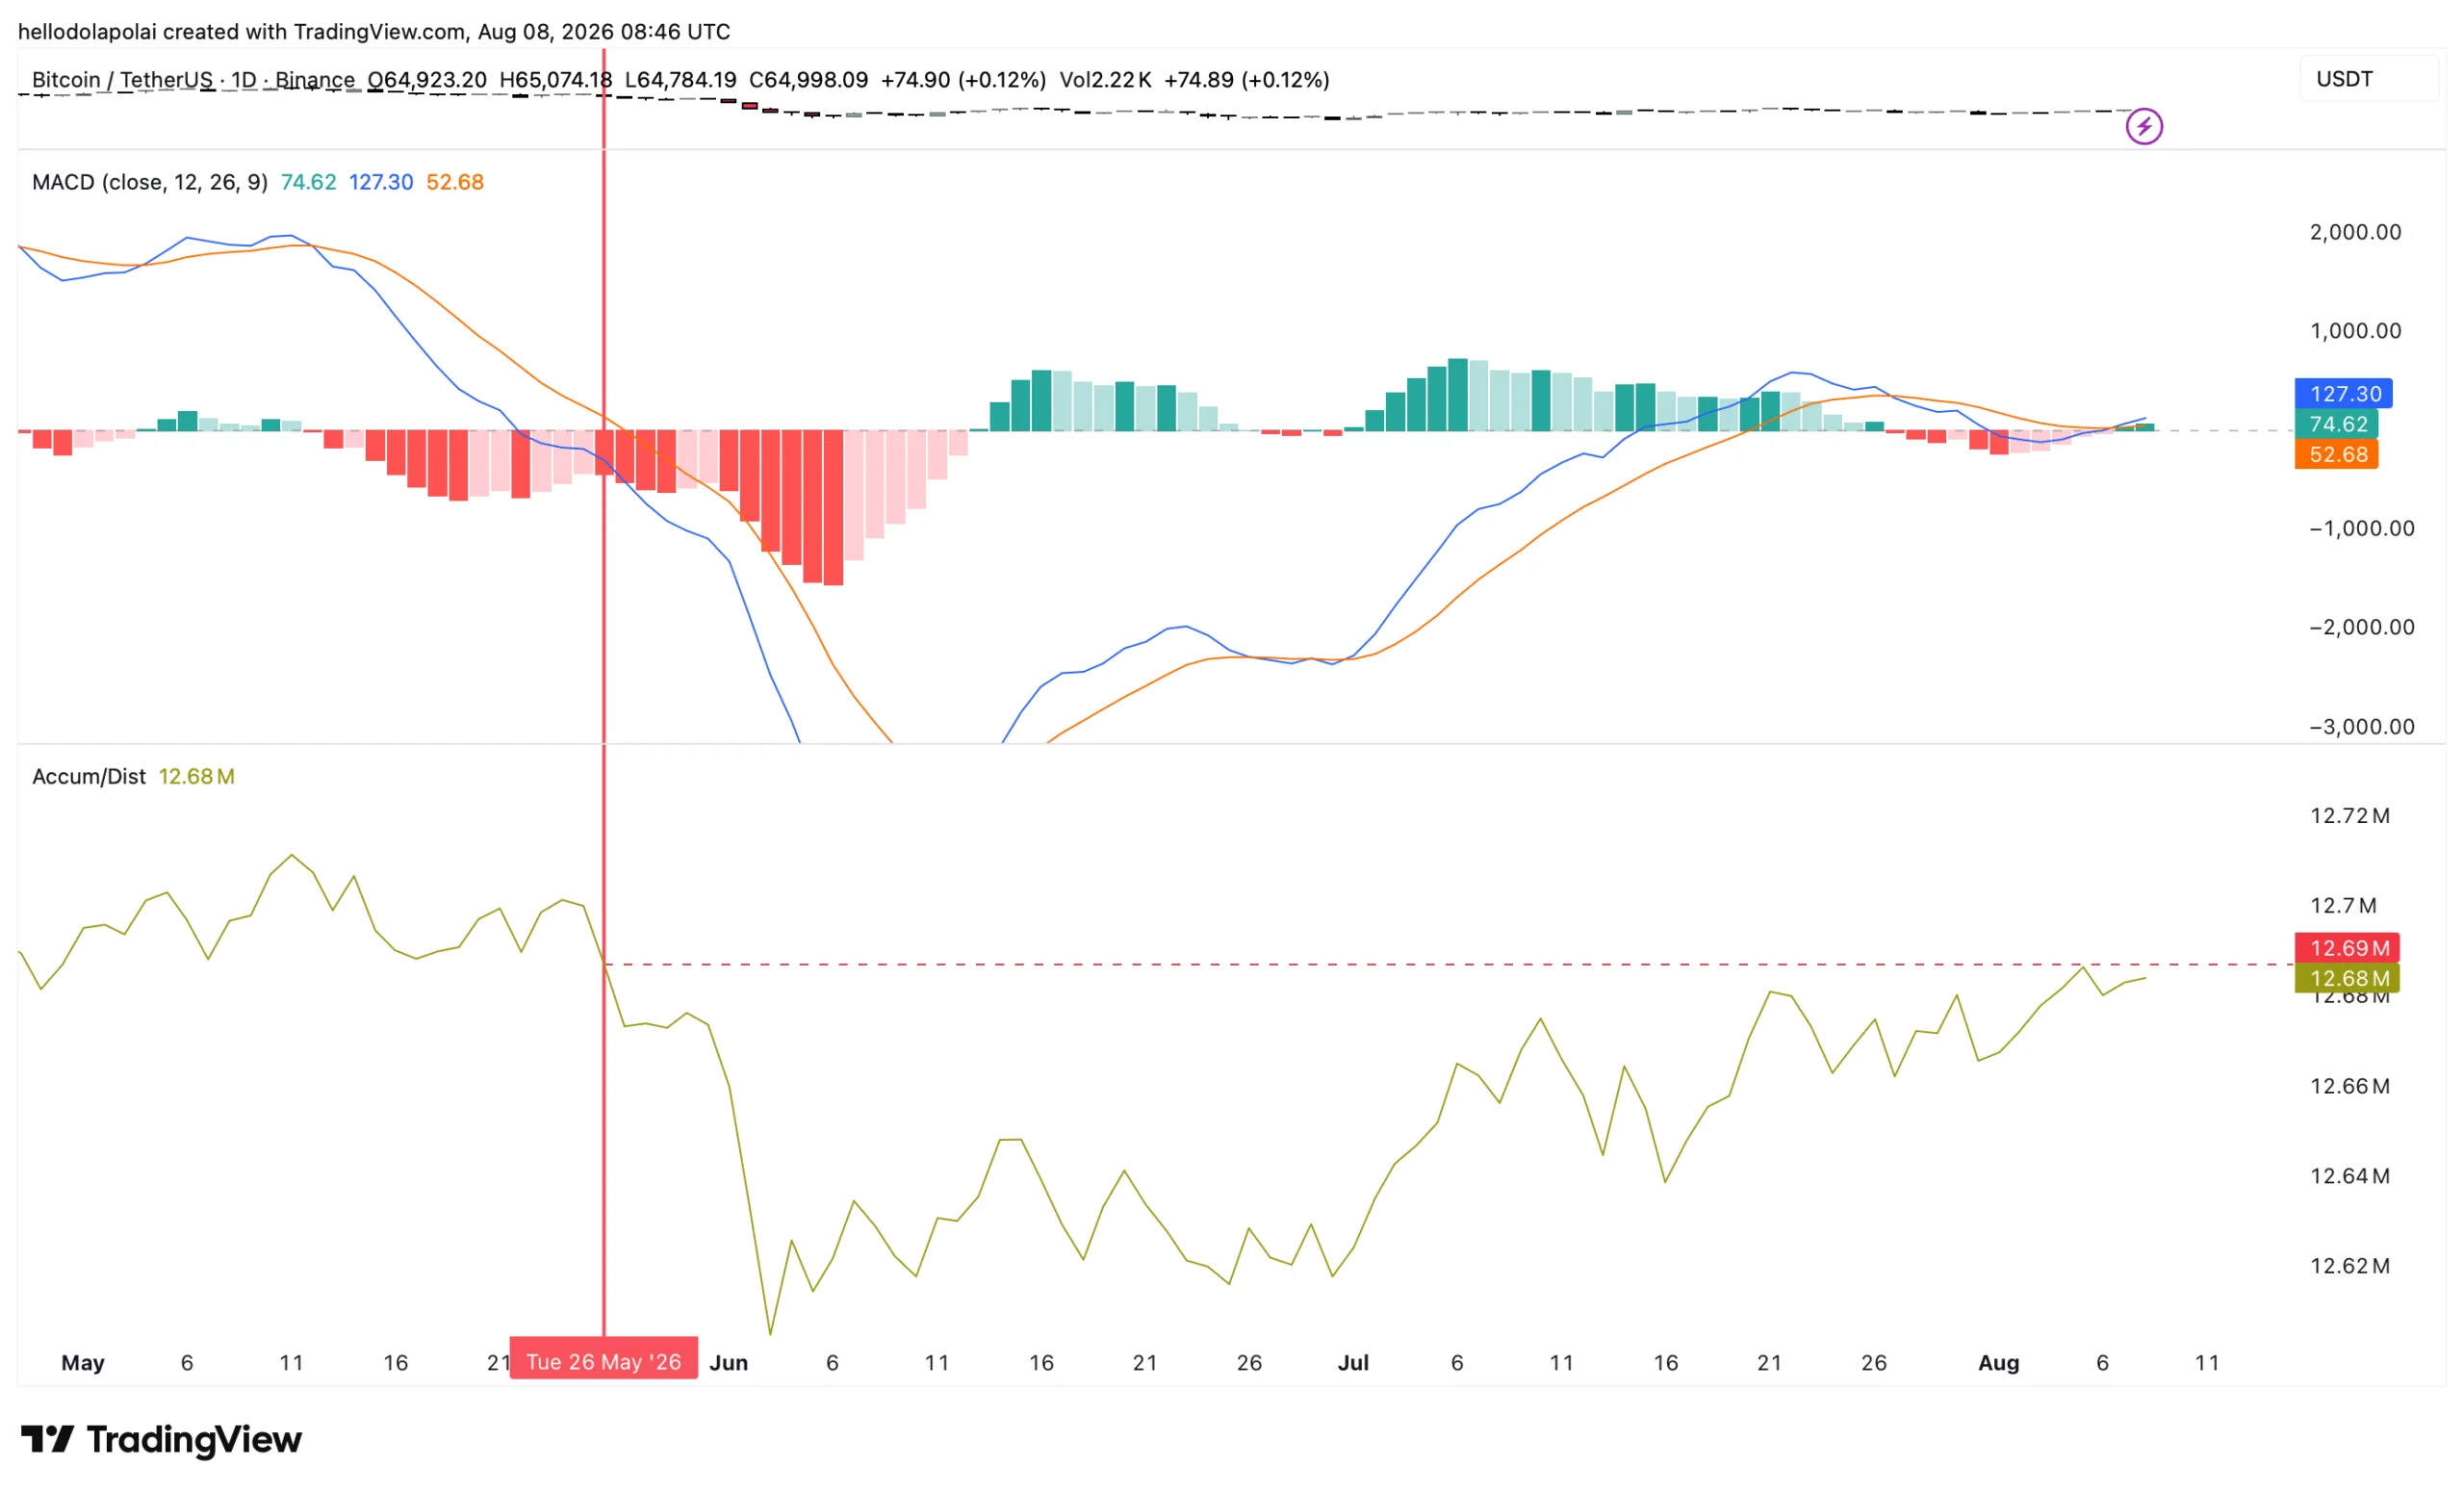
Bitcoin tested the resistance boundary again, and the odds of clearing it appeared to improve. The Moving Average Convergence Divergence (MACD) formed a bullish crossover. Its blue line moved above the orange signal line.

The crossover formed between Thursday and Friday. Such signals often preceded stronger momentum and a move into positive territory.

Bitcoin MACD and A/D indicators. Bitcoin MACD and A/D indicators.
Source: TradingView

At the same time, the Accumulation/Distribution Line showed buyers dominating the market. Buying Volume recently reached its highest level since 26th May.

These signals pointed to a higher probability of Bitcoin clearing resistance and holding a sustained move higher.

Is Bitcoin’s bottom near?

Several on-chain indicators also flagged a higher chance that Bitcoin’s bottom was near.

AMBCrypto’s analysis showed that Bitcoin recently exited the Supply in Profit band’s “bottom discovery” zone.

Bitcoin historically traded in that zone before major rallies. The short-term holder (STH) realized-profit signal added to the case for a potential Bitcoin surge. No outcome was guaranteed. Still, confidence in a market rebound appeared to build.

CoinMarketCap’s 24-hour sentiment reading stood at +2.06. That offered little confirmation as sentiment remained broadly flat.


Final Summary

  • Bitcoin tested a resistance structure that capped BTC rallies for more than ten months.
  • BTC bottom signals strengthened, though flat market sentiment offered limited confirmation of a sustained recovery.


Source link

A part of FTX survived, and it’s the case for the CLARITY Act

0
A part of FTX survived, and it’s the case for the CLARITY Act

So the protections stay what they are: at the federal level not law, but an interpretive notice sorting 16 tokens, a collateral pilot, a few no-action letters, a memorandum of understanding between two federal agencies, any of it revocable without a vote. The rest is left to the states, where investors get real protection in certain states, less elsewhere, and in some states none at all, none of it reaching a market that is national. The last great collapse already showed which protections hold and which give way.

When FTX failed, its offshore exchange misused its customers’ assets for years. But several entities under the FTX umbrella — including LedgerX, a CFTC-regulated exchange and clearinghouse — came through the collapse whole, their customers’ assets segregated and intact. LedgerX survived for one reason: its protections were law. Not a clever mechanism but a plain one, customer segregation a regulator required and checked, which held whether or not anyone chose to honor it once the panic set in. The unregulated part of FTX ran on promises. In one collapse, under one roof, law held and promises broke.

FTX sat offshore for a reason. For years the United States met this industry with enforcement in place of rules, and its capital and talent went where the rules were clear, to Europe, Asia, and the Gulf. The rest went where there was no real oversight, and that is the gap an exchange like FTX grows in. When Washington started to offer clarity, the firms started returning to the U.S: Nexo came back after years away, London’s Wintermute opened a New York office, and Switzerland’s Taurus set up in New York to serve its bank clients. Law protects what it can reach, and the CLARITY Act would make that migration permanent instead of leaving the next firm to choose the dark. It would make the regulated, onshore model the norm for firms such as Bullish, a NYSE-listed digital asset market infrastructure firm (and the parent company of CoinDesk) already regulated in financial centres including Frankfurt, Hong Kong and New York, now pursuing CFTC registration as a designated contract market and derivatives clearing organization.


Source link