Home Blog Page 103

Ripple said to lead $1 billion XRP treasury raise

0
Ripple said to lead $1 billion XRP treasury raise

Ripple Labs is reportedly leading an effort to raise at least $1 billion for a new public-market vehicle that would accumulate XRP, per Bloomberg, testing whether the digital asset treasury trade still works beyond bitcoin.

The raise would be done through a special purpose acquisition company, the report citied to people familiar with the matter. The funds would sit inside a new XRP-focused digital asset treasury, and Ripple is expected to contribute some of its own XRP to the vehicle.

Terms are still under discussion and could change. Ripple did not immediately respond to CoinDesk’s requests for comment or confirmation.

If completed, the deal would be the largest known XRP treasury vehicle to date. XRP is the world’s fifth-largest token, with a market value of about $138 billion. It has gained 13% this year, compared with a 16% rise in bitcoin.

Digital asset treasury companies became one of crypto’s biggest stock-market trades in 2025, as listed firms used SPACs, reverse mergers and equity issuance to buy tokens. The model worked while crypto prices rose and investors paid premiums for balance-sheet exposure.

That trade has weakened, however. Shares of major token accumulators, including Strategy and Metaplanet, have fallen sharply in recent months as crypto prices turned choppy and investors started questioning how many public companies can run the same accumulation play at once.

Ripple’s plan would test whether XRP has enough institutional demand to support a similar structure.

XRP has not drawn the same treasury-company interest as bitcoin. One of the larger examples came in May, when VivoPower announced a $121 million raise to pivot toward XRP investing.

Ripple has its own reasons to back a larger vehicle. The company held 4.74 billion XRP in wallets as of July 31, worth about $11 billion at current prices, according to its website. Another 35.9 billion XRP were locked in on-ledger escrow accounts scheduled for monthly release.

A public XRP treasury company could create a new buyer for the token while giving Ripple another way to place part of its holdings with investors.
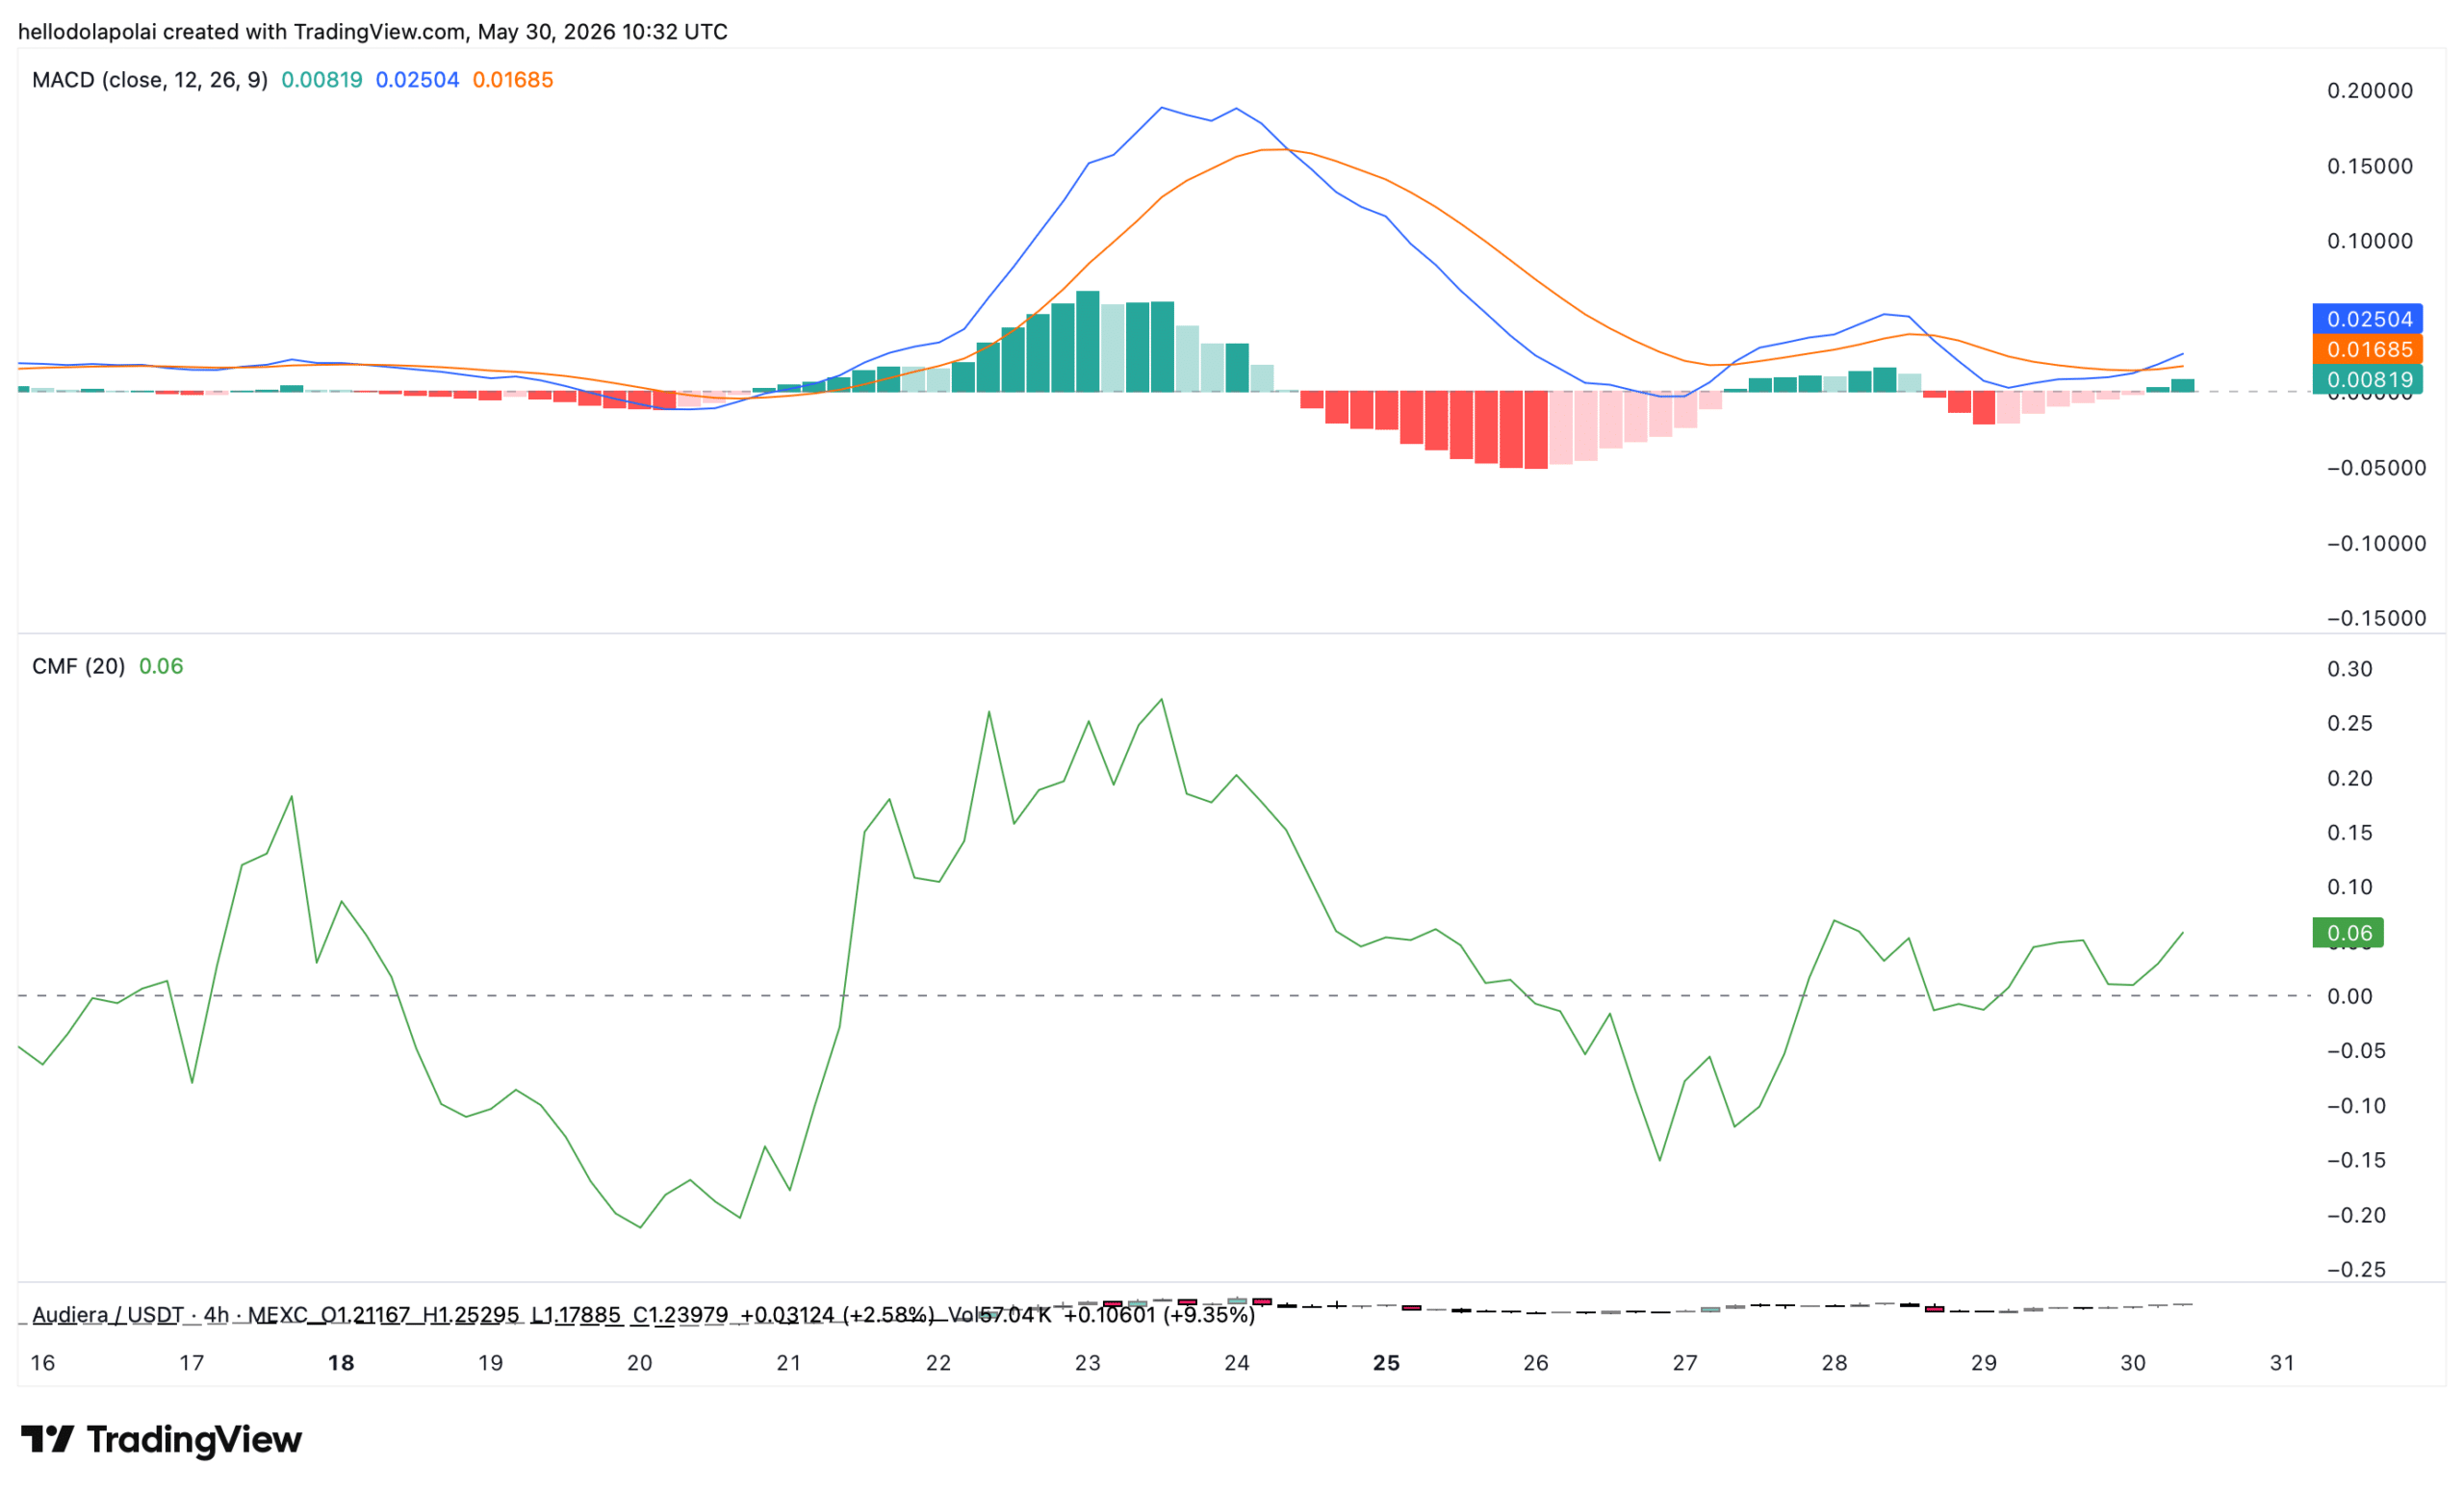


Source link

Why Audiera [BEAT] is THE token to watch out for this weekend

0
Why Audiera [BEAT] is THE token to watch out for this weekend


The cryptocurrency market suffered a significant capital exit over three days between the 26th and the 28th of May, with roughly $169 billion leaving the market.

Relative stability has since returned with minor inflows stepping back in, and select altcoins are positioned to benefit from this shift—BEAT being one of them.

In the past day, Audiera [BEAT] has extended its gains slightly into double-digit territory, reaching 10%, continuing a bullish trajectory that has seen the token accelerate 404% over the past 90 days.

Cup and handle forms within a broader bull flag 

The technical structure for BEAT shows a combination of patterns hinting at a significant move in the coming days. The asset has formed a cup and handle pattern, characterized by price trending downward in a double-hollow fashion that resembles a cup and handle.

This formation has preceded a rally and breakout to the upside on multiple occasions. For the breakout to materialize, price would need to overcome the diagonal resistance lines that have formed on the chart to confirm an upward continuation.

BEAT price chart
Source: TradingView

Viewed on a broader scale, the cup and handle pattern appears to be forming within an overall bull flag—a structure that involves an expansive rally followed by a consolidation phase before another expansive move.

The cup and handle represents the consolidation phase within this larger pattern.

Notably, the Accumulation/Distribution indicator reflects a relative calm in buying pressure for now, moving along a measured range as the asset accumulates without yet sparking a major surge in buy pressure.

This type of quiet accumulation often precedes a more explosive directional move.

MACD Golden Cross forms as CMF holds neutral

The momentum indicators are giving clear signals that a bullish takeover could be building in the BEAT market.

The MACD has formed a Golden Cross pattern, with the MACD line—derived from the difference between the 12-day EMA and 26-day EMA—crossing above the 9-day signal line.

Beat indicators chartBeat indicators chart
Source: TradingView

This formation typically precedes a significant move to the upside, reflecting active buyer participation in the market.

The Chaikin Money Flow adds further context. The CMF has maintained a positive level at the time of writing, having trended on the positive side for days prior.

This signals a balance between buying and selling volume in the market rather than a decisive lean in either direction.

$1.17 million in Spot selling emerges despite price holding

The main concern at this stage is the whale-versus-retail delta, which has turned red and negative, signaling that retail traders are gaining a stronger foothold in the market and are currently on the selling side.

Spot data shows $1.29 million in total selling over the past day, with a net outflow of $230,000 confirming that selling is outpacing buying at the moment.

Source: CoinGlass

For now, this represents a risk to the near-term outlook; the fact that BEAT has held its gains despite this sell pressure points to an underlying demand dynamic that is absorbing the retail exit.


Final Summary

  • BEAT has gained 404% over the past 90 days, with a MACD Golden Cross confirming bullish momentum is building.
  • Retail traders drive $1.17 million in Spot selling, with net outflow at $202,000 despite price holding its gains.


Source link

Wall Street ends higher, crude prices ease on potential US-Iran truce extension

0
Wall Street ends higher, crude prices ease on potential US-Iran truce extension


By Stephen Culp

NEW YORK, May 29 (Reuters) – U.S. stocks followed world shares higher and crude prices retreated on Friday as investors neared the end of a holiday-shortened week with renewed hopes of progress toward a peaceful resolution to the Iran war.

A narrow, tech-led rally lifted all ‌three major U.S. stock indexes to modest gains while benchmark U.S. Treasury yields dipped for a fourth straight session, as markets turned the page on ‌a week and month marked by fears that a fragile truce would collapse amid signs of progress toward a peace deal.

The S&P 500 notched its ninth straight weekly gain, its longest winning streak since ​December 2023.

All three indexes logged monthly advances.

Despite the rally, the indexes were well off session highs by the closing bell.

The United States and Iran agreed to extend their ceasefire and lift shipping restrictions as peace negotiations proceed, sources told Reuters, but U.S. President Donald Trump had yet to approve the deal which, according to Iranian state media, has not yet been finalized.

“This administration watches the markets and they like to do big things when the markets are closed to control the messaging before the market has a ‌chance to react,” said Ross Mayfield, investment strategy analyst at ⁠Baird in Louisville, Kentucky.

“If the memo of understanding is approved by President Trump and we truly get 60 days of the Strait of Hormuz re-opened … I think 60 days should be plenty of time to come to a more substantive agreement,” he added.

The ⁠three-month-long conflict has put upward price pressure on inflation, which threatens to grow less transitory and more established the longer the war drags on.

U.S. Federal Reserve officials are now mulling the possibility of hiking interest rates to counter that growing risk.

“The market has been pricing about a coin flip odds of a hike (in the fourth quarter) for a couple of weeks now,” ​Mayfield ​said. “We’ll have plenty of data by then, but I don’t expect the Fed to do ​much of anything.”

The Dow Jones Industrial Average rose 363.68 points, or ‌0.72%, to 51,032.65, the S&P 500 rose 16.49 points, or 0.22%, to 7,580.12, and the Nasdaq Composite rose 55.15 points, or 0.21%, to 26,972.62.

European shares closed modestly higher and scored gains for the month, which was marked by hopes for a deal that would reopen the Strait of Hormuz. The waterway’s closure has strained the global economy and agitated markets.

MSCI’s gauge of stocks across the globe rose 5.75 points, or 0.51%, to 1,130.47.

The pan-European STOXX 600 index rose 0.14%, while Europe’s broad FTSEurofirst 300 index rose 2.53 points, or 0.10%.

Emerging market stocks rose 25.91 points, or 1.50%, to 1,750.60.

Brent crude oil prices eased as the market awaited confirmation that the United States ‌and Iran have extended their truce.

U.S. crude fell 1.73% to settle at $87.36 per barrel, while ​Brent settled at $92.05 per barrel, down 1.77% on the day.

Treasury yields were lower for the fourth straight ​session, closing out a week in which reported progress in U.S.-Iran peace ​negotiations fueled market optimism.

The yield on benchmark U.S. 10-year notes fell 1.4 basis points to 4.441%, from 4.455% late on Thursday.

The 30-year ‌bond yield fell 0.3 basis point to 4.9817%, from 4.985% late on ​Thursday.

The 2-year note yield, which typically moves ​in step with interest rate expectations for the Federal Reserve, fell 2.9 basis points to 3.996%, from 4.025% late on Thursday.

The dollar dipped in the wake of reports of a U.S.-Iran interim agreement.

The dollar index, which measures the greenback against a basket of currencies including the yen and the euro, fell ​0.1% to 98.90, with the euro up 0.1% at $1.1663.

Against ‌the Japanese yen, the dollar strengthened 0.01% to 159.26.

Gold got a boost from ceasefire optimism but remained on course for a monthly drop.

Spot gold ​rose 1.18% to $4,545.00 an ounce. U.S. gold futures rose 0.98% to $4,543.60 an ounce.

(Reporting by Stephen Culp; Additional reporting by Iain Withers in London ​and Tom Westbrook in Singapore; Editing by Joe Bavier, Nick Zieminski and Edmund Klamann)


Source link

ICE CEO calls Hyperliquid bigger than NASDAQ, says he’s met its founders

0
ICE CEO calls Hyperliquid bigger than NASDAQ, says he's met its founders

Jeffrey Sprecher, the founder and CEO of Intercontinental Exchange (ICE), called the decentralized perpetual futures venue Hyperliquid “bigger than NASDAQ” at a Bernstein conference this week and disclosed his team has met its founders multiple times, a sign that U.S. exchange incumbents are no longer treating crypto-native trading platforms as fringe.

“This Hyperliquid that we’re talking, if you haven’t heard about it, it’s bigger than NASDAQ, okay? It’s 11 people. You look at it, you’re like, wow, that’s pretty something,” Sprecher said in a May 27 fireside chat with Bernstein analyst Chinedu Bolu, calling the team “very, very smart people.”

Hyperliquid’s HYPE token carries a market capitalization of roughly $15.1 billion against Nasdaq Inc.’s $50 billion as of Thursday, so the comparison doesn’t hold by company value.

On daily perpetual futures volume, though, Hyperliquid clears billions of dollars in notional turnover and holds more than 70% of the decentralized perp-DEX market, per industry data.

The “11 people” refers to Hyperliquid Labs, the core development entity, while the broader project draws on open-source contributors and a validator set that runs the underlying Layer-1 blockchain.

Sprecher said ICE took notice partly because Hyperliquid has been trading oil derivatives on weekends when ICE’s traditional energy markets are closed, an activity that surged during the recent stretch of Middle East tensions.

JPMorgan analysts have flagged the same pattern, noting non-crypto traders using Hyperliquid’s 24/7 markets for off-hours oil exposure. “There have been a lot of activity that happens, a lot of decisions and things happen on the weekend. So it’s gotten a lot of interest,” Sprecher said.

Under U.S. law, the perpetual futures Hyperliquid offers are swaps, subject to Title VII of the Dodd-Frank Act, the post-2008 legislation that prescribes reporting, margining and dealer registration. ICE operates under those rules, while Hyperliquid, an unregulated foreign-incorporated venue, does not.

“Why are you prohibiting us from doing this when it’s already happening? And can’t we have a level playing field? And by the way, this stuff is global,” Sprecher said.

He said he expected the next few months to produce clearer answers, with the choice being either a new category of regulated perpetual future or pulling offshore venues into Dodd-Frank and the European Union’s EMIR rules.


Source link

New Oriental Education & Technology (EDU) Net Revenue Climbs 19.8% in FQ3 2026

0
New Oriental Education & Technology (EDU) Net Revenue Climbs 19.8% in FQ3 2026


New Oriental Education & Technology Group Inc. (NYSE:EDU) is one of the best mid cap stocks to buy with highest upside potential. On April 22, New Oriental Education & Technology Group reported strong financial results for FQ3 2026. Total net revenues grew by 19.8% year-over-year to $1.417 billion, while net income attributable to the company rose by 45.3% to $126.8 million. Operating income also saw a significant increase of 44.8%, reaching $180.3 million.

Growth was driven by the expansion of new educational initiatives, including non-academic tutoring and intelligent learning systems, alongside steady performance in domestic and overseas test preparation. Leadership emphasized a focus on operational efficiency, AI integration across the education ecosystem, and the continued development of the East Buy platform. These efforts, combined with cost structure optimizations, resulted in an improved non-GAAP operating margin of 14.3%.

Barrington Raises its Price Target on Universal Technical (UTI) to $42

brooke-cagle-g1Kr4Ozfoac-unsplash

Regarding shareholder returns, the board of directors approved the second installment of a dividend for FY2026, amounting to $0.06 per common share or $0.6 per ADS, payable in June. Additionally, the company continued its share repurchase program, having bought back approximately $184.3 million worth of ADSs as of April 21, out of the authorized $300 million total.

New Oriental Education & Technology Group Inc. (NYSE:EDU) is a Beijing-based provider of private educational services. Founded in 1993, the company operates through four segments, including Educational Services and Test Preparation Courses, and Overseas Study Consulting Services.

While we acknowledge the potential of EDU as an investment, we believe certain AI stocks offer greater upside potential and carry less downside risk. If you’re looking for an extremely undervalued AI stock that also stands to benefit significantly from Trump-era tariffs and the onshoring trend, see our free report on the best short-term AI stock.

READ NEXT: 33 Stocks That Should Double in 3 Years and Cathie Wood 2026 Portfolio: 10 Best Stocks to Buy. 

Disclosure: None. Follow Insider Monkey on Google News.


Source link

DYDX’s next target – Here’s why channel resistance is the final test for traders!

0
DYDX's next target - Here's why channel resistance is the final test for traders!


dYdX [DYDX], the native token of the decentralized trading platform, has landed among the top gaining assets in the market.

In fact, on-chain metrics including trading fees and total value locked have remained largely unchanged according to DefiLlama data, with sentiment staying flat.

The main growth has been driven by off-chain activity. However, at press time, chart analysis revealed that the rally now faces a credible risk of a near-term pullback at a key technical level.

DYDX hits channel resistance

The continuation of DYDX’s northbound rally faced a significant hurdle as the asset hit the upper boundary of the ascending channel pattern it has been trading within.

The channel consists of two parallel upward-trending lines serving as support and resistance respectively, with price oscillating between them in an upward range.

DYDX technical price chart.
Source: TradingView

At press time, DYDX had hit the upper resistance line of this channel, meaning the sell pressure that typically builds at this level could force the asset lower towards the channel support if it holds.

The momentum picture, however, has been constructive.

DYDX overcame a key structural supply zone that previously acted as a major obstacle to price growth. Clearing this level adds weight to the case for a breakout above the channel resistance, rather than a rejection from it.

A/D reaches 40.8 million as MA Ribbon prints a bullish crossover

Market indicators seemed to be supporting the probability of a breakout to the upside, rather than a rejection at resistance.

The Accumulation/Distribution indicator, for instance, highlighted rising accumulation, with total volume hitting 40.8 million in DYDX at the time of writing.

Traders have been actively adding to their positions, and the volume building behind this accumulation lends conviction to the bullish structure forming on the charts.

DYDX indicator chart.DYDX indicator chart.
Source: TradingView

At press time, the Moving Average Ribbon flashed the clearest bullish signal yet. With the 20-day MA sitting above the 50-day, 100-day, and 200-day averages in a bullish crossover formation, the short-term average seemed to be leading the longer-term ones – A configuration that reflected strong and building momentum.

The gap between the 20-day MA and the longer-term averages implied that the upward move might carry meaningful conviction. And, a sustained upswing alongside sustained accumulation would confirm investors are actively contributing to extending the rally.

What are Spot and Perpetual market buyers up to?

Finally, both the Spot and Perpetual markets have been reflecting a strong structural setup for an ongoing bullish move in DYDX.

In fact, Spot market data revealed that traders accumulated $616,640 worth of DYDX over the last four days, reflecting consistent buying interest at press time levels.

DYDX spot netflow chart.DYDX spot netflow chart.
Source: CoinGlass

The Perpetual market seemed to mirror this trend too, with traders expanding leveraged capital to approximately $48.68 million in Open Interest. All while OI-weighted funding data confirmed that long positions accounted for most of this capital.

With both Spot and Perpetual markets holding a bullish position and accumulation building steadily, the conditions for DYDX to push further into an extended upswing might just strengthen.


Final Summary

  • The Moving Average Ribbon revealed a bullish crossover with the 20-day MA leading, while A/D rose to 40.8 million.
  • DYDX has been testing the upper channel resistance as Open Interest climbed to $48.68 million with positive funding.


Source link

Surging Treasury yields show America has no margin for error on its $31 trillion debt

0
Surging Treasury yields show America has no margin for error on its $31 trillion debt

In the days before the Memorial Day weekend, rates on 30 year Treasury bonds hit their highest level in 19 years at 5.2%, and the benchmark 10-year reached 4.7%, the top reading since mid-2007. If those kinds of yields take hold, the scenario for federal interest expense posited in the CBO’s “Budget and Economic Outlook: 2026 to 2036,” released in February, descends from dire to near-disastrous. Takeaway: America’s track to fiscal safety has lost all margin for error, and nothing demonstrates that better than the long-term impact of loftier than expected rates. America’s got so little room to maneuver that even yields that modestly exceed the CBO’s “baseline,” as the numbers compound in the years ahead, deliver a huge extra blow by crowding out big chunks of revenue that would otherwise go towards funding such essentials as Defense, Social Security and Medicare.

The CBO forecasts that yields on the 30 and 10-year Treasuries will respectively average about 4.65% and 4.15% through FY 2036. That’s roughly 55 basis points lower than the multi-year summit briefly notched in late May. Doesn’t sound like much of a difference, right? And if the interest expense on our gigantic and ballooning national debt of $39 trillion weren’t already running at nearly $1 trillion a year, bigger than Medicare spending and equaling two-thirds of Social Security outlays, the half-point upward shift would likely prove manageable.

But a recent report from the non-partisan Committee for a Responsible Federal Budget quantifies the deep damage even a continuation at the recent peaks would inflict. By 2036, interest expense would jump from absorbing 14% of all revenues to devouring 30%, five points more than under the CBO’s forecast. At $2.5 trillion, 2.5x today’s number, the carrying costs would become the second largest budget category, beating Medicare by one-third. Interest cost per household would soar from $7,900 last year to $17,000 a decade hence.

Much of today’s extreme vulnerability to even slightly higher rates arises from the need to both refinance existing debt, and shoulder trillions more in newly-issued bonds to cover deficits, at much higher cost. All told, the federal government will need to borrow almost $10 trillion in the next 12 months, equivalent to one-third our total debt. That amount consists of around $7.5 trillion to repay the Treasuries coming due, and $2 trillion for plugging the shortfall between revenues and spending. A major reason the U.S. accumulated so much debt in the first place was the lure of ultra-bargain yields orchestrated by the Fed’s easy money policy during and following the COVID crisis. In 2021 through early 2022, Treasury Bills, instruments that mature within a year, offered around a minuscule 0.2%. Today, that cost’s 18 times fatter at 3.7%.

Rates have also climbed for the Treasury Notes running 5 to 30 years that account for over half of all federal debt outstanding. Because we could borrow so cheaply for so long, the average rate on the Notes stands at just 3.23%. But the U.S. is refinancing the bonds that roll off for a lot more, 5.2% on the 30 year as of just before Memorial Day, and 4.7% on the 10-year.

In fact, the borrowing blowout that got the U.S. in so much trouble resembles the rush into “teaser” home loans in the 2007 runup to the housing meltdown; folks fell for temporary, super-low “teasers” rates that when they reset higher, saddled the borrowers with monthly payments they couldn’t afford. A similar dynamic’s at play as the U.S. refinances low-yielding Treasuries issued when it looked like a deal to finance huge government spending—at today’s much higher rates.

As of May 26, news that the Iran War may end soon pushed yields for the 30 and 10 year down slightly, so that they’re now sitting around 35 basis points above the CBO forecast. Still, the threat they’ll bounce back to the half-point-plus margin that’s so scary raises a stern warning for the new Fed chief Kevin Warsh. It’s encouraging that Warsh publicly favors tightening monetary policy by lowering the immense holdings of Treasuries on Fed’s balance sheet, a policy that involves unloading a big portion of its portfolio to the public. That gambit transforms trillions that would otherwise be spent into savings.

The Fed balance sheet shrink would also shrink what’s causing the problem: Extremely high “aggregate demand” across the economy that sends too many dollars chasing a volume of goods that’s growing far more slowly. (Noted economist Will Luther described this phenomenon in my recent story.) Warsh can also raise the Fed Funds rate, or even announce he has no plans for a reduction, to cool the still relatively-plentiful credit that’s fueling big spending by consumers and of course, humongous outlays for AI data centers. But the primary reason aggregate demand’s way too high is excessive levels of government spending that if left unchecked, could lead to even higher rates than the peak numbers that just unleashed such a jolt. Warsh can help by lifting the cost of credit to throttle both consumer and corporate spending, and sell bonds the Fed’s holding to target the latter. But he can’t control the big one, the runaway federal budget.

That responsibility falls on the President and on Congress. As the CRFB states in their analysis on the impact of rising yields, “The best way to accomplish these goals is through deficit reduction, which can help the Federal Reserve lower rates by reducing near-term inflationary pressures, put downward pressure on long-term rates by reducing economic crowd-out [that diverts money needed for budget must-pays to interest], and reduce the debt burden on which the government must pay interest.” The CRFB adds that yields that hang in the pre-Memorial Day range or push higher threaten to “spark a fiscal crisis.”

Nothing better illustrates that AMERICA IS BROKE than how an increase in yields that wouldn’t seem to matter much in most times could spell a cataclysm now that our fiscal state’s so fragile. Neither party wants to talk about how broke we really are, or do much to address the problem. Unfortunately, it may take an outbreak of unaffordable interest rates to force our lawmakers into facing the peril of their own making.


Source link