Bitcoin is likely to stay range-bound, said Jeff Ko, chief analyst at CoinEx, and he points to three reasons the backdrop has calmed.
Oil has retreated from last week’s highs after another pause in U.S.-Iran hostilities. The 10-year Treasury yield, approaching 4.7%, is doing part of the Fed’s tightening work on its own. And the Fed may want to keep its options open ahead of this week’s PCE inflation and second-quarter GDP data.
The bigger swing factor is corporate. Apple, Microsoft, Meta and Amazon all report this week, and Ko said their free cash flow and AI-spending guidance could move Treasury yields and the Nasdaq, indirectly shaping the liquidity that flows into crypto.
Ko added that the composition of ETF flows will matter as much as the headline numbers.
After another frenetic week in the markets, investors are preparing on Monday to step into a new five-day stretch that might get even busier, with a ream of Big Tech earnings, a Fed decision, and rapidly worsening conditions in the Middle East all front and center.
The S&P 500 (^GSPC) closed out Friday 0.1% in the green, for a loss of 0.6% on the week. The Dow (^DJI) gained 0.6% on Friday to close the week 0.4% down, while the Nasdaq (^IXIC) slid 0.6% on Friday, for a weekly loss of 2.1%.
Earnings from four of the “Magnificent Seven” Big Tech leaders headline the week: Microsoft (MSFT) and Meta (META) on Wednesday, then Apple (AAPL) and Amazon.com (AMZN) on Thursday.
As was true for earnings last week from Alphabet and Tesla, there’s one big question looming over the Magnificent Seven’s second quarter reports: How much are you spending, and, crucially, what are you getting for it? Can you show real return on investment?
But it’s not all about the Magnificent Seven as investors step into the busiest week of the quarter.
AstraZeneca (AZN, AZN.L) results kicks things off on Monday, followed by reports from SK Hynix (SKHY) (the company’s first since listing in the US), Visa (V), Coca-Cola (KO), and Boeing (BA) on Tuesday.
Lam Research (LRCX), General Dynamics (GD), Qualcomm (QCOM), and Starbucks (SBUX) follow on Wednesday, before Mastercard (MA), Shell (SHEL), and Anheuser-Busch (BUD) on Thursday. Rounding out the week on Friday are the US energy giants, ExxonMobil (XOM) and Chevron (CVX), alongside pharmaceutical giant AbbVie (ABBV) and power stalwart Eaton (ETN).
Pulling attention away from the corporate world for a brief few hours on Wednesday will be the Federal Reserve’s June rate decision. Though the committee is widely expected to hold rates steady, with markets betting on a hike to come in the fall, recent escalations in the Middle East have made the meeting look more lively than it did last week.
The final major storyline for investors to follow are developments in the Middle East, where attacks in the Red Sea by the Houthis last week sent oil prices (BZ=F, CL=F) soaring past $100. Crude futures sank on Monday after the US and Iran paused hostilities over the weeken. But with no diplomatic solution in sight, inflationary pressures are likely to once again begin capturing significant attention.
Google’s disappointment sets a nervous stage for the rest of Big Tech
If there’s any kind of preview for the Big Tech earnings bonanza awaiting investors this week, it’s the aftermath of Alphabet’s (GOOG, GOOGL) second quarter report just days ago.
Revenue and profit beat expectations. Margins were solid. Google Cloud growth accelerated sharply, by roughly 82% year on year. Search growth was resilient despite competition from the likes of OpenAI’s (OPAI.PVT) ChatGPT and Anthropic’s (ANTH.PVT) Claude.
But management announced sharply higher capex projections for 2026, now estimated to land around $200 billion. Free cash flow fell negative for the first time ever since Alphabet has been a public company. The stock sold off.
It’s not enough now to just say, “We’re spending more,” Apollo Global’s Torsten Sløk wrote. Investors want to see the whole picture. As Sløk put it, “Are capex investments, earnings growth and returns accelerating or stalling?”
(Disclosure: Yahoo is a portfolio company of funds managed by affiliates of Apollo Global Management.)
Take Microsoft (MSFT), for example. The bear case for the stock, Deutsche Bank analysts led by Brad Zelnick wrote, revolves around three main factors.
Rising component prices, namely memory from the likes of Micron (MU), are forcing spending higher to meet deployment goals. That dynamic is raising persistent doubts about “underlying returns on ballooning investments the company is making across its AI platform.” And, not unique to Microsoft, the company is increasingly exposed to a “concentrated backlog exposure to OpenAI.”
The result, the analysts wrote, is likely to be similar to Alphabet’s numbers. Deutsche Bank is forecasting that management will raise 2026 capex projections to $238 billion from $215 billion previously, with free cash flow forecast to break even.
Scrutiny on these investments is “understandable,” the analysts admitted, as just a few years ago, free cash flow was over $70 billion. But fears may be overblown on each of those fronts for Microsoft — and potentially for the Magnificent Seven as a whole.
“The idea that Microsoft has limited to no recourse to offset these over the coming quarters seems overly pessimistic to us,” the Deutsche Bank analysts said.
Microsoft CEO Satya Nadella delivers the keynote address at Build, the company’s annual conference for software developers, in Seattle in May 2019. (AP Photo/Elaine Thompson) ·ASSOCIATED PRESS
People are literally asking for the Fed to hike
The Fed is expected to hold this week following its meeting. Recent data has looked good.
The labor market seems to be doing well, as the monthly jobs reports show steady growth above baseline and this past week’s initial jobless claims numbers fell to their lowest level since 1969, per Capital.com analyst Daniela Hathorn. On the inflation side of the mandate, recent CPI and PPI reports both showed month-on-month declines, though year-on-year increases remain well above target.
But the threat of an energy crisis is reigniting once more after two weeks of constant conflict between the US and Iran, new threats in the Red Sea from the Houthis, and no signs of any momentum toward another diplomatic solution, regardless of what futures pricing implies.
The labor market strength gives the Fed the flexibility to hike interest rates, if it needs to, Hathorn wrote. And, she added, “data suggests markets may have been too optimistic in pricing a rapid shift towards easier monetary policy.”
This is the feeling we get from recent chatter.
Here’s one: In a LinkedIn post that went viral in economics circles, Federal Reserve Bank of Cleveland president Beth Hammack said business leaders have been asking her to do something about inflation. Typically, that would mean restrictive monetary policy, which runs the risk of curtailing economic growth.
“For the first time in my tenure, I’m hearing from businesses who say they think we need to take action to curb inflation, and from consumers who can’t make ends meet about a growing sense of despair,” Hammack wrote. “What I’m hearing from those conversations is that inflation isn’t coming from only one source—it’s broad based.”
As of Friday morning, the market is fully pricing one interest rate hike in September, with a second by March, per Bloomberg data. As the thinking goes on Wall Street, the Fed never delivers single hikes or cuts. If there is a hike this year, it’s likely to signal a deeper shift toward tighter fiscal policy as Chairman Kevin Warsh directs all of the Fed’s effort toward taming inflation.
Federal Reserve Chairman Kevin Warsh testifies before the Senate Banking, Housing, and Urban Affairs Committee to deliver the semiannual monetary policy report to Congress on July 15 in Washington, D.C. (AP Photo/Jose Luis Magana) ·AP Photo/Jose Luis Magana
Everything is going wrong for oil markets
War risk has properly returned, and the second wave of the US-Iran conflict is still overshadowing markets as a long-term solution shows no sign of arriving, despite the pause in attacks over the weekend.
For global oil markets, already in a precarious situation, critical logistical nodes just keep getting thwarted. Oil prices have started rebounding in return, reaching levels not seen since the first weeks of June before the signing of the US-Iran memorandum of understanding, as Brent futures (BZ=F) crossed $100 per barrel on Thursday.
“If a ceasefire does not materialize,” Rystad Energy head of geopolitical analysis Jorge León said, “the risk of a significant rebound in oil prices would be substantial.”
The strait is still constricted, and Russia’s refineries are buckling under the weight of bombardment by the Ukrainian military.
Last week, a new threat emerged: another war front on the Red Sea across Saudi Arabia, where the Houthis, an Iran-backed militant group based in Yemen, attacked two Saudi Arabian vessels on Wednesday.
If the Houthis successfully cut off the Bab el-Mandeb Strait, which connects the Red Sea to the Gulf of Aden and has seen roughly 9 million barrels per day of oil flows over the past month, the market could lose up to half of the oil currently exiting the Persian Gulf.
“Any disruption at Bab el-Mandeb would therefore threaten not only Saudi shipments but one of the few remaining routes capable of compensating for the severe reduction in Hormuz traffic,” Rystad’s León said.
This has all created a difficult problem for the market: Even where barrels remain available, fewer routes exist to move them, fewer refineries have room to process them, and fewer emergency buffers remain available to absorb another prolonged outage as new threats emerge.
Children wade in the water with cargo ships at anchor in the background and a fisherman nearby, in the Strait of Hormuz off Bandar Abbas, Iran, on June 30. (Amirhosein Khorgooi/ISNA via AP) ·AP Photo/Amirhosein Khorgooi
Economic and earnings calendar
Monday
Economic data: Durable goods orders, June preliminary reading (+1.5% expected, -4.5% previously); Dallas Fed manufacturing activity, July (0.0 previously).
Economic data: ADP weekly employment change, week ended July 11 (+16,500 previously); Retail inventories, month-on-month, June (+0.6% previously); Wholesale inventories, month-on-month, June preliminary reading (+0.1% previously); FHFA housing price index, month-on-month, May (-0.1% previously); Richmond Fed manufacturing index, July (4 previously); Richmond Fed business conditions, July (-9 previously); Conference Board consumer confidence, July (92 expected, 91.2 previously); Conference Board present situation, July (116.4 previously); Conference Board expectations, July (74.4 previously); Dallas Fed services activity, July (2.9 previously).
Earnings calendar: SK Hynix (SKHY), Visa (V), Coca-Cola (KO), KLA Corporation (KLAC), Seagate Technology Holdings (STX), Boeing (BA), Rio Tinto (RIO), Corning (GLW), Unilever (UL), S&P Global (SPGI), GSK (GSK), UPS (UPS), Waste Management (WM), Barclays (BARC.L), American Tower Corporation (AMT), Sherwin-Williams (SHW), Royal Caribbean Cruises (RCL), Hilton Worldwide Holdings (HLT), NXP Semiconductors (NXPI), Bloom Energy (BE), Teradyne (TER), Ford (F), Electronic Arts (EA), PayPal (PYPL), Centene Corporation (CNC), DTE Energy Company (DTE), CenterPoint Energy (CNP), Expand Energy Corporation (EXE).
Wednesday
Economic data: FOMC rate decision; MBA mortgage applications, week ended July 24 (+1.9% previously).
Earnings calendar: Microsoft (MSFT), Meta Platforms (META), Lam Research (LRCX), Procter & Gamble (PG), Arm Holdings (ARM), Amphenol Corporation (APH), QUALCOMM (QCOM), UBS Group AG (UBS), Starbucks (SBUX), Vertiv Holdings (VRT), Fortinet (FTNT), General Dynamics (GD), Equinix (EQIX), Automatic Data Processing (ADP), Robinhood Markets (HOOD), Eni S.p.A. (ENI.MI), Agnico Eagles Mines (GDX), Deutsche Bank (DB), Boston Scientific Corporation (BSX), Cenovus Energy (CVE), L3Harris Technologies (LHX), Public Storage (PSA), Entergy Corporation (ETR), Old Dominion Freight Line (ODFL), Humana (HUM), Garmin (GRMN), Carvana (CVNA), Chipotle Mexican Grill (CMG), CBRE Group (CBRE), Teva Pharmaceutical Industries (TEVA).
Thursday
Economic data: Personal income, June (+0.3% expected, +0.7% previously); Personal spending, June (+0.4% expected, +0.7% previously); PCE price index, month-on-month, June (-0.1% expected, +0.4% previously); PCE price index, year-on-year, June (+3.6% expected, +4.1% previously); Core PCE price index, month-on-month, June (+0.1% expected, +0.3% previously); Core PCE price index, year-on-year, June (+3.3% expected, +3.4% previously); Initial jobless claims, week ended July 25 (187,000 previously); Continuing claims, week ended July 18 (1.796 million previously); GDP annualized, quarter-on-quarter, second quarter (+2.3% expected, +2.1% previously).
Earnings calendar: Apple (AAPL), Amazon.com (AMZN), Mastercard (MA), Shell (SHEL), Anheuser-Busch InBev (BUD), Mizuho Financial Group (MFG), British American Tobacco (BATS.L), Bristol-Myers Squibb (BMY), Stryker Corporation (SYK), Altria Group (MO), The Southern Company (SO), Valero Energy Corporation (VLO), Lloyds Banking Group (LYG), KKR (KKR), Intercontinental Exchange (ICE), The Cigna Group (CI), American Electric Power Company (AEP), Monolithic Power Systems (MPWR), Regeneron Pharmaceuticals (REGN), Ferrari N.V. (RACE), Yum! Brands (YUM), The Hershey Company (HSY), Strategy (MSTR), Roblox Corporation (RBLX).
Friday
Economic data: MNI Chicago PMI, July (56.7 previously); U. Mich. sentiment, July final reading (54.4 previously); U. Mich. current conditions, July final reading (54.9 previously); U. Mich. expectations, July final reading (54 previously); U. Mich. 1-year inflation, July final reading (+4.2% previously); U. Mich. 5-10 year inflation, July final reading (+3.3% previously).
Earnings calendar: ExxonMobil (XOM), Chevron (CVX), AbbVie (ABBV), Linde (LIN), Eaton Corporation (ETN), Sony Group (SONY), Colgate-Palmolive (CL), Imperial Oil (IMO.TO), Dominion Energy (D), Cameco Corporation (CCJ), Cboe Global Markets (CBOE), Fortis (FTS), Ares Management Corporation (ARES), T. Rowe Price Group (TROW), Moderna (MRNA), AutoNation (AN).
Investors were bullish on Sunday evening as the U.S. and Iran continued to halt their attacks on each other, providing space for negotiations that could reopen the Strait of Hormuz.
Meanwhile, Wall Street is also looking ahead to a busy week of tech earnings and the Federal Reserve’s policy meeting.
Futures tied to the Dow Jones industrial average surged 337 points, or 0.65%. S&P 500 futures jumped 0.80%, but Nasdaq futures shot up 1.28%.
South Korea’s Kospi index, which has been a bellwether for global stocks lately, climbed 74 points, or 1.1%, as chip heavyweights SK Hynix and Samsung reached new deals.
U.S. oil prices tumbled 5.44% to $84.45 a barrel, and Brent crude dived 5.25% to $91.70. Gold rose 1.15% to $4,118 per ounce.
President Donald Trump and Iranian officials have said both sides are actively engaged in diplomacy after nearly two weeks of daily bombardment.
The U.S. and Iran’s neighbors are unlikely to accept any arrangement that recognizes Tehran’s control over the narrow waterway. But Trump is also running out of options to ease strains in the oil market, which is headed for a crisis as inventories hit critically low levels.
Meanwhile, the U.S. has surged more troops and aircraft the Mideast in case Trump wants to resume major combat operations. But 40 days of all-out war and 13 days of limited strikes failed to reopen the Strait of Hormuz.
Sources told Axios that U.S. Central Command chief Adm. Brad Cooper recommended stopping the recent bombing campaignbecause it has reached the limit of its effectiveness.
The New York Times also reported that Gen. Dan Caine, chairman of the Joint Chiefs of Staff, privately warned that restarting major combat operations was doable but that Iran’s retaliation would force Central Command to deplete its stockpile of interceptors to dangerous lows.
It’s a stark turnaround from a week ago, when Iranian attacks killed U.S. troops in Jordan, crossing Trump’s red line for resuming full-blown war. Reports last week said he had lost patience with the Islamic Republic and was in “revenge mode.” Then he ordered the pause on Friday.
While the U.S. now seems more constrained, Ukraine’s strike on an Iranian supply ship in the Caspian Sea has suddenly expanded the map, raising speculation that it could be used as leverage in U.S.-Iran talks.
Any progress in reopening the Strait of Hormuz should further lower oil prices just as the Federal Reserve has sounded more hawkish on fighting inflation.
Risk-on peace trades are back in vogue after the U.S. and Iran held fire on Sunday, sending oil prices lower.
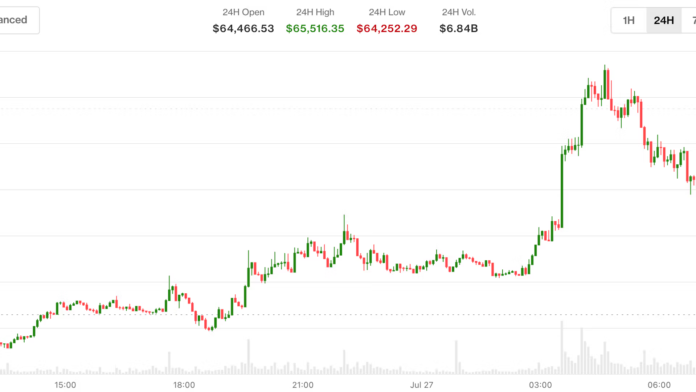
Bitcoin BTC$64,395.15, the leading cryptocurrency by market value, is back above $65,000, with prices up about 1.2% over 24 hours. Ether (ETH) has risen by over 3% to nearly $1,950 alongside 1% to 2% gains in other top 10 token, including solana (SOL) and XRP (XRP).
Futures tied to WTI gapped lower on Monday, trading around 5% lower at $85 as of this writing, while those linked to Nasdaq and S&P 500 traded half a percent higher. Currency markets also showed risk-on trends, with the Aussie dollar and euro gaining against the U.S. dollar.
The United States and Iran paused military strikes against each other for a second consecutive day, creating room for a diplomatic breakthrough. The war, which began in late February, entered a fragile ceasefire in the second quarter, but it quickly unraveled.
Iran reportedly said that it would continue to halt airstrikes as long as the U.S. did the same, marking a tenous start of what appears to be yet another peace process.
The frontier of transportation is shifting from terrestrial roads to the skies and beyond. Investors looking for high growth often weigh Archer Aviation Inc (NYSE:ACHR) against Intuitive Machines Inc (NASDAQ:LUNR) to capture this next industrial wave.
Archer is pioneering electric vertical takeoff and landing aircraft for urban air mobility. Intuitive Machines focuses on lunar landers and space infrastructure. Both operate in highly technical fields with long development timelines, making them speculative but potentially rewarding options for those watching the evolution of flight and exploration.
The case for Archer Aviation
Archer builds electric vertical takeoff and landing aircraft for urban air mobility and plans to operate its own air-taxi networks. It is a high-profile player among industrial stocks moving toward electrification. Partners like United Airlines (NASDAQ:UAL) have placed conditional orders, though such customer concentration adds a layer of risk to the business.
For fiscal year 2025, Archer Aviation reported revenue of just $300,000. This early-stage revenue was accompanied by a net loss of approximately $618.2 million. This reflects a company still in its pre-commercial phase as it pursues aircraft type and production certification.
As of its December 2025 balance sheet, the debt-to-equity ratio was roughly 0.1x. This ratio measures total debt, including short- and long-term obligations, against shareholders’ equity, with a lower number indicating less reliance on borrowed money. Free cash flow was negative at $511.7 million, representing the cash remaining after operating and capital spending are covered.
The case for Intuitive Machines
Intuitive Machines provides lunar landers, spacecraft, and orbital network infrastructure for government and commercial clients. Its primary customer remains NASA, which utilizes its services for the Artemis program and data relay networks. The company also serves defense customers and recently expanded its satellite manufacturing capabilities through the acquisition of Lanteris.
In FY 2025, revenue reached approximately $210.1 million, which was a decrease from previous years (sales were $228 million in 2024). The company reported a net loss of nearly $83.3 million during this time, much narroweerr than 2024’s net loss of $284 million.
As of the December 2025 balance sheet, the debt-to-equity ratio is roughly -0.5x, meaning total liabilities exceed shareholder equity. Free cash flow for FY 2025 was approximately negative $56 million, which represents the cash remaining after paying for operations and capital assets.
Risk profile comparison
Archer faces high dependence on regulatory certification for its Midnight aircraft, and any delays from the FAA would severely impede commercialization. The company has a history of operating losses and will likely need more capital, which could be difficult if market conditions sour. There is also intense competition in the air-taxi market from rivals such as Joby Aviation (NYSE:JOBY)and eHang Holdings (NASDAQ:EH)
Intuitive Machines is highly sensitive to government budget cycles, particularly funding for NASA and the Department of Defense. The integration of recent acquisitions also poses execution risks for the management team as it scales operations. Furthermore, spaceflight remains inherently risky, and a single launch failure or satellite defect could cause significant financial and reputational damage.
Valuation comparison
Archer Aviation carries a much higher P/S ratio given that it is earlier in its development. Neither has a Forward P/E for 2026 because neither business is expected to turn a profit.
Valuation metrics sourced from Financial Modeling Prep (FMP) and may differ from other data providers.
Which stock would I buy in 2026?
The federal government created a framework in 2025 for real-world testing of eVTOL aircraft, a concrete step toward making Archer’s vision a reality. Other countries, including Japan, South Korea, and Saudi Arabia, are developing similar regulatory frameworks. A lot still has to happen for Archer’s aircraft to get into the skies, but the notion that the nation’s airspace is being regulated in a way that is holding back growth is one that has found favor among U.S. leadership.
Archer is taking steps to refurbish a small Los Angeles airport, Hawthorne, for use as its testing grounds and is working to scale up its manufacturing capabilities to eventually reach capacity for 50 planes a year. Execuitves at the business have an initial plan to focus on military and cargo uses for its plane, which would be an easier path to early revenue. Future estimates are speculative, but Wall Street analysts see Archer turning its first profit in 2030, with $2.3 billion in revenue, but a lot has to go right between now and then.
The major card Archer is holding is the purchase agreement with United Airlines to serve as taxis, extending the airline’s services. The contract isn’t guaranteed to be executed in full, however.
Intuitive Machines, meanwhile, are in one of the hottest newly emerging sectors, space. Intuitive Machines started its fiscal 2026 with the strongest quarter in its history, delivering record revenue of $187 million. Management says they have an order backlog of $1.1 billion, including $400 recent bookings in early 2026. NASA is moving toward a steady access to space flights and deliveries, too, which bodes well for the company’s longer-term sales. Revenue for fiscal 2026 is seen more than quadrupling to $952 million, with a narrower net loss of $66 million. Analysts expect the business to turn its first profit in 2028.
Each of these companies is an exciting pioneer in a new form of flight. Intuitive Machines seems to be stepping into its own this year with a spike in revenue, while Archer still has to see itself through its proving ground. For 2026, go with Intuitive Machines.
Should you buy stock in Archer Aviation right now?
Before you buy stock in Archer Aviation, consider this:
The Motley Fool Stock Advisor analyst team just identified what they believe are the 10 best stocks for investors to buy now… and Archer Aviation wasn’t one of them. The 10 stocks that made the cut are built for long-term growth and could produce monster returns in the coming years.
Consider when Netflix made this list on December 17, 2004… if you invested $1,000 at the time of our recommendation, you’d have $377,990!* Or when Nvidia made this list on April 15, 2005… if you invested $1,000 at the time of our recommendation, you’d have $1,269,518!*
That performance is why people listen. With a track record of beating the S&P 500 by 4x, Stock Advisor offers a distinct advantage. Don’t miss the latest top 10 list, available with Stock Advisor, and join an investing community built for the long haul.
Brendan Coffey has no position in any of the stocks mentioned. The Motley Fool has positions in and recommends Intuitive Machines. The Motley Fool has a disclosure policy.
Memecoins have experienced strong downward pressure amid extended weakness across the market.
However, in the last 24 hours, the memecoin market cap rose 8% to $23 billion, while trading volume rose 77% to $2.85 billion.
Amid this sector-wide trend reversal, MemeCore [M] also rebounded, successfully holding $1.1 and climbing to a local high of 1.329.
As of this writing, MemeCore was trading around $1.32, after rising by 11.2% on the daily charts. However, its trading volume dropped by 13%, suggesting that market participation is yet to recover.
MemeCore demand recovers amid sector-wide capital rotation
As the sector-wide momentum shifted, M traders also rushed to position themselves, fearing they would miss out.
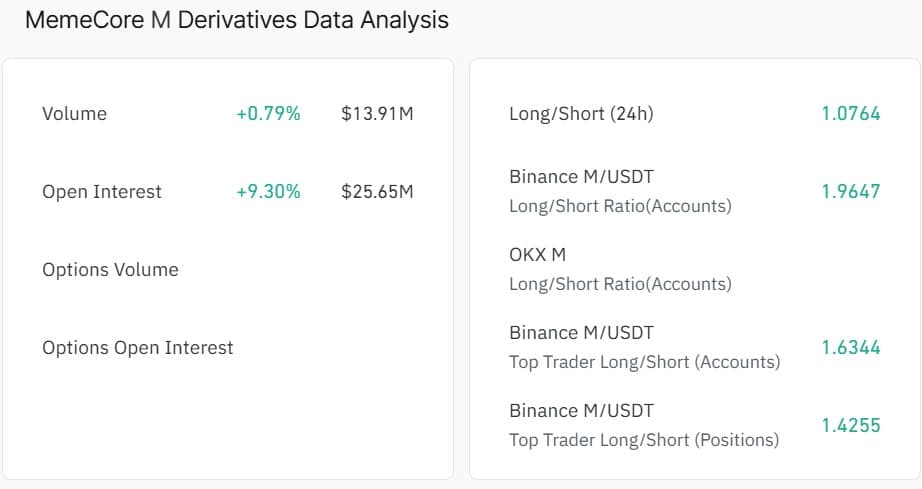
As a result, the memecoin’s Open Interest climbed by 9.4% to $25.66 million. Such a jump in OI suggested increased participation as traders opened new positions.
Source: CoinGlass
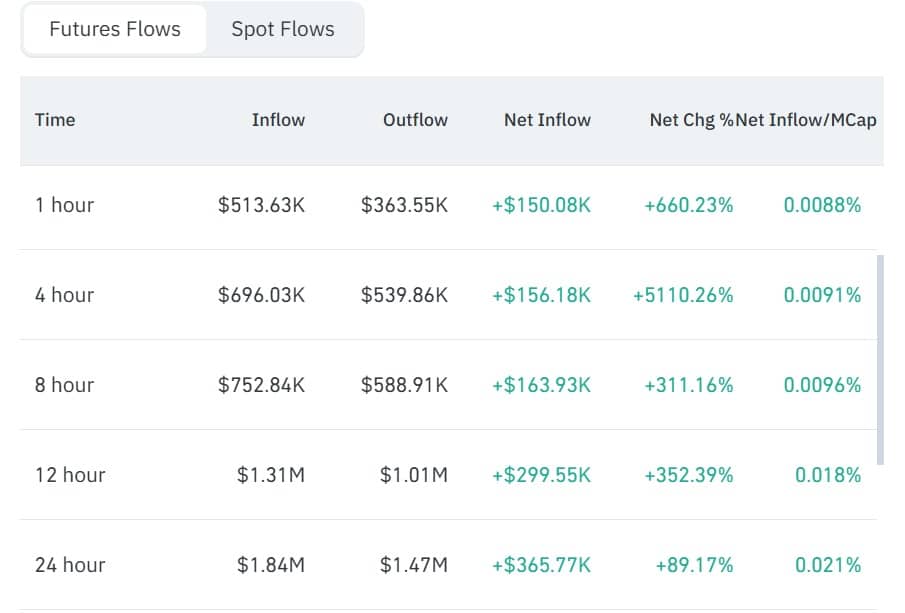
In fact, significant capital flowed into the Futures market. According to CoinGlass data, MemeCore recorded $1.84 million in Futures inflow compared to $1.47 million in outflows. As a result, Futures Netflow dropped 89% to $365k.
Source: CoinGlass
Meanwhile, the memecoin’s Long/Short Ratio jumped above 1 across exchanges. The overall ratio was around 1.07 as of this writing, reflecting high demand for long positions.
This implies that traders mostly opened long positions, indicating bullishness as traders expected the market to continue rising.
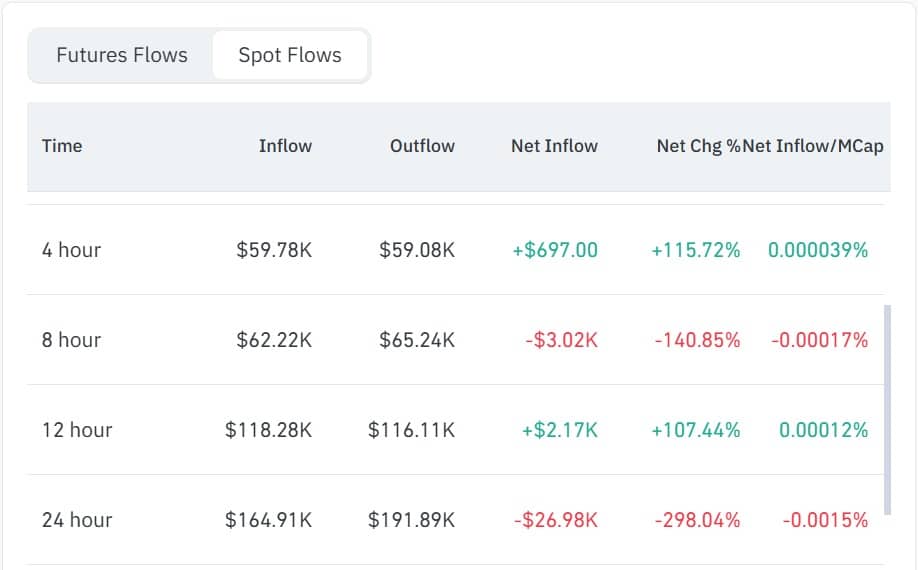
On the spot side, the same sentiment was observed. According to CoinGlass data, the memecoin spot netflow flipped negative on the 24-hour timeframe.
Source: CoinGlass
At press time, the Netflow was -$26k, suggesting traders also purchased in an attempt to chase the rally. Often, strong demand, especially speculative, has preceded strong short-term price pumps.
What momentum indicators suggest
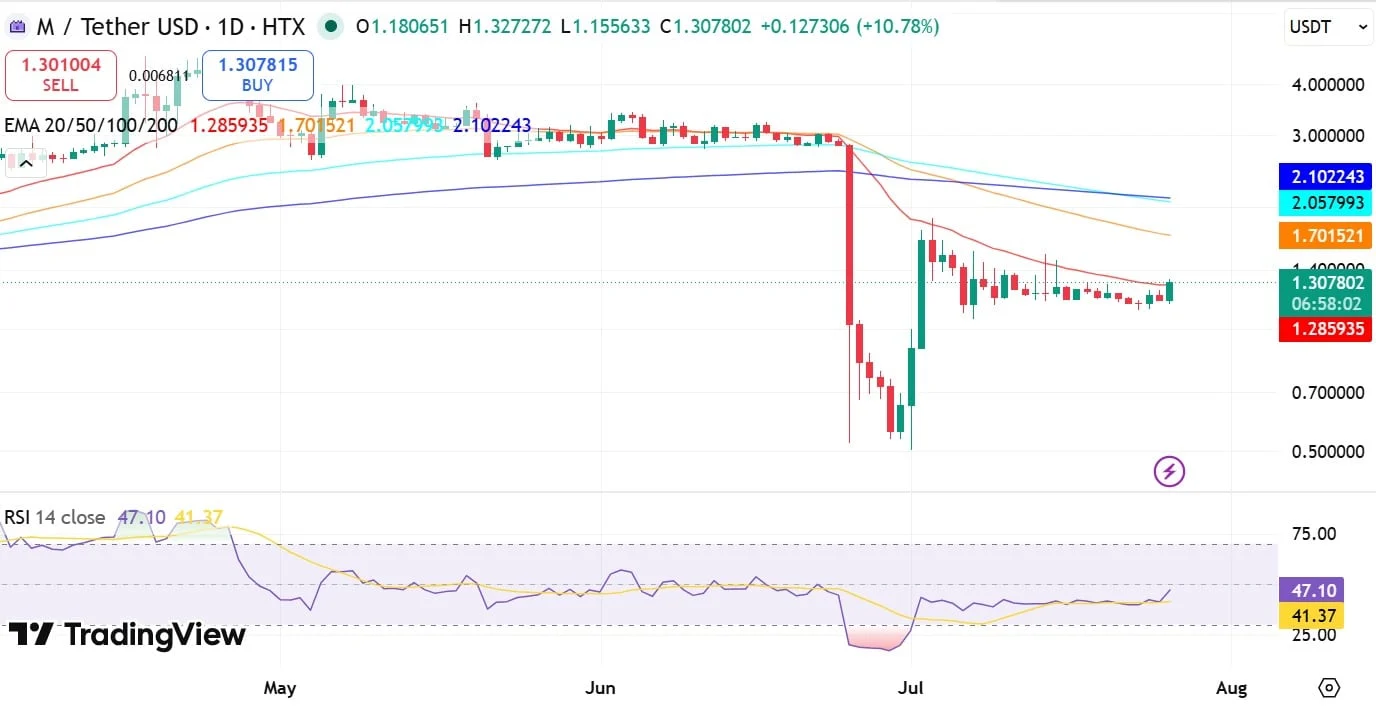
As MemeCore saw a recovery in demand, the memecoin’s upside momentum strengthened a little. For example, the memecoin’s Relative Strength Index (RSI) formed a bullish crossover and rose to 47.
At these levels, RSI showed buyers returning to the market, but they have yet to retake control fully. The EMA further confirms this short-term strength.
Source: TradingView
M flipped the 20-day EMA, showing short-term strength. These two momentum indicators show recovering demand, which has so far given the market some lift.
If the demand holds, the RSI will flip 50, thus confirming the continuation of the trend. In doing so, MemeCore will flip the 50-day EMA at $1.7.
However, if this attempt fails, it will mean it has failed to retake the market, and another pullback to $1.1 will follow.
Final Summary
M surged 11.2% after successfully holding $1.1 to $1.3 amid a sector-wide rebound.
MemeCore’s demand returned as the memecoin sector experienced renewed capital rotation.
Is NVDA a good stock to buy? We came across a bullish thesis on NVIDIA Corporation on Compounding Your Wealth’s Substack by Sergey. In this article, we will summarize the bulls’ thesis on NVDA. NVIDIA Corporation’s share was trading at $206.84 as of July 24th. NVDA’s trailing and forward P/E were 32 and 23.5 respectively according to Yahoo Finance.
How Vertiv (VRT) Is Expanding Its Role in AI Data Center Power and Cooling
NVIDIA Corporation operates as a data center scale AI infrastructure company in the United States and internationally. NVDA remains the dominant supplier of AI compute infrastructure and has evolved far beyond a traditional semiconductor company into a full-stack AI platform spanning GPUs, CPUs, networking, systems, CUDA software, AI libraries, and a deeply integrated partner ecosystem.
As AI data centers increasingly optimize for token throughput, cost per token, utilization, uptime, and software efficiency rather than standalone hardware performance, NVIDIA’s vertically integrated platform has strengthened its competitive advantage.
The company’s Blackwell architecture has been broadly deployed across hyperscalers, frontier AI model developers, AI cloud providers, sovereign AI initiatives, and enterprise AI infrastructure, with management noting adoption by every major hyperscaler and leading model builder. Networking has also become a meaningful growth engine, as Spectrum-X has surpassed the combined scale of competing Ethernet networking peers while InfiniBand revenue increased more than fourfold year over year.
NVIDIA reported exceptional financial performance, with revenue reaching $82 billion, up 85% year over year and 20% sequentially, marking its fourteenth consecutive quarter of sequential growth. Data center revenue climbed 92% to $75 billion, driven by $60 billion of compute revenue and $15 billion of networking revenue, while hyperscalers generated roughly half of data center sales. Despite the rapid Blackwell production ramp, gross margins remained around 75%, free cash flow reached a record $49 billion, and the company returned $20 billion to shareholders while authorizing an additional $80 billion share repurchase program.
NVIDIA’s system-level integration across Grace Blackwell, Vera CPUs, NVLink, Spectrum-X, InfiniBand, CUDA, and AI software creates a formidable competitive moat that is difficult for rivals to replicate. MLPerf benchmarks further demonstrated Blackwell Ultra’s advantages by delivering 2.7 times higher throughput while reducing cost per token by 60%, reinforcing the platform’s value proposition.
According to the bulls, although supply constraints, China-related risks, customer concentration, and custom AI silicon remain key challenges, NVIDIA has proactively expanded supply commitments, inventory, and prepayments to support future demand. With second-quarter guidance of $91 billion in revenue, stable margins, the upcoming Vera Rubin platform, and continued AI infrastructure investment, the company appears well positioned for sustained growth if enterprise AI spending continues translating into profitable customer deployments, supporting a favorable long-term outlook.
Not everyone is bullish on NVDA. Famous investor Michael Burry is one of them. Michael Burry’s bearish thesis on Nvidia relies on a macro market-bubble framework combined with classic semiconductor cyclicality. At the macro level, Burry views the aggressive, multi-billion-dollar infrastructure spending spree by mega-cap technology hyperscalers as a classic speculative mania, drawing direct parallels to the late-1990s Dot-Com bubble. His core argument posits that enterprise monetization and end-user return on investment from software applications will inevitably lag far behind the front-loaded costs of hardware deployment. When hyperscalers realize their current infrastructure yields diminishing marginal returns, capital expenditure budgets will face severe rationalization, exposing the semiconductor supply chain to an abrupt demand drop.
From a microeconomic perspective, Burry treats Nvidia as a hardware provider subject to the classic “bullwhip effect” that historically plagues semiconductor cycles. During periods of extreme chip supply constraints, enterprise customers typically double-order GPUs to secure allocation. Once supply catches up with actual immediate utilization, buyers pause purchases to absorb excess inventory, leading to sharp order cancellations and inventory drawdowns. Furthermore, Burry views Nvidia’s record-high gross margins as cyclically unsustainable; as custom enterprise silicon and competing hardware options mature, Nvidia’s pricing power must normalize down toward historical industry averages.
Previously, we covered a bullish thesis on NVIDIA Corporation (NVDA) by Compounding Your Wealth in April 2025, which highlighted the company’s AI hardware leadership, CUDA ecosystem, expanding data center opportunity, and attractive valuation despite moderating growth. NVDA’s stock price has appreciated by approximately 90.17% since our coverage. Sergey shares a similar view but emphasizes on NVIDIA’s evolution into a full-stack AI infrastructure platform, Blackwell adoption, and system-level integration driving future growth.
We believe NVDA shares may continue to deliver positive returns in the short-term, however, its current valuation implies that NVDA will continue to generate around $250 billion in net profits every single year for the next 20 years. Twenty years is a very long time frame and $250 billion in net profits is a very large number.
NVIDIA Corporation is on our list of the 40 Most Popular Stocks Among Hedge Funds. As per our database, 275 hedge fund portfolios held NVDA at the end of the first quarter which was 264 in the previous quarter. So, hedge funds are also short-term bullish on NVDA. While we acknowledge the risk and potential of NVDA as an investment, our conviction lies in the belief that some AI stocks hold greater promise for delivering higher returns and doing so within a shorter time frame. If you are looking for an AI stock that is more promising than NVDA and that has 10,000% upside potential, check out our report about this cheapest AI stock.