Is NVDA a good stock to buy? We came across a bullish thesis on NVIDIA Corporation on Compounding Your Wealth’s Substack by Sergey. In this article, we will summarize the bulls’ thesis on NVDA. NVIDIA Corporation’s share was trading at $206.84 as of July 24th. NVDA’s trailing and forward P/E were 32 and 23.5 respectively according to Yahoo Finance.
How Vertiv (VRT) Is Expanding Its Role in AI Data Center Power and Cooling
NVIDIA Corporation operates as a data center scale AI infrastructure company in the United States and internationally. NVDA remains the dominant supplier of AI compute infrastructure and has evolved far beyond a traditional semiconductor company into a full-stack AI platform spanning GPUs, CPUs, networking, systems, CUDA software, AI libraries, and a deeply integrated partner ecosystem.
As AI data centers increasingly optimize for token throughput, cost per token, utilization, uptime, and software efficiency rather than standalone hardware performance, NVIDIA’s vertically integrated platform has strengthened its competitive advantage.
The company’s Blackwell architecture has been broadly deployed across hyperscalers, frontier AI model developers, AI cloud providers, sovereign AI initiatives, and enterprise AI infrastructure, with management noting adoption by every major hyperscaler and leading model builder. Networking has also become a meaningful growth engine, as Spectrum-X has surpassed the combined scale of competing Ethernet networking peers while InfiniBand revenue increased more than fourfold year over year.
NVIDIA reported exceptional financial performance, with revenue reaching $82 billion, up 85% year over year and 20% sequentially, marking its fourteenth consecutive quarter of sequential growth. Data center revenue climbed 92% to $75 billion, driven by $60 billion of compute revenue and $15 billion of networking revenue, while hyperscalers generated roughly half of data center sales. Despite the rapid Blackwell production ramp, gross margins remained around 75%, free cash flow reached a record $49 billion, and the company returned $20 billion to shareholders while authorizing an additional $80 billion share repurchase program.
NVIDIA’s system-level integration across Grace Blackwell, Vera CPUs, NVLink, Spectrum-X, InfiniBand, CUDA, and AI software creates a formidable competitive moat that is difficult for rivals to replicate. MLPerf benchmarks further demonstrated Blackwell Ultra’s advantages by delivering 2.7 times higher throughput while reducing cost per token by 60%, reinforcing the platform’s value proposition.
According to the bulls, although supply constraints, China-related risks, customer concentration, and custom AI silicon remain key challenges, NVIDIA has proactively expanded supply commitments, inventory, and prepayments to support future demand. With second-quarter guidance of $91 billion in revenue, stable margins, the upcoming Vera Rubin platform, and continued AI infrastructure investment, the company appears well positioned for sustained growth if enterprise AI spending continues translating into profitable customer deployments, supporting a favorable long-term outlook.
Not everyone is bullish on NVDA. Famous investor Michael Burry is one of them. Michael Burry’s bearish thesis on Nvidia relies on a macro market-bubble framework combined with classic semiconductor cyclicality. At the macro level, Burry views the aggressive, multi-billion-dollar infrastructure spending spree by mega-cap technology hyperscalers as a classic speculative mania, drawing direct parallels to the late-1990s Dot-Com bubble. His core argument posits that enterprise monetization and end-user return on investment from software applications will inevitably lag far behind the front-loaded costs of hardware deployment. When hyperscalers realize their current infrastructure yields diminishing marginal returns, capital expenditure budgets will face severe rationalization, exposing the semiconductor supply chain to an abrupt demand drop.
From a microeconomic perspective, Burry treats Nvidia as a hardware provider subject to the classic “bullwhip effect” that historically plagues semiconductor cycles. During periods of extreme chip supply constraints, enterprise customers typically double-order GPUs to secure allocation. Once supply catches up with actual immediate utilization, buyers pause purchases to absorb excess inventory, leading to sharp order cancellations and inventory drawdowns. Furthermore, Burry views Nvidia’s record-high gross margins as cyclically unsustainable; as custom enterprise silicon and competing hardware options mature, Nvidia’s pricing power must normalize down toward historical industry averages.
Previously, we covered a bullish thesis on NVIDIA Corporation (NVDA) by Compounding Your Wealth in April 2025, which highlighted the company’s AI hardware leadership, CUDA ecosystem, expanding data center opportunity, and attractive valuation despite moderating growth. NVDA’s stock price has appreciated by approximately 90.17% since our coverage. Sergey shares a similar view but emphasizes on NVIDIA’s evolution into a full-stack AI infrastructure platform, Blackwell adoption, and system-level integration driving future growth.
We believe NVDA shares may continue to deliver positive returns in the short-term, however, its current valuation implies that NVDA will continue to generate around $250 billion in net profits every single year for the next 20 years. Twenty years is a very long time frame and $250 billion in net profits is a very large number.
NVIDIA Corporation is on our list of the 40 Most Popular Stocks Among Hedge Funds. As per our database, 275 hedge fund portfolios held NVDA at the end of the first quarter which was 264 in the previous quarter. So, hedge funds are also short-term bullish on NVDA. While we acknowledge the risk and potential of NVDA as an investment, our conviction lies in the belief that some AI stocks hold greater promise for delivering higher returns and doing so within a shorter time frame. If you are looking for an AI stock that is more promising than NVDA and that has 10,000% upside potential, check out our report about this cheapest AI stock.
Chainlink [LINK] attracted renewed attention after a whale accumulated 1.58 million LINK worth approximately $13.2 million through multiple Binance withdrawals over the past week. The wallet increased its holdings to nearly 1.58 million LINK valued at about $13.3 million, reinforcing the latest accumulation narrative.
Those withdrawals reduced exchange-held supply and reflected growing confidence from a large holder despite LINK’s recent consolidation. However, the broader market responded cautiously instead of producing an immediate breakout.
Buyers maintained stable demand while prices remained above key support, showing that investors preferred measured positioning rather than aggressive speculation.
This activity strengthened the long-term supply outlook because fewer tokens remained readily available on exchanges, although traders still waited for stronger confirmation before expanding bullish exposure.
Binance traders back LINK’s long positions
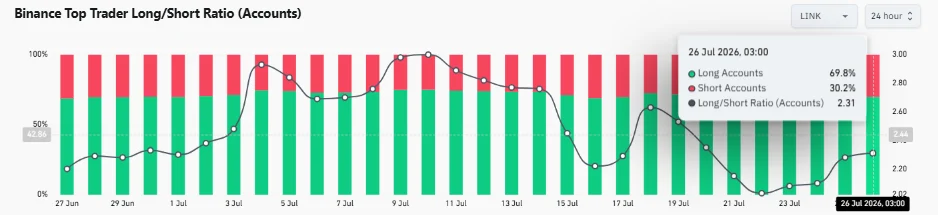
Binance’s top traders continued favoring long positions despite LINK’s lack of a decisive breakout. Account positioning showed that 69.8% of leading traders remained long, while only 30.2% held short positions as of writing.
This distribution pushed the Long/Short Ratio to 2.31, highlighting sustained bullish conviction among experienced derivatives participants. Even so, the price continued moving sideways instead of rewarding that optimism immediately.
Buyers nevertheless maintained their exposure, suggesting they still anticipated higher prices after the recent consolidation phase. Such positioning reflected confidence rather than hesitation, although it also increased the market’s sensitivity to sudden downside moves if sentiment weakened.
Even with that possibility, futures traders continued aligning with the broader accumulation trend created by recent whale activity.
Source: CoinGlass
Chainlink holds support as bears regain control
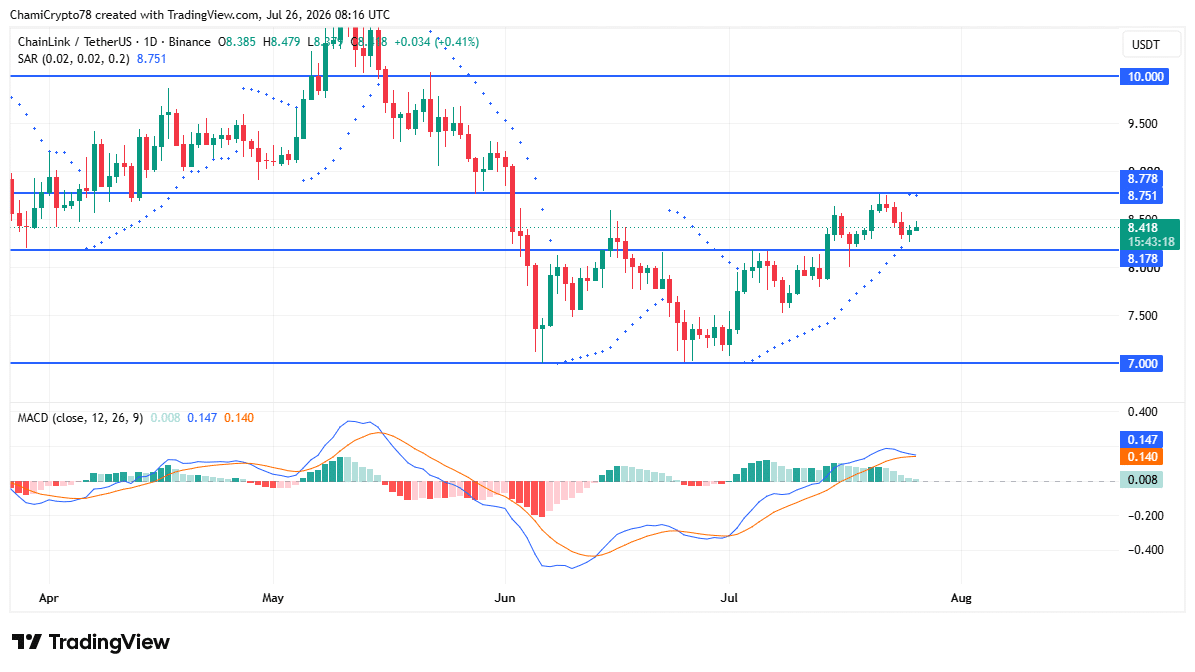
LINK remained above the $8.18 support after absorbing recent selling pressure, yet technical indicators revealed that bullish strength had already started fading.
At press time, the MACD stayed above its signal line, although the histogram continued shrinking as both lines moved closer together. That development indicated weakening buying strength rather than renewed acceleration. Meanwhile, the Parabolic SAR shifted above price near $8.75, signaling that sellers had regained short-term control after the previous advance lost strength.
Even so, buyers successfully defended the nearby support zone instead of allowing an immediate breakdown. If selling pressure further increased, LINK would likely revisit lower levels. However, sustained buying interest would keep the asset above support before another attempt toward higher prices developed.
Source: TradingView
Downside liquidity dominates the market
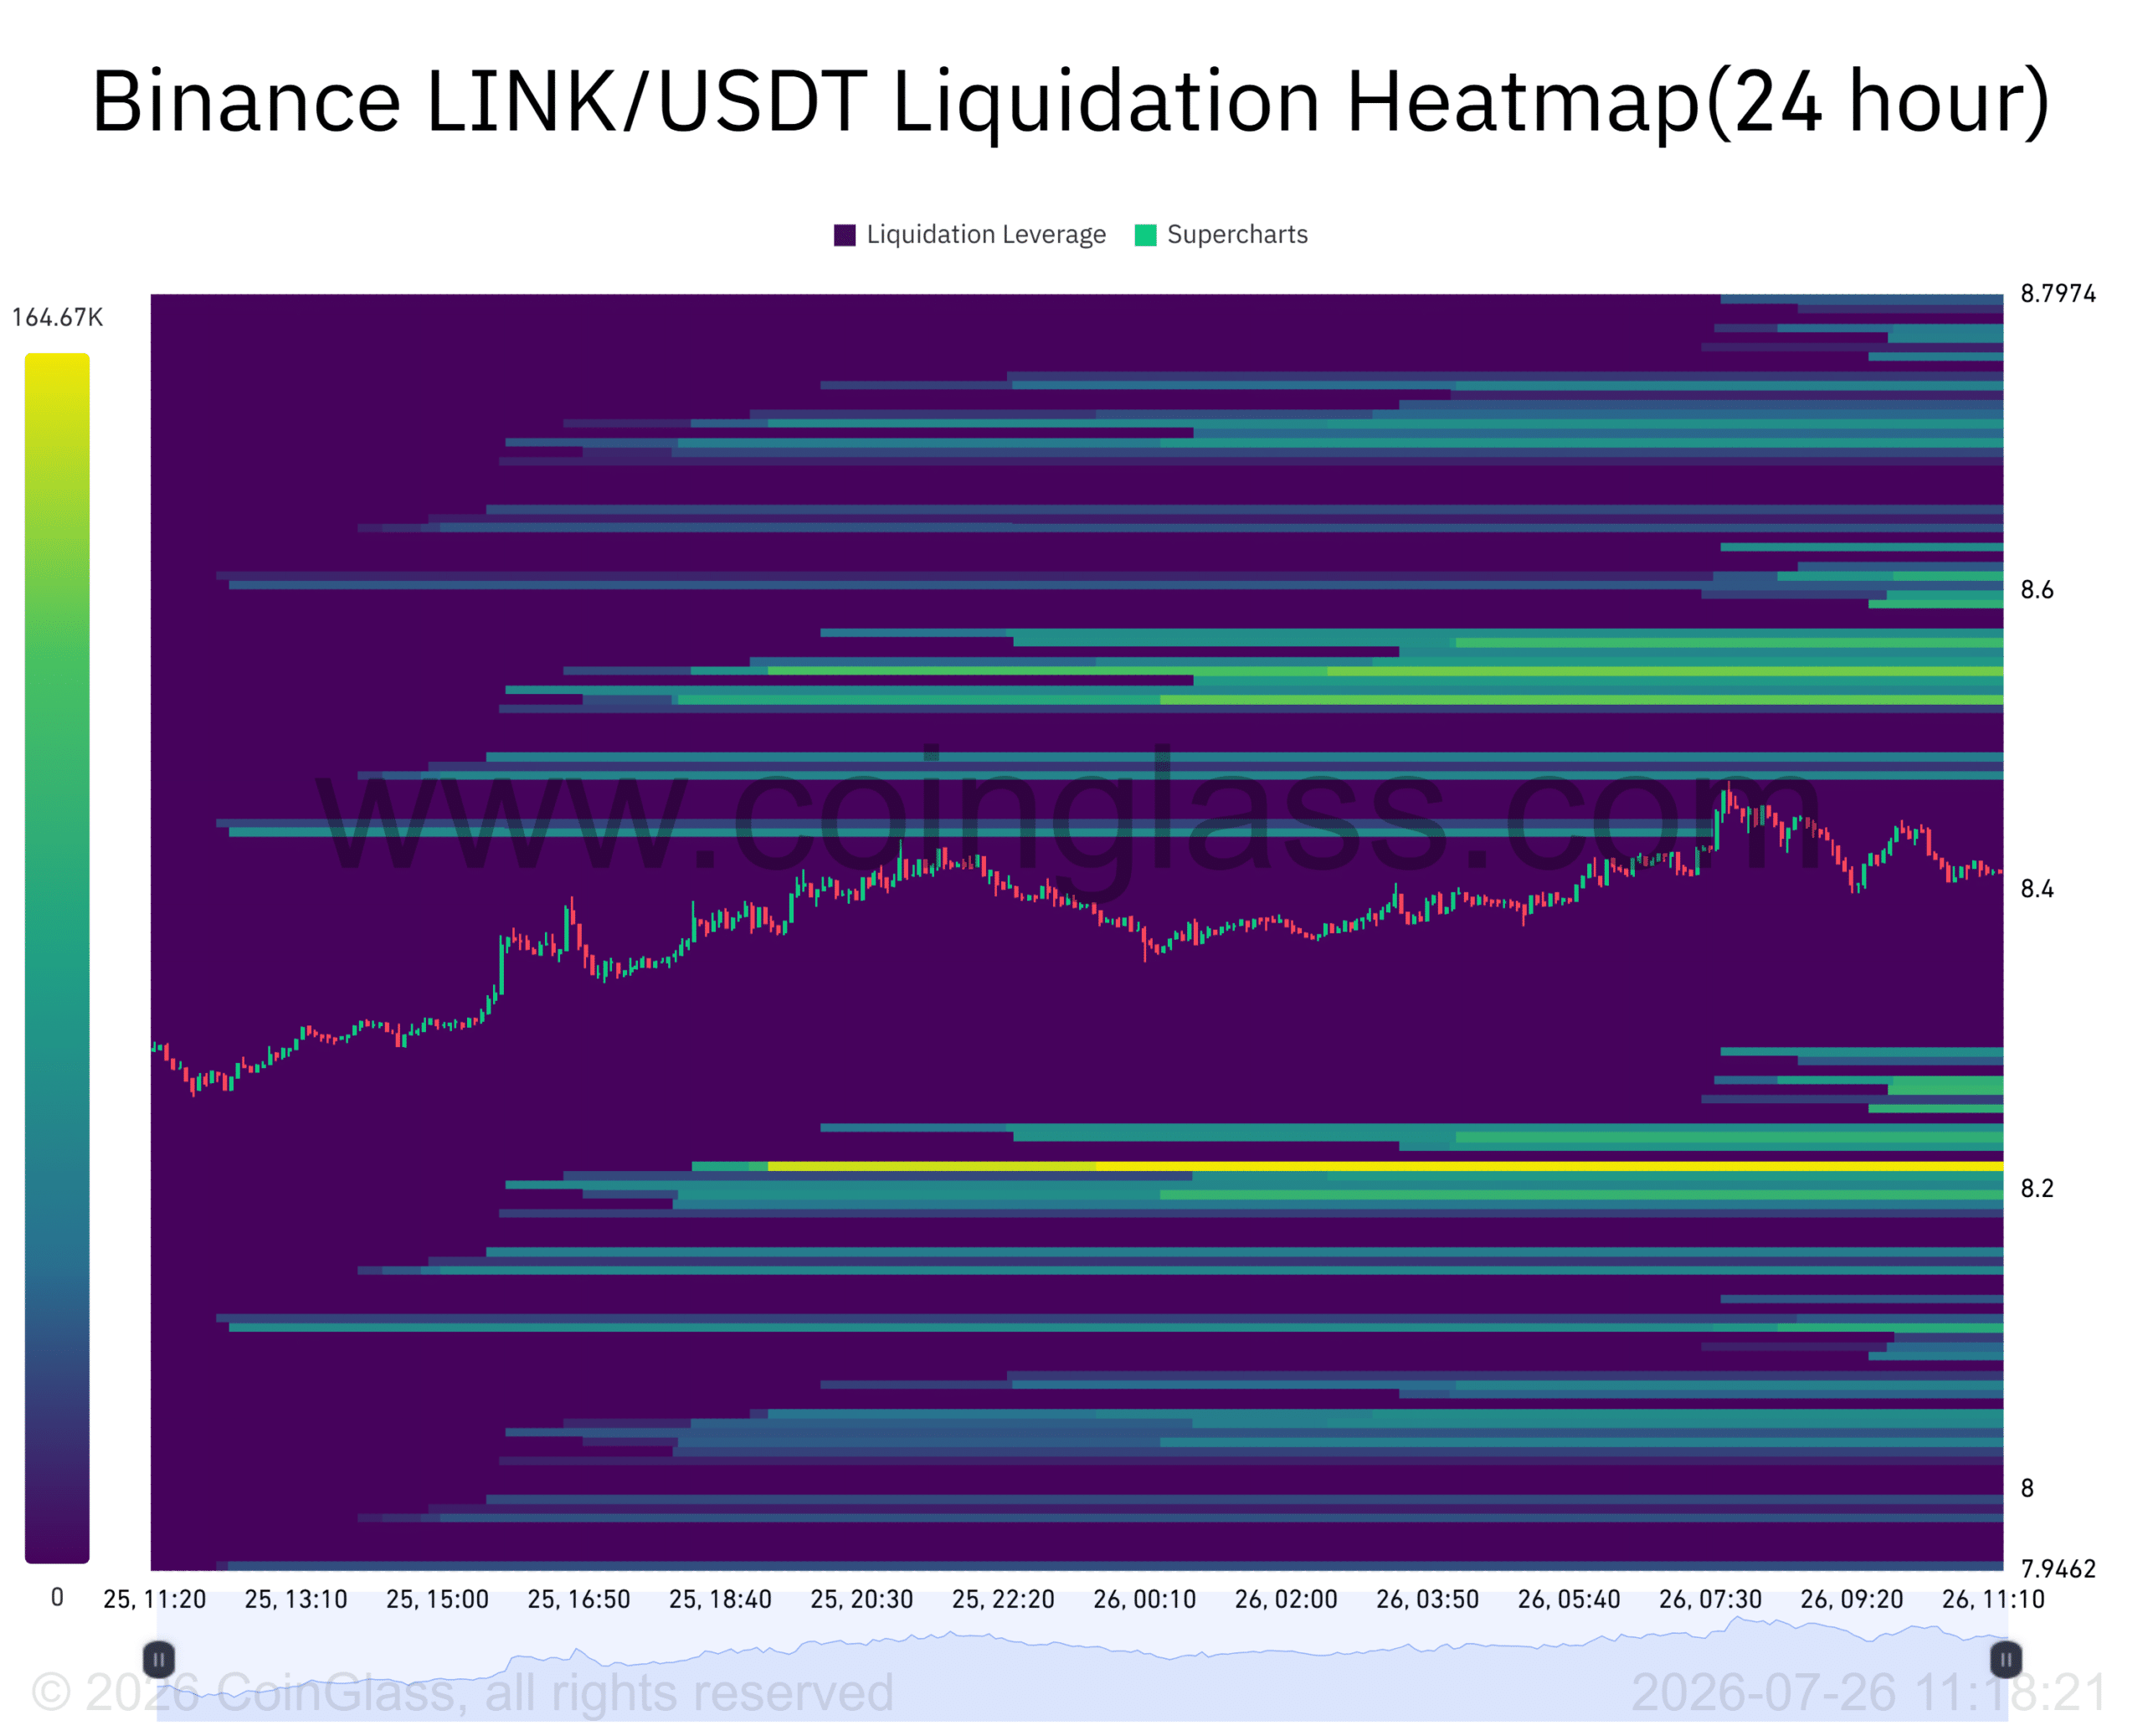
Liquidation Heatmap showed that the market concentrated its largest leveraged exposure below the current price, making downside liquidity the primary area of interest.
The strongest liquidation cluster formed around $8.215, carrying approximately 164.67K in liquidation leverage. This level stood out as the densest liquidity pocket on the chart and attracted greater attention than nearby upside clusters.
Markets frequently moved toward heavily leveraged zones before establishing their next direction, making this area particularly significant. Buyers nevertheless continued defending nearby support, preventing an immediate decline into that liquidity pool.
Should bearish pressure strengthen, LINK would likely move toward $8.215 before attempting to stabilize. Until then, that level remained the most important short-term price magnet.
Source: CoinGlass
To conclude, whale accumulation and strong long positioning reinforced confidence in Chainlink’s broader outlook, yet price action revealed that bullish strength had already weakened.
Technical indicators favored caution, while the largest liquidation cluster below the market highlighted $8.215 as the most significant short-term level. Unless buyers regain stronger control, LINK would likely revisit that liquidity zone before attempting another sustained advance.
Final Summary
Whale accumulation reduced exchange supply, while LINK continued holding above key support levels.
Technical indicators weakened as downside liquidity near $8.215 became the market’s primary focus.
POSCO International, South Korea’s largest trading company, has begun tokenizing trade receivables on blockchain in a test that could speed up commercial payments between its global subsidiaries.
The company, which generated $22.2 billion in revenue last year from businesses spanning steel, energy and battery materials, is working with LG CNS, the technology arm of LG Group, to issue, transfer and settle receivables on layer-1 blockchain Injective INJ$4.9363, the firms told CoinDesk in a press briefing.
The pilot is using receivables generated by real trade between POSCO’s overseas operations and their counterparties rather than simulated transactions.
Trade receivables represent money owed to a company after goods have been shipped but before payment is received. Today, those claims are typically tracked separately by buyers, sellers and banks, with reconciliation often taking days before cash can be released.
The companies said putting receivables on a shared blockchain ledger creates a single record that can be transferred and settled while carrying compliance rules with the asset itself.
When a retailer sells a product people no longer want or need at the same level they once did, it becomes challenging for that retailer to operate.
Yes, you can cut expenses and close stores, but if customers aren’t buying, no amount of frugality will keep the doors open.
That’s a challenge facing any chain serving the luxury market, as Americans have cut back on discretionary spending. Luxury shoppers’ optimism about the economy continues to decline, driven by global financial uncertainty and market volatility, according to the latest Saks Global Luxury Pulse survey.
“The survey, conducted between April 24 and April 28, found that only 28% of respondents reported feeling optimistic about the economy. That represents a 13 percentage point decline since the prior survey fielded in January, and a decline of 17 percentage points compared to last year,” according to the report.
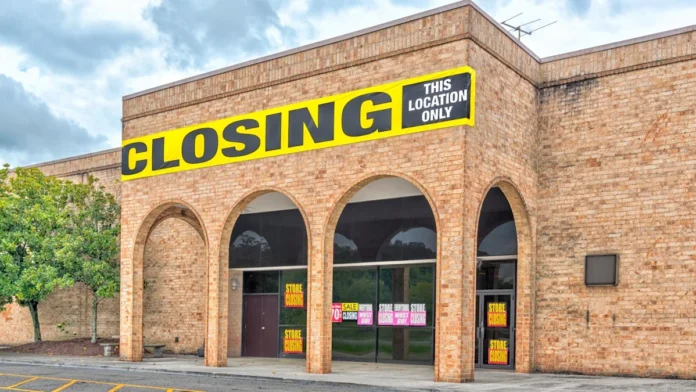
It’s bad news for Leslie’s Pool Supply. The company closed 80 locations in March, but it hasn’t been enough to stem the bleeding. Now, the retailer faces a possible Chapter 11 filing, according to a report from Bloomberg.
“Compared to last year, in the second quarter, we delivered overall revenue growth of 4.3%, a comparable sales increase of 6.6%, improved year-over-year adjusted EBITDA by 26% and registered total customer count growth of 8%,” shared CEO Jason McDonell.
Those numbers followed the chain making a number of cuts during the first quarter.
Leslie’s announced the closure of approximately 80 underperforming stores as part of a cost-reduction and operational restructuring plan during Q1 fiscal 2026, according to its Q1 earnings release.
The company also closed one distribution center (Illinois) to streamline its supply chain and reduce expenses, which it also included in its Q1 filings.
Leslie’s recorded approximately $10.1 million in non-cash impairment charges related to store and asset closures, the company reported.
For Q1 fiscal 2026, Leslie’s reported a net loss of about $83 million and sales down roughly 16% year over year, citing weak demand and margin pressure, it shared in SEC filings.
The chain, which has moved more of its sales to a digital model after closing the stores mentioned above, also cut its loss from the first quarter.
“Net loss for the second quarter was $52.5 million compared with a net loss of $51.3 million in the second quarter of the prior year. Adjusted net loss in the second quarter was $50 million compared with an adjusted net loss of $48.3 million in the second quarter of the prior year,” according to CFO Jeffrey White.
Pools are a luxury item.Shutterstock
Leslie’s Pool Supply faces bankruptcy
Leslie’s executives did not mention a potential Chapter 11 filing during the earnings call.
Bloomberg‘s report, which cites unnamed “people familiar with the matter,” said Leslie’s is looking at “a range of strategic options” to address its debt load, including restructuring its debt through Chapter 11.
In addition, Bloomberg reported, Leslie’s has a $756 million term loan due in 2028 that is being quoted at about 39 cents on the dollar.
While Leslie’s is reportedly talking about Chapter 11, Bloomberg’s sources stated that the discussions are “ongoing” and that “no final decision has been made.”
“Leslie’s reportedly brought on Centerview Partners LLC and Simpson Thacher & Bartlett to advise the company through the debt negotiations. A group of creditors hired Houlihan Lokey and Akin Gump Strauss Hauer & Feld,” according to Phoenix Business Journal.
Leslie’s Pools has faced recent financial challenges with its stock listing.
“The company’s stock performance has been under pressure throughout 2025, culminating in its removal from the S&P SmallCap 600 index earlier this year,” Pool Magazine, a leading publication covering the pool industry, shared.
This isn’t the only sign that investors have lost confidence in the company.
“Being part of the S&P SmallCap 600 gives a company visibility, provides passive fund support, and signals investor confidence. Losing that standing means Leslie’s no longer met benchmarks for market cap and liquidity — a clear sign the stock has struggled to maintain momentum,” the magazine added.
S&P Global Ratings has downgraded the issuer credit rating of U.S. specialty pool supply retailer Leslie’s Poolmart Inc. from “B” to “B-” due to weaker-than-expected business prospects for fiscal 2025, according to Investing.com.
This as-told-to essay is based on a conversation with Tanvi Pisal, a 29-year-old UX designer from India. She went through two layoffs within a year while working in the US. It has been edited for length and clarity.
I grew up in Pune, a city in western India, where I earned my bachelor’s degree in software engineering. After graduating, Iworked in software, user experience, and interface design.
Back in 2019, design was still a relatively new field in India. I saw much bigger opportunities in the US, especially in Silicon Valley, where I could work with brilliant minds and innovative technology. That’s when I decided to apply to master’s programs in the US.
In the fall of 2021, I moved to California to pursue a degree related to human-computer interaction at San José State University.
During my final year, I interned at a Bay Area healthcare tech startup that hired me after graduation.
I was working on STEM OPT, which allowed me to work in the US for up to 3 years after graduating, and I hoped to stay longer on an H-1B visa. My company sponsored me, but I wasn’t selected in the lottery.
Back-to-back layoffs
I could see that AI was disrupting SaaS companies like mine.
So around June 2025, I anticipatedthe layoffsand started applying for other full-time roles. I thought I’d have more time, but I was laid off a few months later, in October.
I aggressively applied for new roles, and in November, I received an offer for a product design position at a New York City recruiting company, where I’d be designing its mobile app. They asked me to relocate, and I did, even though they didn’t offer relocation assistance.
Pisal moved to NYC after being laid off from her role in the Bay Area.
Tanvi Pisal
I sold most of my furniture in San José, subleased my room, packed my life into five U-Haul boxes, and shipped them to New York.
On short notice, I found a shared apartment in Newport, New Jersey. At $1,800 a month, it was all I could afford. I commuted an hour each way for 12-hour office shifts.
My world turned upside down when, one day at the office, I was abruptly laid off just two weeks after starting. The company gave only vague reasons for the decision.
I’d moved to New York just 15 days earlier. I couldn’t understand why the company had me relocate from the West Coast to the East Coast only to lay me off.
I remember walking out of the office that day and sitting on the snow-covered sidewalk, wondering whether coming to the US had been the right decision.
Packing up my life into boxes twice in a month
I picked myself up and started returning the things I’d bought for my new life in New York while I still could.
The only thing I couldn’t return was my desk, which I sold to the person taking over my sublease. I told my roommates to use up the groceries I’d just bought.
The whole ordeal — packing up my life twice in a month — cost me about $6,000.
I flew back to California on December 25.
My Hail Mary attempt
At that point, I thought, “The worst has happened.” I’d lost everything. My STEM OPT was about to expire, and I had 60 days to figure out a way to stay in the US before I’d have to return to India.
So I decided I might as well give it one lasttry.
Back in California, I spent three hours each day on LinkedIn Easy Apply, then targeted applications before building AI-powered design projects to strengthen my portfolio.
It paid off. I landed an interview on January 5. From that week on, I had at least two interviews each week.
Finally, I interviewed for a UX designer role witha product team at a Big Tech company in Silicon Valley. After two interviews, they offered me a contract role in February. I couldn’t believe it. I was so relieved.
My nervous system has not recovered
Although I’ve settled into my new apartment in San José and am enjoying my new job, I still haven’t recovered from the trauma of the back-to-back layoffs.
I’m always scared. Every time I get an email or am called into an unscheduled meeting, I feel anxious. I need to know what it’s about beforehand.
I’ve decided to continue my studies on the side, enrolling in a Ph.D. program in business administration at Westcliff University, with a concentration in human-computer interaction. It allows me to stay in the US on a student visa.
I don’t really have a plan for the future right now, given how volatile the immigration situation is. I’m just taking it one day at a time, easing back into a routine and trying to live my life normally.
Looking back at my journey, I wouldn’t change a thing. The struggles have taught me so much.
Hidden fees push a couple’s true annual cost in The Villages from $56,000 to $70,000, a gap most buyers discover only after signing.
Infrastructure bonds up to $45,000, CPI-indexed amenity fees, and golf carts costing $25,000 each never appear in the sales brochure.
Closing a $24,000 annual gap above Social Security requires a portfolio somewhere between $650,000 and $700,000 at a 3.5% withdrawal rate, along with a cash reserve to accommodate a slow resale.
Two retirees, same $1 million, same 4% rule, buy one finished with $1.4 million, the other hit $0 in 12 years. Our free reader guide explains the flaw that separated them, and the income-first method built to avoid it.
Every week, someone in their late fifties or early sixties runs napkin math on a legal pad: sell the northern house, buy in The Villages, live on Social Security and a portfolio, spend days on a golf cart. The brochure version is seductive. Then people move in and discover the budget was missing three or four line items nobody in the sales center mentioned. This piece is for the reader running that math right now, who wants to know the real annual number before signing a purchase contract.
Inside Creative House / Shutterstock.com
The Real Budget Runs Well Above the Base
Start with Florida itself. The state’s cost of living sits at 103.4 against a national baseline of 100, so the “cheap Florida” framing is softer than most retirees expect. Sumter County runs above the state average once you price in the community’s fee structure. A reasonable working budget for a couple in a modest patio villa, before hidden items, looks like this in current dollars:
Healthcare premiums, supplements, out of pocket: $10,000
Transportation including a second vehicle and gas: $6,000
Recreation, travel, gifts, personal: $8,000
Miscellaneous reserves and federal income tax on withdrawals: $6,000
That is roughly $56,000 a year for a couple living comfortably but not lavishly. Now add the items The Villages specifically imposes.
The 4% Rule is Broken, Built On A World That No Longer Exists
Every retiree knows about the 4% rule, but it frames retirement as a slow liquidation and still causes retirees with seven-figure accounts to agonize over a dinner out.
There’s a different way to run the math that makes more sense today. Build an income floor — dividends, interest, and Social Security that cover your essential bills every month — and you never have to sell shares into a down market just to pay them.
The bond assessment is the first surprise. New homes carry an infrastructure bond, commonly in the $20,000 to $45,000 range depending on section and home type, either paid at closing or amortized over roughly 30 years at a fixed rate that runs several hundred dollars a year on top of taxes.
The monthly amenity fee adds another layer, currently around $200 a month for most residents and contractually indexed to CPI. With CPI running at 332.568 in June 2026 versus 322.169 a year earlier, that fee has been climbing every year. Then there is the Community Development District maintenance assessment, another few hundred to a thousand annually depending on district.
A golf cart is essential. A new gas or lithium cart runs $15,000 to $25,000, with insurance and battery replacement recurring, and most households eventually own two. Homeowners insurance in Florida has become its own budget category; wind, flood where applicable, and sinkhole riders in Sumter County push a modest home’s coverage well past what a similar house costs to insure in Georgia or the Carolinas. Add all of that in and the $56,000 budget becomes closer to $68,000 to $72,000.
The Portfolio Math
Assume a couple both claiming Social Security near full retirement age at roughly the current average, which lands household benefits around $46,000 a year after the 2.8% 2026 COLA. Against a $70,000 annual spend, the gap is about $24,000. At a 4% withdrawal rate that is a $600,000 portfolio target. At a more conservative 3.5% rate, which is appropriate for a 30-year horizon with rising fee escalators, it is closer to $685,000.
Medicare is a fixed cost you can lock in. The standard 2026 Part B premium is $202.90 per month with a $283 annual deductible, and a Medigap plus Part D combination typically adds $200 to $300 monthly per person. That is the $10,000 healthcare line, and it grows faster than CPI.
The Resale Problem Most Budgets Ignore
The Villages sells briskly on the way in, but the exit market is different. Existing home sales nationally are running at 4.09 million annualized in June 2026, which the interpretation guide classifies as a soft market. Inside a large age-restricted community, resale competition is concentrated: when one spouse’s health forces a move to assisted living, your home is listed against hundreds of near-identical floor plans built by the same developer, many with fresh incentives. The bond balance transfers with the home and reduces what buyers will pay for it. Florida’s number four overall tax ranking and no personal income tax help the carrying cost while you live there, though the resale market remains illiquid when you need to exit.
Plan the exit before you plan the entrance. Keep six to twelve months of expenses in cash outside the portfolio specifically to bridge a slow sale, and do not sink so much of your net worth into the house that a discounted exit forces a lifestyle downgrade elsewhere.
What It Actually Takes
For a couple, plan on roughly $70,000 a year in current dollars, two Social Security checks bringing in about $46,000 combined, and an invested portfolio of $650,000 to $700,000 drawn at 3.5%, with a cash reserve outside that portfolio to absorb the bond, the escalating amenity fee, and a resale that may take longer than the brochure suggests. Everything else is texture. Miss the reserve and the golf carts stop being fun.
Before Your Next Withdrawal, Run One Number ( It’s Not The 4% Rule Everyone Knows)
Take your essential monthly expenses and subtract your guaranteed income — Social Security, plus any pension. What’s left is your income gap, and how you close it determines whether retirement runs on share sales or on a paycheck your portfolio writes you every month. Our free reader guide, The 4% Rule Is Broken, shows exactly how to close that gap with portfolio income: a worked example (one retiree needed about $480,000 in income-producing assets to cover his essentials for good), an eight-point conversion checklist, and the 20-year numbers comparing dividends to withdrawals. It’s free and takes about 15 minutes to read. Get the guide here before you take your next withdrawal.
This week, the crypto market stayed under pressure.
On the macro front, renewed geopolitical tensions kept investors cautious, pushing Bitcoin [BTC] ETF flows back into negative territory. To make matters worse, DeFi exploits further weighed on market sentiment.
Even so, a handful of AI and mid-cap altcoins outperformed, showing that capital is still rotating into selective narratives rather than the broader market.
Weekly winners
Why Audiera [BEAT] needs FOMO to sustain its momentum
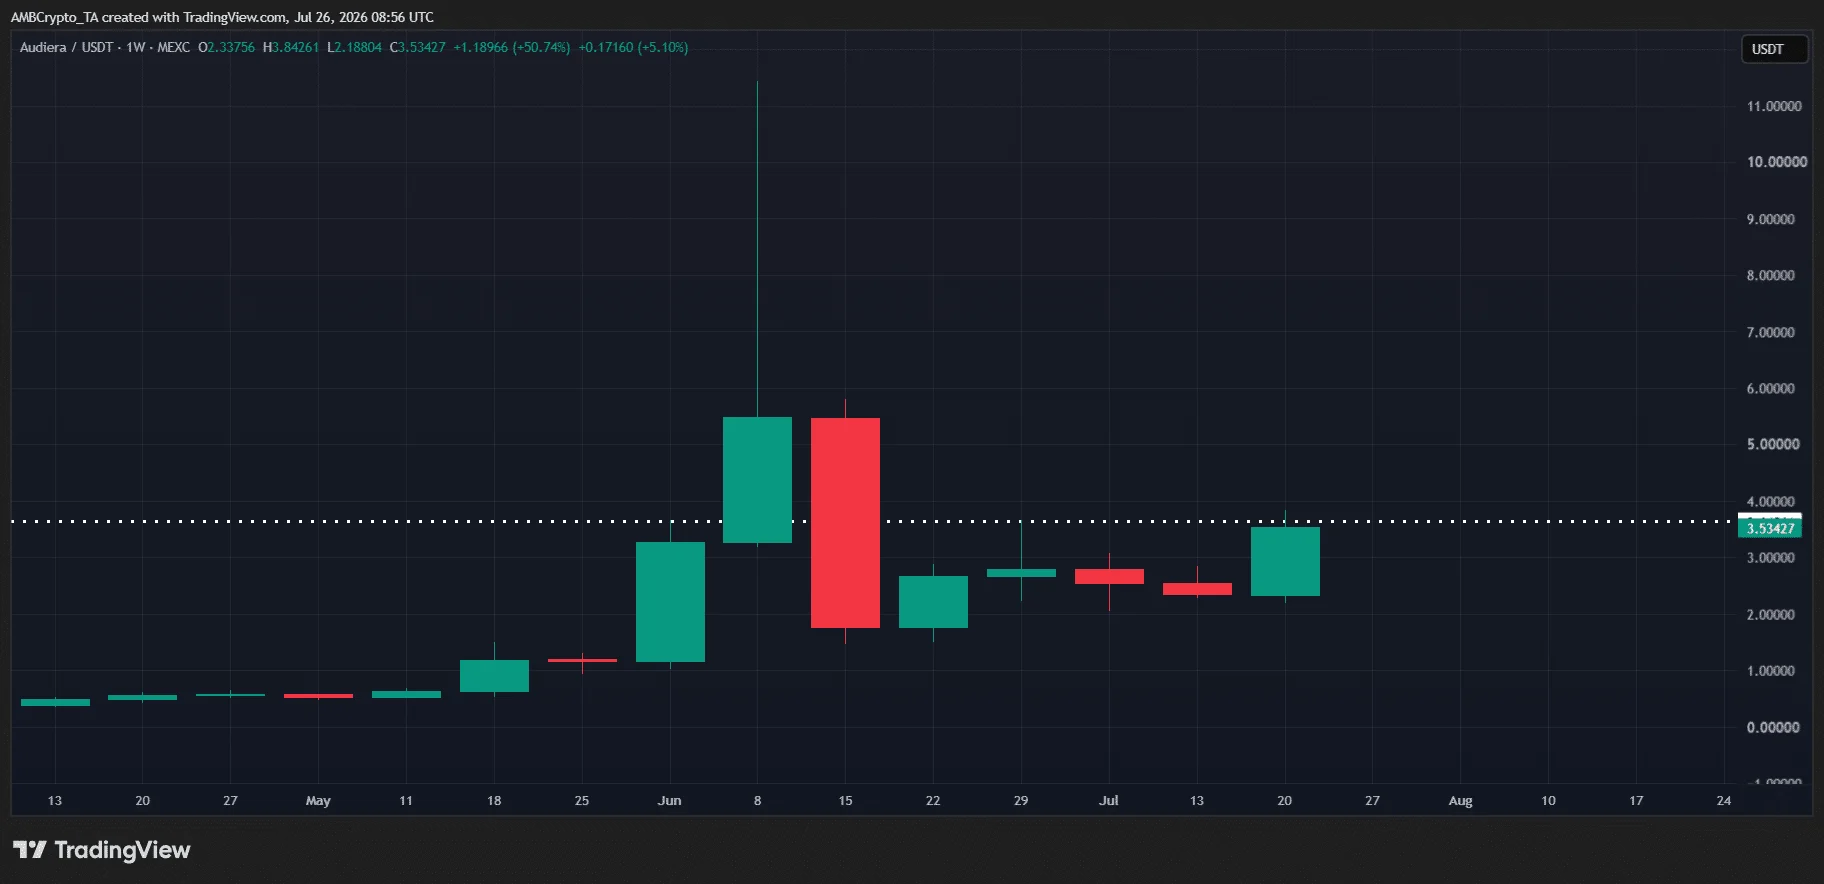
Audiera [BEAT] led this week’s top gainers with a 50% rally. More importantly, the move came after two straight weeks of decline and a broader consolidation phase, suggesting this wasn’t just a random spike. Instead, bulls stepped in to buy the dip, shifting momentum back in their favor.
The technical setup also remains constructive. The RSI is rising but hasn’t reached the extreme overbought zone yet, meaning there’s still room for the rally to extend. With buyers back in control and momentum building, BEAT has a good chance of carrying its gains into the coming week.
That said, the next hurdle is a big one. As the chart below shows, BEAT has broken above the $3.60 resistance and is now approaching the $4.00 psychological level. This is where sell-side pressure could start picking up as short-term traders take profits.
Source: TradingView (BEAT/USDT)
If bulls can absorb that selling and turn $4.00 into support, the rally could extend further. But if they fail to hold the breakout, BEAT could see a healthy pullback before attempting another move higher.
That makes FOMO the next key catalyst to watch.
Early signs are already showing up on the daily chart, with BEAT gaining more than 5% intraday. If that momentum continues and buyers keep chasing the breakout, BEAT could be on track to test the $4.50-$5.00 resistance zone over the coming sessions.
Shiba Inu [SHIB] rallies as supply squeeze fuels momentum
Shiba Inu [SHIB] emerged as the second-best performer of the week, gaining nearly 35%. It’s also SHIB’s strongest weekly rally since November 2024, showing that buyers are starting to rotate back into the meme coin after months of muted price action.
What’s interesting is that SHIB’s move looks different from the rest of the market. According to Shibburn, nearly 280 million SHIB were burned this week, while whale accumulation also picked up. That suggests this isn’t just a momentum-driven rally. Instead, on-chain demand is backing the move, even as the broader market remains relatively quiet.
From a technical standpoint, SHIB has broken out of its recent range and is now building momentum toward the next resistance zone around $0.000026-$0.000027. If buying pressure and whale accumulation continue at the current pace, that target looks well within reach, putting SHIB back near its early May trading range and making it one of the key altcoins to watch heading into Q3.
Venice Token [VVV] token faces a key test this week
Venice Token [VVV] finished as the third-best performer of the week, gaining 9%. While that’s smaller than the other two top gainers, VVV’s price action arguably looks the healthiest from a technical standpoint.
This week’s move extends two straight weeks of gains, taking VVV’s total rally to nearly 30%. So, instead of a one-day spike, the token has been climbing steadily, showing consistent buying pressure. That’s usually a stronger setup because it suggests accumulation rather than short-term speculation.
The RSI is starting to heat up, but the gradual pace of the rally leaves room for the trend to continue. If buyers stay in control, VVV looks well-positioned to push into the $15 resistance zone. Even if some profit-taking shows up along the way, it would likely be a healthy pullback to shake out weak hands rather than a sign that the uptrend is over.
Other notable winners
Outside the majors, altcoin movers also stole the spotlight this week.
Score [SN44] led the market with a staggering 3,988% gain, followed by Pons [PONS], which surged 179%, while Euler [EUL] climbed 135%, rounding out the week’s top performers.
Weekly losers
DeXe [DEXE] faces a full-blown capitulation sell-off
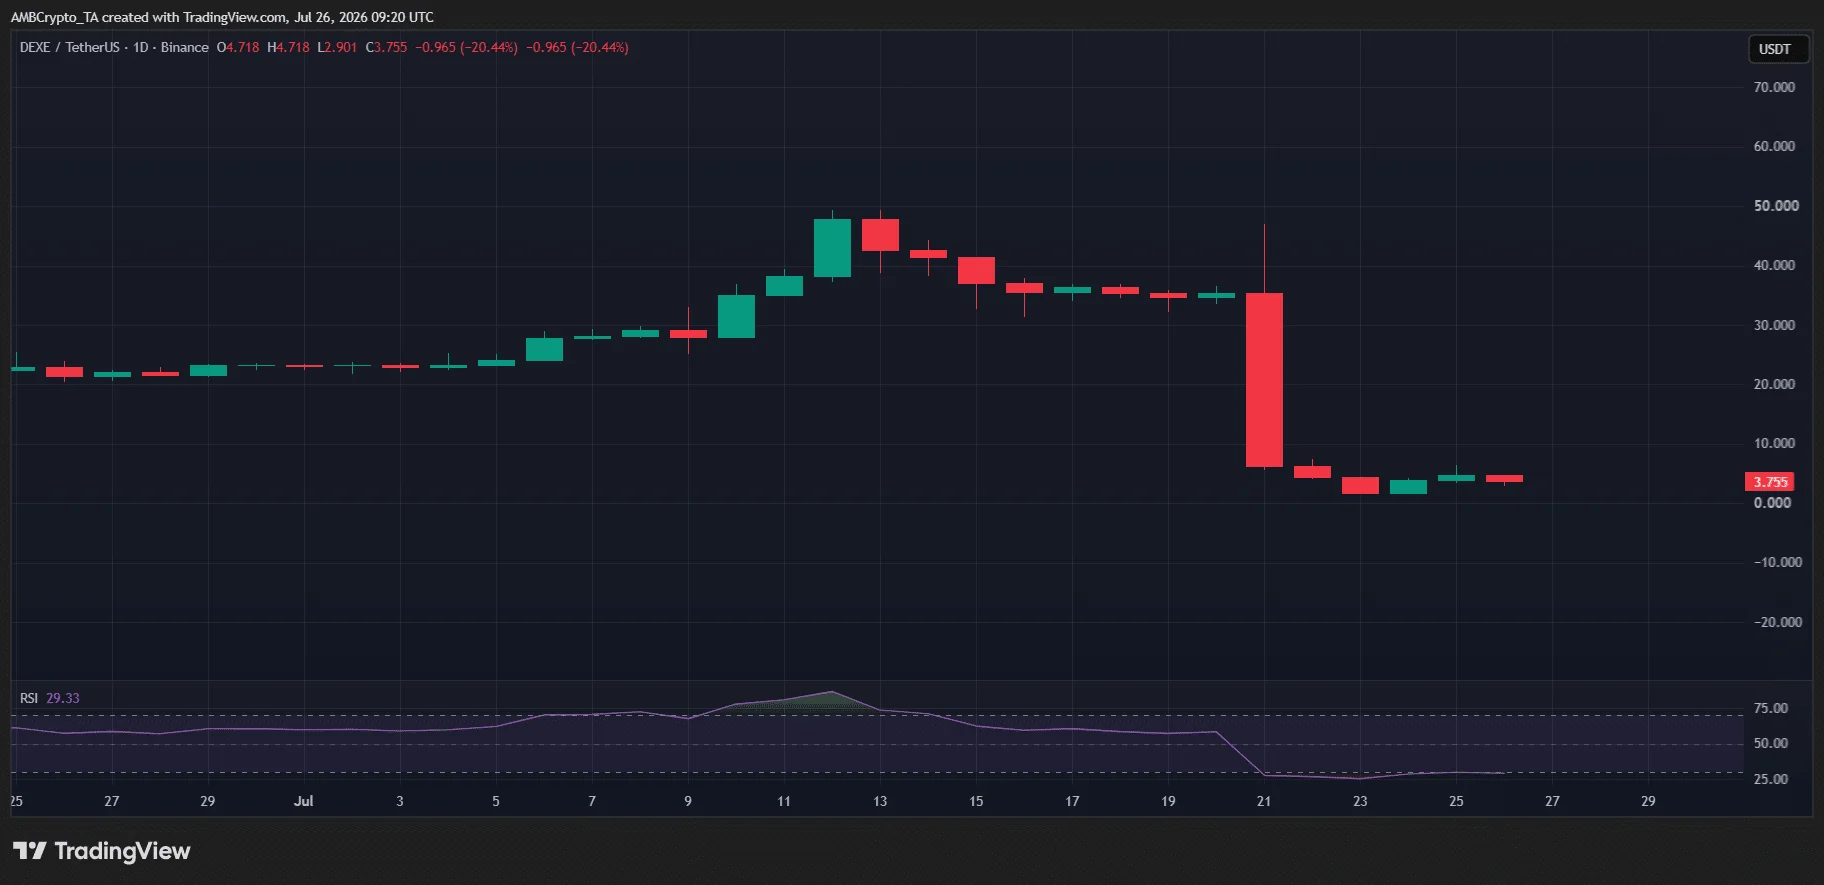
DeXe [DEXE] topped this week’s losers list after crashing nearly 90%. It looked like full-blown capitulation, wiping out months of gains and sending DEXE back toward its early Q1 price range around $1.50. As a result, many holders who bought during the rally are now sitting at a loss.
The sell-off also wasn’t isolated, though. The crypto market was shaken by three DeFi hacks in a single day, triggering fresh FUD. Since DEXE is a DeFi token, it was hit harder than most as traders rushed to cut risk.
That said, the selling pressure looks like it’s finally cooling off. Since the initial crash, DEXE has been consolidating around the $3.50 level, while the RSI has dropped into deeply oversold territory. That doesn’t guarantee a reversal, but it does suggest the capitulation phase may be ending.
Source: TradingView (DEXE/USDT)
If buyers start stepping back in and DEXE holds its current range, a short-term relief bounce could be the next move to watch.
Midnight [NIGHT] reinforces bear control as sellers continue to dominate
Midnight [NIGHT] ended the week as the second-biggest loser, falling 26.7%. While the decline looks relatively mild compared to DeXe’s capitulation, the technical picture still favors the bears.
This week’s drop comes after the last two weeks’ 25%+ decline, extending NIGHT’s lower-high, lower-low structure and dragging the token below the $0.002 area. Although the daily chart posted a modest 1.5% bounce, it hasn’t been enough to change the trend. The RSI also remains well above the oversold zone, suggesting selling pressure hasn’t been fully exhausted yet.
Unless buyers step in with stronger volume, NIGHT could be setting up for another break below support, just like it has over the past few weeks. For now, the chart still points to bears staying in control, with a stronger bullish setup likely to emerge only after accumulation starts picking up.
Zcash [ZEC] reaches a key inflection point
Zcash [ZEC] finished as the third-biggest loser of the week, slipping 10.16%. Unlike the other two names on the list, though, ZEC’s pullback doesn’t look like a breakdown. Instead, it looks more like a healthy cooldown after a strong run.
Technically, ZEC rallied nearly 40% across late June and early July, reclaiming the $500 level. After a move like that, some profit-taking was always likely. So far, that’s exactly what the chart is showing—a typical pullback where weak hands take profits while longer-term buyers wait for better entries.
If this setup holds, ZEC could be positioning for another leg higher once market sentiment improves. The main thing to watch isn’t ZEC itself, but the broader market. If the current wave of FUD starts fading, ZEC’s pullback could end up looking like nothing more than a reset before the next move.
Other notable loses
In the broader market, downside volatility hit hard.
BitMart [BMX] led the losers with a 64.9% decline, followed by Starpower [STAR], which fell 38.5%, while Up [UP] dropped 36.6% as bearish momentum intensified.
Conclusion
This week was a rollercoaster for crypto. Big pumps, sharp dips, and nonstop action. As always, stay sharp, do your own research, and trade smart.
Final Summary
Audiera [BEAT], Shiba Inu [SHIB], and Venice token [VVV] led the week in gains.
DeXe [DEXE], Midnight [NIGHT], and Zcash [ZEC] saw significant declines.