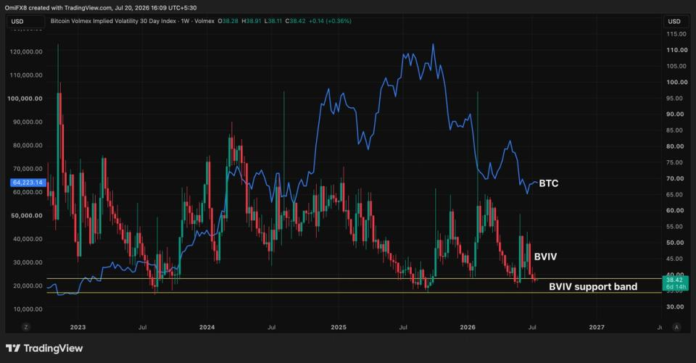
While past patterns are never a guarantee of future performance, volatility metrics are widely known to be mean-reverting. This cyclical nature suggests that periods of below-average volatility are often followed by higher turbulence, while above-average volatility paves the way for market stability.
Currently, the index is trading below both its 30-day and 200-day simple moving averages. In essence, volatility is relatively “cheap” and sitting at a historically reliable support zone, suggesting the measure could be set to rise, which means another round of turbulence.
For now, bitcoin continues to trade just above $64,000, maintaining the range-bound price action that has persisted since last Wednesday. While some analysts have noted two consecutive weeks of spot ETF inflows, the capital movement is tiny compared with the billions yanked from the market during the preceding eight-week outflow streak.
Global volatility gauges in traditional markets are currently offering mixed signals. South Korea’s KOSPI VIX is currently above 70%, its highest level since the 1990s. Meanwhile, Wall Street’s VIX jumped over 12% to reach 18% on Friday, where it continues to hover. However, these levels have been in the play for months, which means that stocks are anything but panicked.
Additionally, the MOVE index, the 30-day volatility gauge for U.S. Treasury notes that underpins global finance, remains steady around 70%, as it has since April, offering a constructive cue for risk assets. Stay alert!
The warehouses of computer servers powering artificial intelligence are growing so fast that their electricity appetite is beginning to reshape household budgets.
The CEO of the company supplying most of the hardware in those facilities just laid out a projection that makes the current spending look modest by comparison.
Jensen Huang, who cofounded Nvidia (NVDA) and still runs the company, has told investors across multiple recent earnings calls that he expects global annual data-center capital expenditure to reach $3 trillion to $4 trillion by the end of the decade, CNBC reported.
On Nvidia’s first-quarter FY27 earnings call on May 20, Chief Financial Officer Colette Kress said the company expects to reach that target by the end of this decade.
Nvidia’s $4 trillion forecast dwarfs the Wall Street consensus
The gap between Huang’s projection and what most of Wall Street expects is striking and reveals the extent of disagreement about the trajectory of artificial intelligence spending over the next several years.
Needham analyst Laura Martin noted in a recent research report cited by CNBC that industry participants expect hyperscale cloud providers to reach about $1.03 trillion in annual capital expenditure by 2028, making Huang’s figure roughly four times the prevailing consensus.
Martin described Huang’s forecast as different from the scenarios outlined by the cloud providers themselves and more ambitious in scope.
Bank of America analyst Vivek Arya now projects the total addressable market for AI data-center systems will reach approximately $1.7 trillion by 2030, according to Investing.com, up from a prior estimate of $1.4 trillion. The 21% revision reflects how quickly spending assumptions are shifting.
Nvidia’s growth supports the scale of Huang’s ambition
Huang speaks from the industry’s center, where he has a front-row view of its trajectory.
Nvidia posted $81.6 billion in revenue during its most recent quarter, an 85% increase from the same period a year earlier, according to the company’s first-quarter fiscal 2027 results. Data-center revenue alone surged 92% year over year to $75.2 billion.
Nvidia’s market capitalization currently sits near $4.9 trillion, trading neck-and-neck with Apple, as CNBC reported. Apple briefly overtook Nvidia in intraday trading on July 17 for the first time in more than a year before Nvidia reclaimed the lead by the close, according to Bloomberg data.
Morgan Stanley analyst Joseph Moore wrote in a March research note cited by TipRanks that Nvidia’s stock has stalled despite improving fundamentals, weighed down by doubts about its longevity.
For the last two quarters, NVIDIA has not moved while business has continued to strengthen — a function of concerns about the durability of current growth.
If Huang’s spending forecast proves accurate and Nvidia maintains even a reduced share of that market, the math for a $20 trillion valuation becomes straightforward, since the company would only need to roughly quadruple from its current level.
Joseph Moore noted that Nvidia accounts for approximately 85% of AI processor revenue, with AMD at less than 5% and custom-designed chips from hyperscalers at just above 10%, noted Investing.com.
Hyperscalers are signing three-year supply contracts, some with full upfront prepayments, which Moore described as a durability signal that is hard to square with the idea that spending will slow down soon.
NVIDIA guided to $91 billion in second-quarter FY27 revenue, roughly 95% higher than the year-ago quarter, with the outlook assuming no data center compute revenue from China due to ongoing export restrictions.
Nvidia’s explosive AI growth and dominant market position strengthen Jensen Huang’s bold vision of a potential $20 trillion company valuation.Bloomberg/Getty Images
How the AI infrastructure wave hits your household budget
For most people, Nvidia’s revenue figures and market-cap projections might feel distant from daily life, but the infrastructure buildout behind those numbers is already producing costs that are landing on kitchen tables across the country.
Goldman Sachs analysts Manuel Abecasis and Hongcen Wei forecast that consumer electricity inflation will run at approximately 6% through 2026 and 2027, before easing to around 3.5% in 2028 as natural gas prices decline.
More Nvidia:
Data centers account for roughly 40% of total electricity demand growth over the next five years, the Goldman Sachs research team found, and the burden does not fall equally across income levels.
“The income and spending drags will likely be larger for lower-income households because electricity accounts for a greater share of their spending,” Abecasis wrote in a Goldman Sachs research note, adding that households near large clusters of data centers face even steeper increases.
Linglan Wang, director analyst at Gartner, projects worldwide data-center power demand will rise 27% in 2026 alone, reaching 132 gigawatts, and could climb to 290 gigawatts by 2030. Wang attributes the scale of the buildout to the unprecedented pace of generative AI adoption.
The broader economic ripple effects of AI spending
Higher electricity prices are not the only channel through which this spending wave reaches consumers.
Goldman Sachs analysts found that rising utility costs will increase core inflation by 0.1% in both 2026 and 2027, with the largest fraction of that uptick flowing into medical services, food services, and secondary pass-through into new vehicle and clothing prices as businesses absorb higher energy costs.
Consumer spending growth could decline by 0.2% through 2027 as higher electricity bills reduce disposable income, the Goldman team projected, contributing to a 0.1% drag on overall economic growth.
Nvidia’s China wild card could amplify the growth trajectory
One factor not yet reflected in Nvidia’s financial guidance is the potential reopening of its Chinese market.
Under Secretary of Commerce for Industry and Security Jeffrey Kessler told the House Foreign Affairs Committee on July 14 that “very few” Nvidia H200 chips have been shipped to China, CNBC reported. Analysts have interpreted his comment as a signal that limited sales are resuming after years of export restrictions.
If regulatory barriers between Washington and Beijing continue to ease, the Chinese market would add a growth channel that Nvidia has entirely excluded from its revenue forecasts, potentially accelerating the company’s path toward Huang’s broader infrastructure-spending projection.
Even if Nvidia never hits $20 trillion, the spending behind that bet is already rippling out past Wall Street, into utility bills, grocery receipts, and job postings across the economy.
Colette and Andy Bell started a handyman business in 1998 to tackle small projects for homeowners.
In 2018, they connected with Ace Hardware, which purchased their business in 2019.
Colette is now the vice president of franchise development for Ace Handyman Services, and she continues to lead expansion.
Colette Bell and her husband, Andy Bell, started a handyman business in Denver, Colorado, in 1998 after identifying a unique need.
They found that big specialty contracting companies did not want to do small projects for homeowners. For example, if someone had one sticky window and called a window company, the firm wanted to sell them 25 new windows for their house.
“We found that homeowners had a really hard time finding somebody professional and reliable for small projects,” Colette tells Entrepreneur in a new interview. “That was the niche market we built this business to serve.”
They knew immediately that they had struck gold. Their first year in business, the company “just took off like a rocket,” Colette says.
Andy and Colette Bell. Credit: Ace Handyman Services
They ended up franchising the business, called Handyman Matters, in 2001. Andy led the business as CEO while Colette took on multiple leadership roles over the years, including chairman of the board. In 2018, they connected with Ace Hardware, which acquired the business in 2019.
“This is the only career I’ve had my whole life,” Colette says. “For 28 years, I’ve been working on the handyman business.”
Andy is now the CEO and president of Ace Handyman Services, and Colette is the vice president of franchise development, a position she has held since 2019. She continues to lead expansion, helping the brand grow from 119 territories at the time of its 2019 acquisition to 383 territories as of April this year, more than tripling its footprint.
Ace Handyman Services grew by 12% from 2024 to 2025, with total sales exceeding $113 million in 2025.
The following interview with Colette has been lightly edited for clarity and concision.
Colette Bell. Credit: Ace Handyman Services
Growth tactics
What were the main factors that allowed the company to grow so quickly? What did you do to facilitate growth? We set exact appointment times and coach our employees that “if you’re not early, you’re late.” They need to arrive on time, look professional and wear logoed shirts. If they walk up and see the trash cans still at the curb after pickup, we coach them to move the cans back up the driveway — little things that show we’re there to help with the whole house, not just a single project.
We do extensive follow-up: calling the day after to make sure the customer is happy, and again at 11 months because we offer a one-year warranty. Adding that high level of customer service to a low-tech, fragmented industry made a big difference.
Getting things right with franchising
Looking back at that 2001 decision to franchise, what did you get right about franchising, and what did you underestimate about how hard it would be? We underestimated everything. But we did get a couple of important things right. One was creating protected territories for franchise owners delineated by ZIP codes. ZIP codes are clearly defined by the post office and have accessible demographic data, so we could build territories using that data. Franchise owners then had protected territories and didn’t have to worry about competition from neighboring owners. We did that from day one.
The other thing we did right, which was more accidental, was our billing model. Even though we’re a handyman business and construction often estimates projects as fixed dollar amounts, we decided to bill customers using a time-and-materials format. Time is universal — an hour is an hour everywhere. Pricing, on the other hand, varies significantly between, say, Connecticut and Arkansas or Illinois and California. Instead of trying to force one universal price structure across the U.S., we made time the constant and allowed each owner to choose their own hourly rate.
That made the business much more feasible in different markets. About 85% of our work is labor and only about 15% is materials, because we focus on small repairs and restorations, not large remodels.
Choosing franchising over corporate locations
What convinced you that this idea would scale better through franchising than through company-owned locations? We learned that firsthand when we expanded to California. At one point, we were effectively running six corporate locations — three in Colorado and three in California. We quickly realized we couldn’t give every employee, and therefore every customer, the time and leadership they deserved.
It was clear this business model should be available across the U.S. Every homeowner deserves a professional, reliable handyman service for small projects, but there was no way we could build that nationally as a purely corporate chain — especially since we started in our basement with $10,000, every bit of savings we could scrape together.
The franchise model made national expansion possible because it relies on local owners rooted in their communities. Handyman businesses are very community-centric; you’re basically working for your neighbors. Franchising fits the model perfectly.
The biggest surprise about franchising
What is something about franchising that surprised you? The biggest surprise — though everyone tells you this upfront — is how much the success or failure of the business model depends on the relationship between franchisor and franchise owners. Until you’ve lived it, that doesn’t fully sink in. This relationship has to be strong and reciprocal. It can’t just be the franchisor giving and the franchise owners taking; franchisees also need to contribute ideas and feedback.
Early on, we had franchise owners with fantastic business ideas we never would have developed on our own, and they were willing to share them so we could roll them out systemwide.
A great example was during Covid, when the whole country shut down, and no one could enter customers’ homes. We spent that downtime on conference calls with franchise owners, figuring out how to make the business as touchless as possible.
For instance, we used to take customer signatures on invoices. During Covid, we shifted to reading the contract language aloud and recording “verified by voice” instead of a signature.
Franchise owners helped design new standard operating procedures, which we rolled out to everyone. So when we were designated essential in April and could return to homes, we had safer, smarter procedures in place. That level of support and collaboration is critical in franchising.
The ideal franchisee
For an entrepreneur evaluating Ace Handyman, how do you define the ideal franchisee in terms of background, skills and mindset? Our owners come from all kinds of backgrounds. One of our top franchisees is a former horticulturalist. We have people from finance, marketing, plant management, a large number of veterans, former teachers, and former coaches and mentors.
The through line is a passion for improving their community and strong leadership skills. As an owner, you don’t go to every customer’s house; our volume is too high for that. The way you deliver great service is through your employees, which means you must be an excellent leader. That includes paying good wages, providing training and mentoring and offering real growth opportunities. Leadership is at the heart of our most successful franchisees.
For us, a red flag is when a prospective owner focuses more on money than culture and people. Our business has robust numbers — you don’t grow otherwise — but if the primary focus is financial, it typically isn’t a good fit.
How much does it cost to start an Ace Handyman franchise? In our 2026 franchise disclosure document, Item 7 shows startup costs ranging from $132,200 on the low end to $226,000 on the high end. That includes a $70,000 franchise fee.
Long-term vision
When you imagine Ace Handyman Services 10 years from now, what does success look like for the brand, for individual owners and for the customers they serve? First, success means our current franchise owners are still here. Longevity is very important in franchising. Ace has always believed in generational businesses; many hardware stores have been passed down from great-great-grandparents through multiple generations.
In our system, we already have franchise owners who’ve been with us 24 years. I’m very proud of that. They stuck with us when we were young and figuring things out and contributed ideas, passion and suggestions. We’ve seen transitions where a father handed the business to his daughter and uncles passed locations to nephews.
My goal for the next 10 years is that we’ll not only expand to cover perhaps half of the U.S., but also see more of our locations become generational businesses, with kids taking over for their parents. That kind of longevity would be a real measure of success.
Key Takeaways
Colette and Andy Bell started a handyman business in 1998 to tackle small projects for homeowners.
In 2018, they connected with Ace Hardware, which purchased their business in 2019.
Colette is now the vice president of franchise development for Ace Handyman Services, and she continues to lead expansion.
Colette Bell and her husband, Andy Bell, started a handyman business in Denver, Colorado, in 1998 after identifying a unique need.
They found that big specialty contracting companies did not want to do small projects for homeowners. For example, if someone had one sticky window and called a window company, the firm wanted to sell them 25 new windows for their house.
“We found that homeowners had a really hard time finding somebody professional and reliable for small projects,” Colette tells Entrepreneur in a new interview. “That was the niche market we built this business to serve.”
Strategy (MSTR), the world’s largest corporate bitcoin BTC$65,084.23 holder, raised its cash reserve by roughly $225 million last week after selling common stock, bolstering liquidity while leaving its bitcoin holdings unchanged.
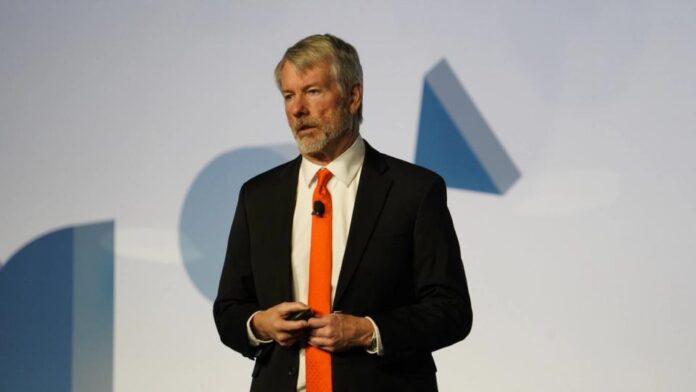
Michael Saylor, executive chairman of the firm, said Monday that Strategy now holds a U.S. dollar reserve of $3.225 billion alongside its 843,775 BTC stash.
A regulatory filing showed the company sold over 2.7 million MSTR shares for roughly $263.5 million through its at-the-market equity program.
MSTR was 1.2% higher at $96 in pre-market trading alongside a small rise in the price of bitcoin over the weekend to the current $64,700.
The latest update comes as Strategy has focused on rebuilding its cash buffer after its increasingly complex financing model and dividend-paying preferred stock structure came under pressure during the recent crypto market downturn.
Earlier this month, the company disclosed the sale of about $216 million worth of bitcoin, a rare reduction in its BTC holdings that marked its first significant sale after years of near-continuous accumulation. Before that, the firm approved a new bitcoin monetization program that included selling up to $1.25 billion of its BTC stash to boost cash reserves and fund dividend payments.
Strategy remains the world’s largest corporate bitcoin holder by a wide margin. At bitcoin’s current price of $64,700, its 843,775 BTC treasury is worth nearly $55 billion.
AMBCrypto reported recently that Bitcoin [BTC] miners were struggling. Miners were under significant pressure, and data aligned with historical bear-market conditions.
Bitcoin has been in a bearish trend since the crash on October 10, 2025. It is unclear when the bear market low would arrive, but there are some criteria to watch out for.
Then there’s the question of how high the leading crypto can go in the next run, which is much harder to answer. What is the Bitcoin price prediction for 2030?
Handling the bear market bottom- the role of stablecoins and fractals
Source: CryptoQuant
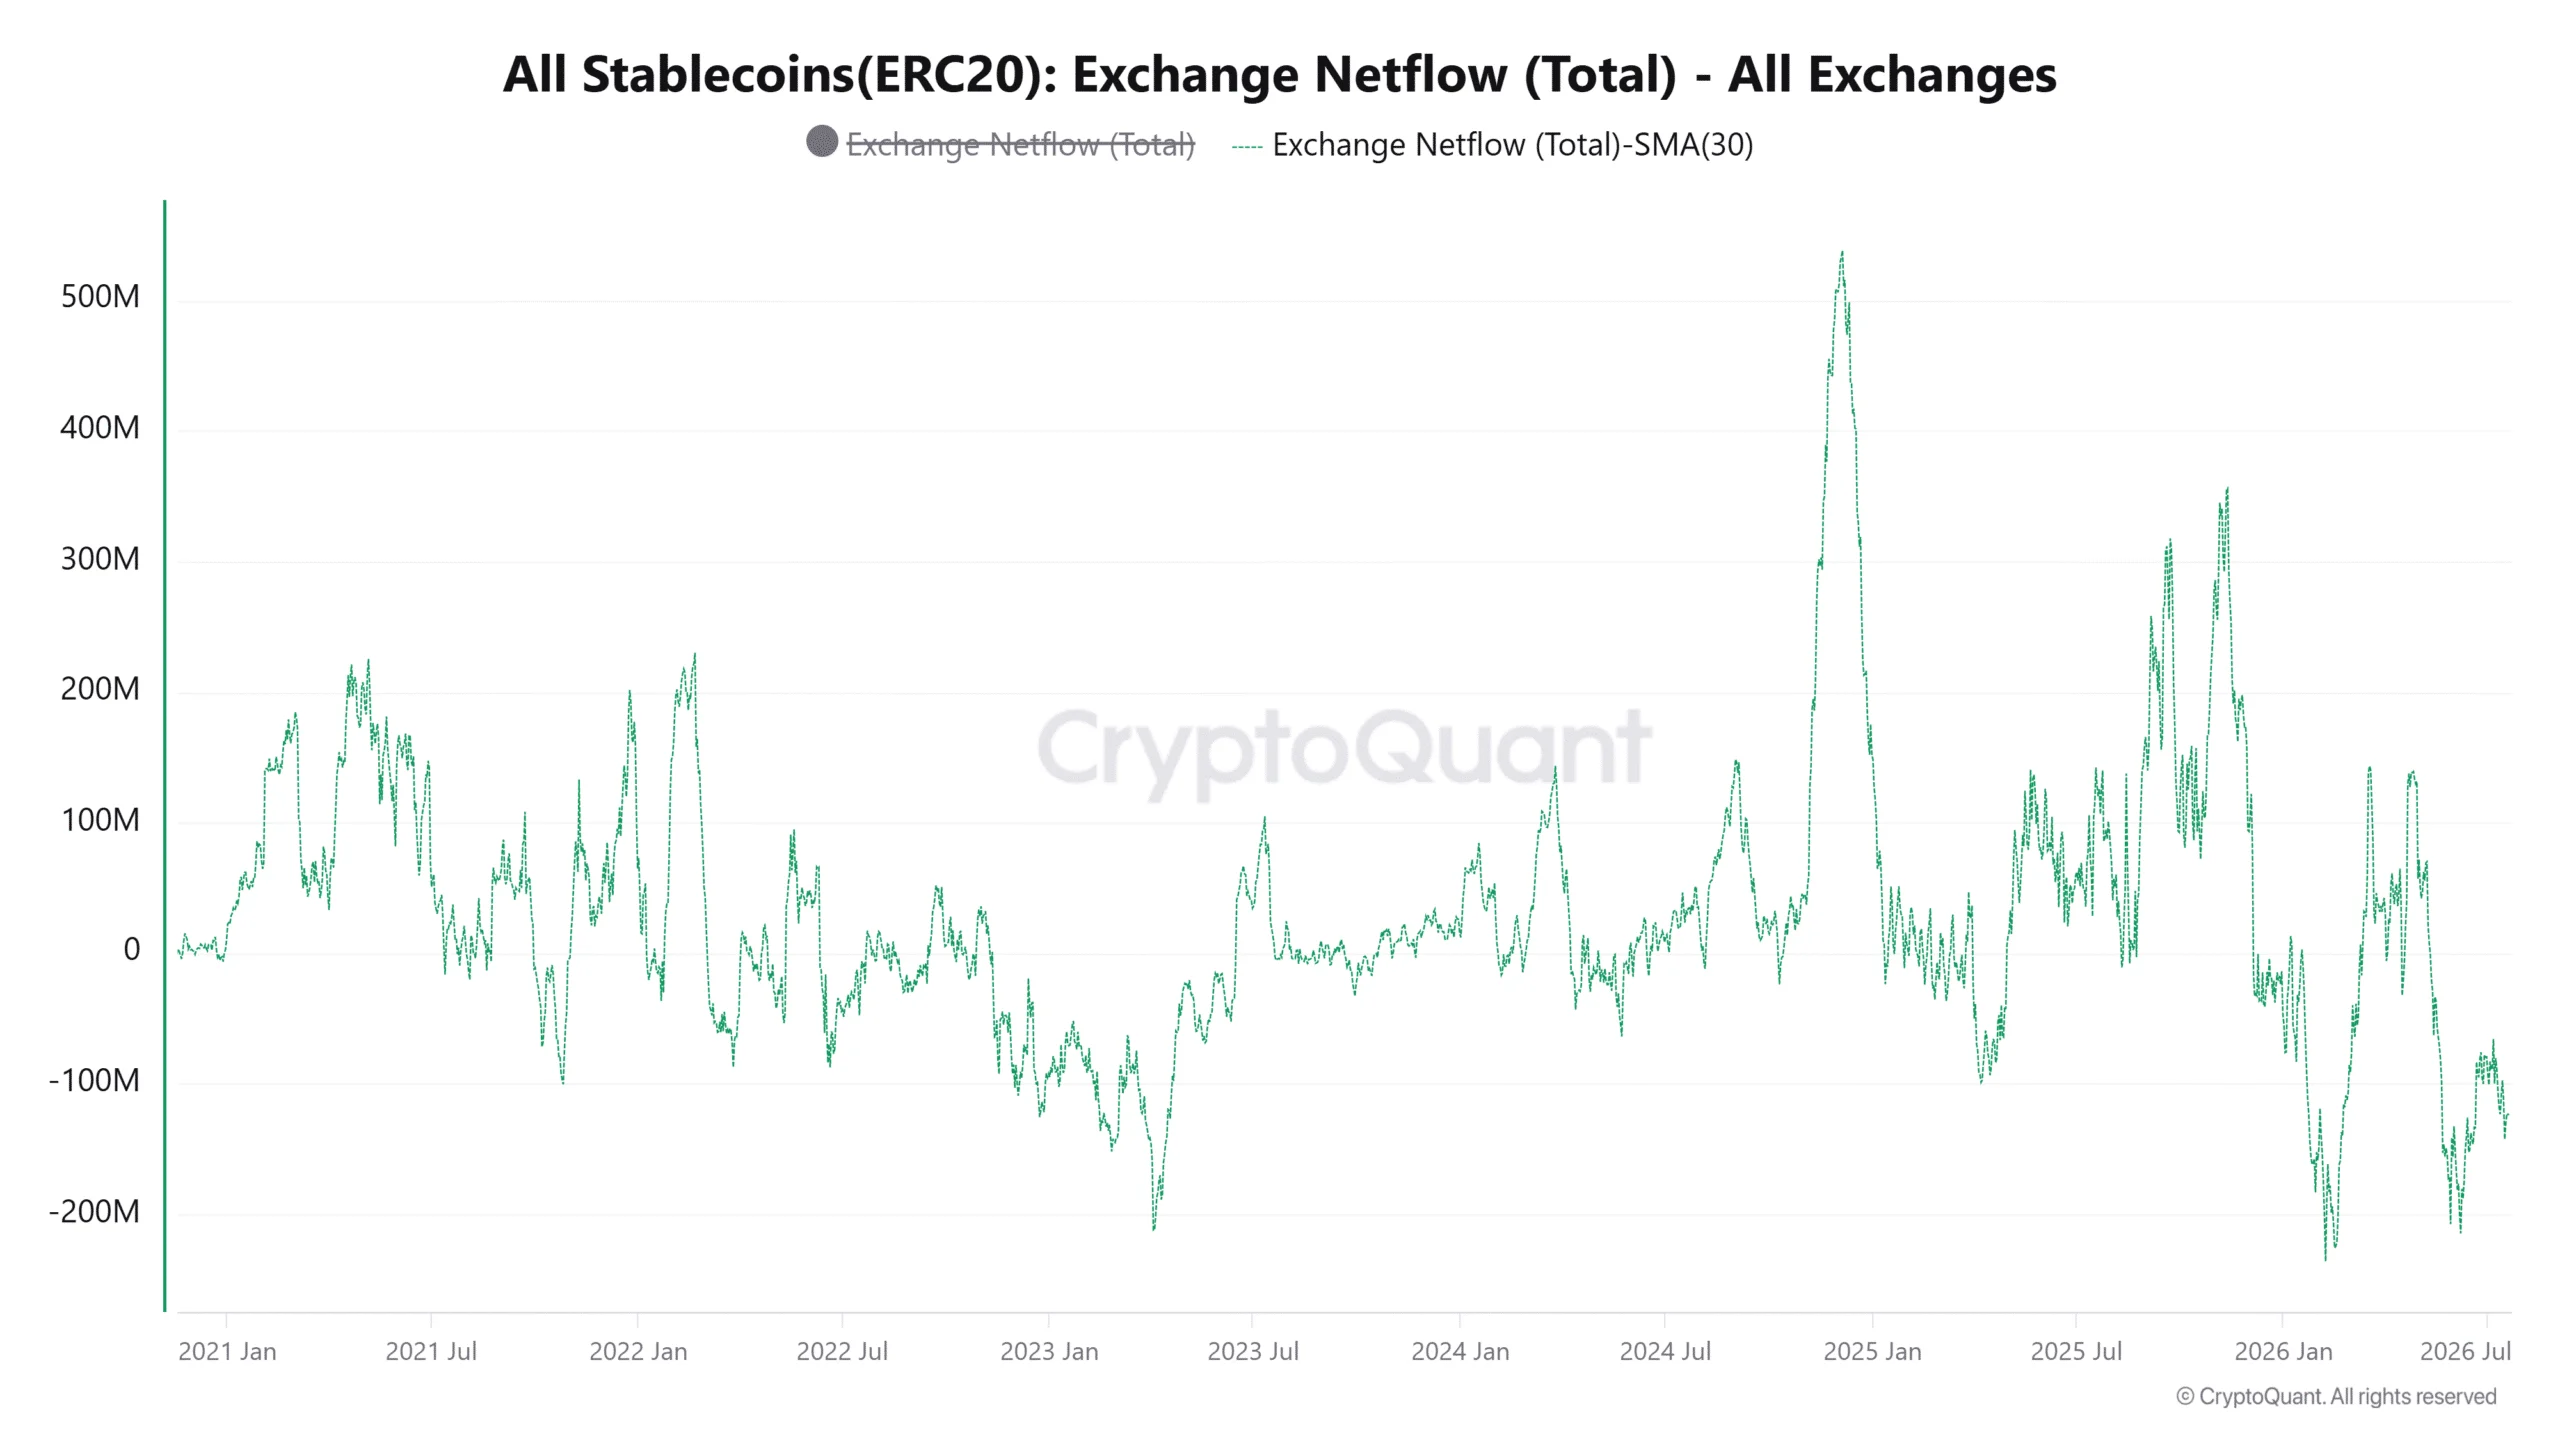
Like a rocket needs fuel for its launch, crypto needs stablecoin inflows to exchanges to power a bull trend. We saw this in April 2021, for example.
High stablecoin inflows [the metric above uses the 30DMA to smooth out the data] in late 2024 and July-October 2025 coincided with powerful upward Bitcoin price moves.
At present, monthly average exchange netflows were negative. This trend needs to be positive to signal a sentiment shift. Powerful spikes will likely coincide with high bullish enthusiasm.
Source: Joao Wedson
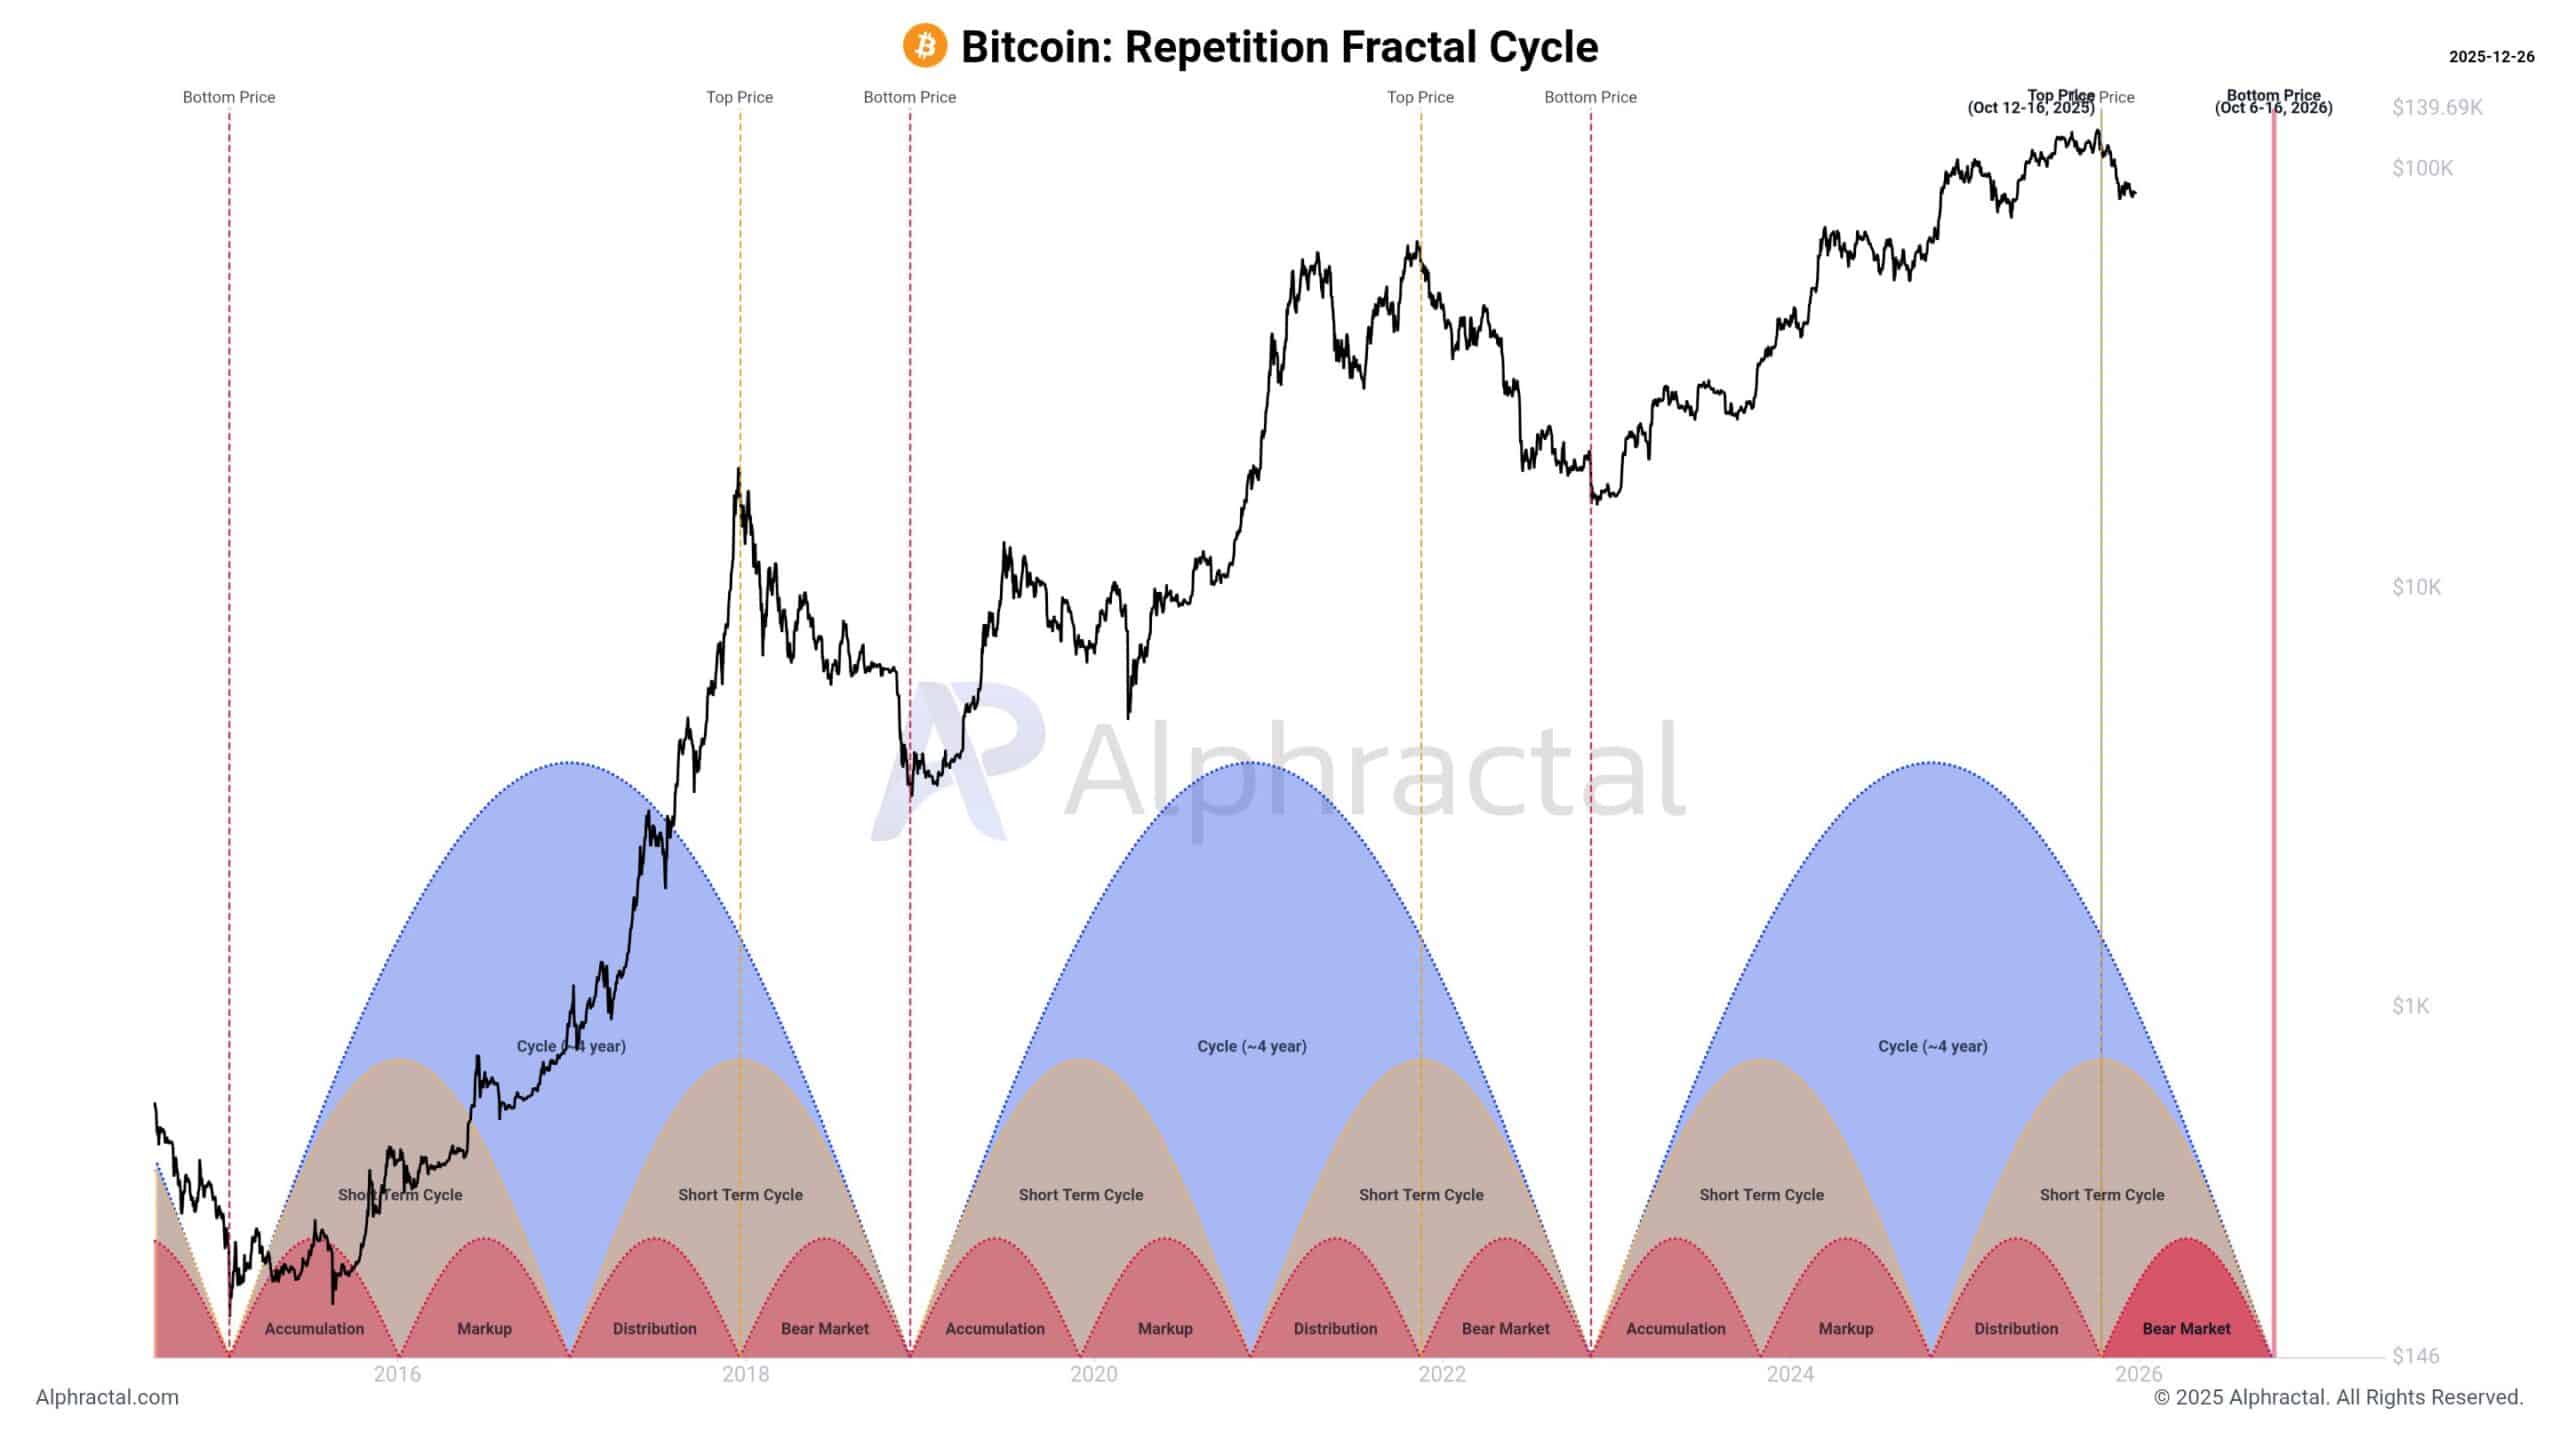
The founder and CEO of crypto intelligence platform Alphractal shared in a post on X that $41.5k-$45k will mark this cycle’s bottom, and will arrive sometime in the first half of October 2026.
It was not a deterministic prediction, but only based on historical symmetry.
Looking ahead to the Bitcoin price prediction for 2030
Institutional adoption is likely to accelerate. Massive entities accumulating Bitcoin, such as Strategy, can influence the next cycle. As crypto matures, its cycles might not be as explosively bullish as it had been in the past.
Source: BTC/USDT on TradingView
Technical analysis and a focus on price action alone could clear some of these doubts, although there is the caveat that it is in no way an accurate model.
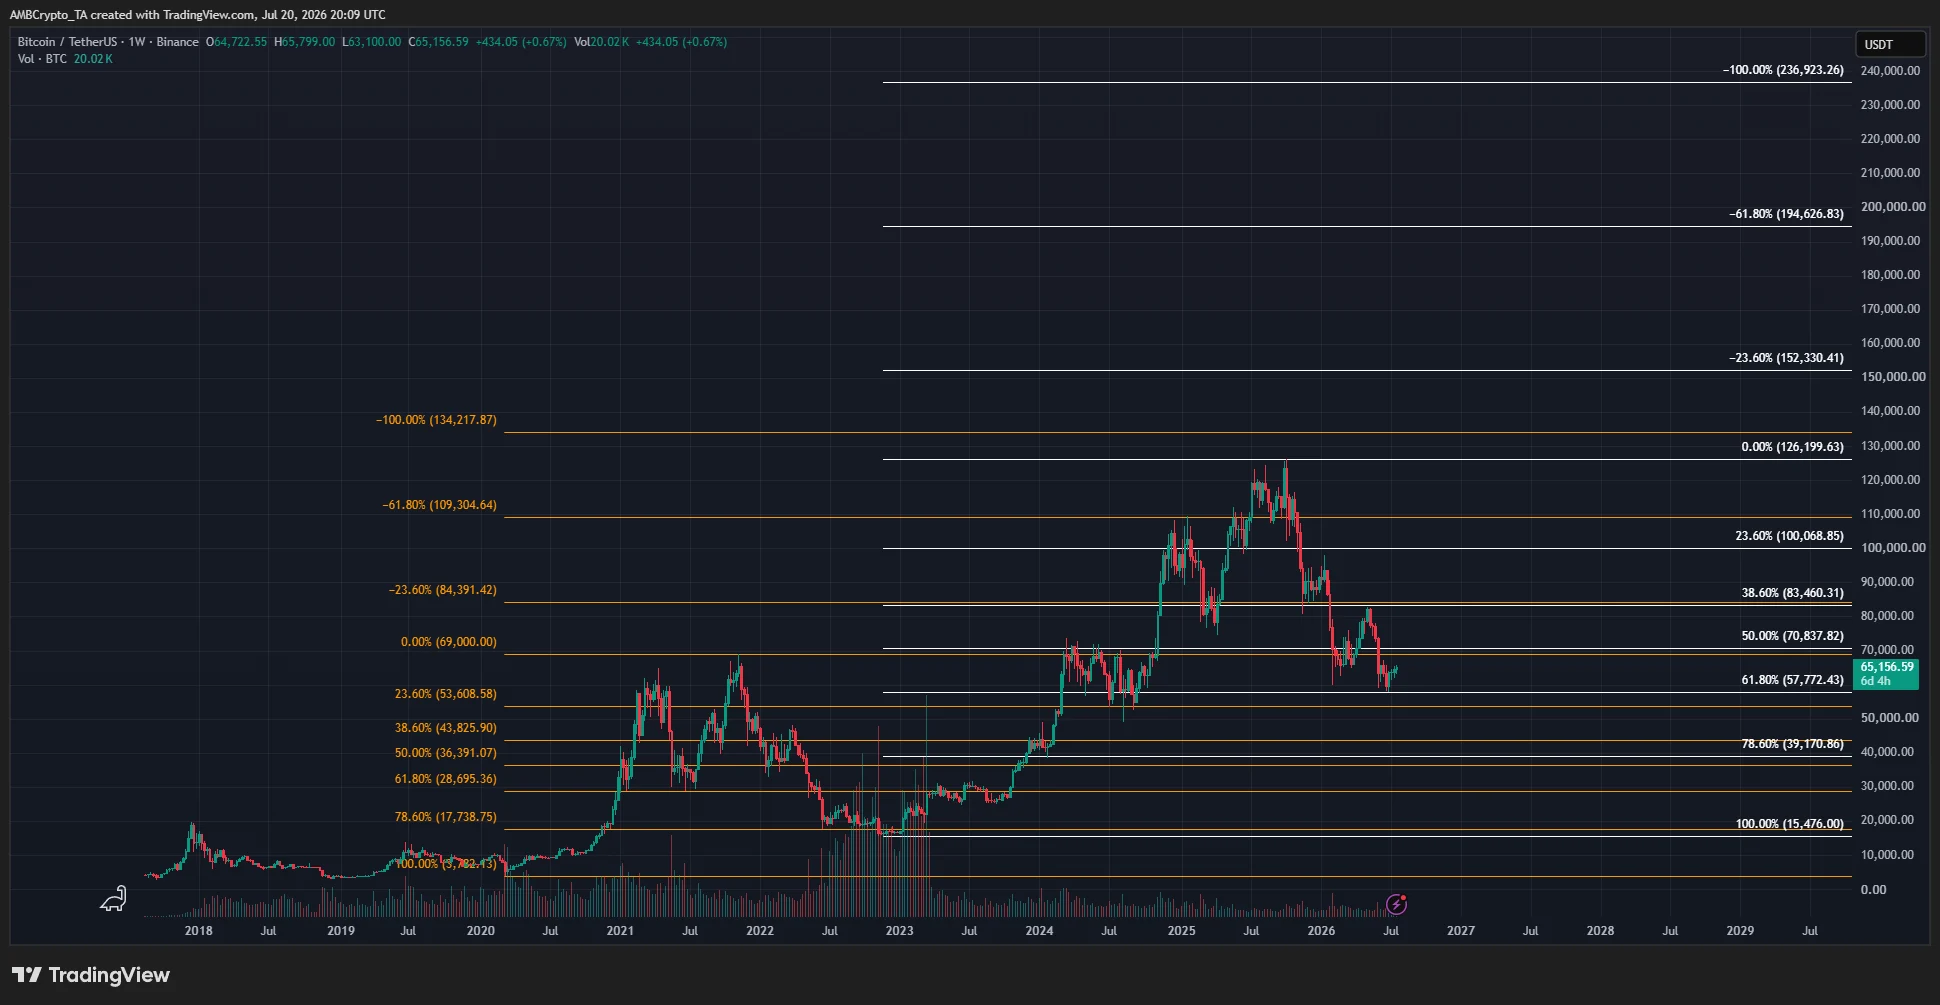
The 2020-2022 run retraced to just under the 78.6% Fibonacci retracement level [orange, $17,738] before resuming the long-term uptrend. This uptrend extended beyond the 61.8% extension level, reaching $126.2k.
Currently, BTC is in a retracement phase.
If a similar scenario to the previous cycle develops, investors can expect a pullback to $39.1k [white, the Fibonacci retracement levels based on this cycle], which is not far from the $49.5k target analyst Joao Wedson had presented.
Such a pullback could then push beyond the 61.8% extension level at $152.3k.
A high of $200k-$220k could be reached by 2030 before Bitcoin enters its next bear cycle. Investors should remember that the cycle might take longer to complete. The previous cycle took almost twice as long to go from bottom to top, compared to the 2020 cycle.
Final Summary
Fractal analysis showed that Bitcoin could reach a market bottom in October 2026, projected popular crypto analyst Joao Wedson.
Stablecoin flows to exchanges are something to watch, and high inflows would be needed to drive Bitcoin to the $200k target, derived using Fibonacci extension levels.
Wondering how your retirement savings stack up against the rest of the country? While everyone’s financial situation is different, retirement account balances vary dramatically depending on where you live.
Retirement savings by state
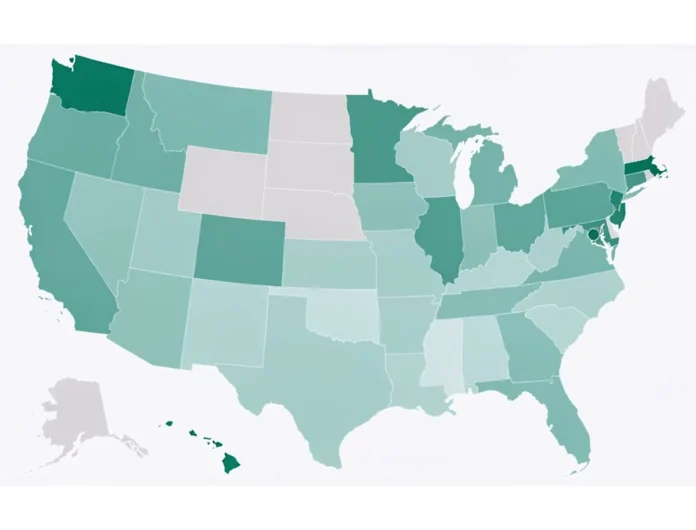
The latest U.S. Census Bureau data highlights where Americans are the most — and least — prepared for retirement. Explore the map below to see how your state compares.
Note: The data in this map is based on median savings; a relatively small number of households with multimillion-dollar accounts can pull the average upward, making it appear that the typical resident has more saved than they actually do. The median represents the midpoint — half of households have more saved, and half have less — providing a more realistic picture of what a typical household in a state has accumulated.
Where you live impacts your retirement savings
Although general guidelines provide a target for retirement savings, several factors can influence how much you need to save for retirement and how long it may take to reach your goal. One of the biggest is the cost of living.
Planning to retire in a relatively expensive state, such as California, Hawaii, or New York, may require a larger nest egg. That’s because higher housing, grocery, utility, healthcare, and transportation costs can increase the amount of income you’ll need to maintain your desired lifestyle in retirement.
The good news: Wages also tend to be higher in more expensive states, which may give workers more money to contribute to retirement accounts. For example, California has the highest cost of living in the country — 10.7% higher than the national average. However, it also has one of the highest average hourly earnings according to the BLS. That said, higher pay doesn’t always fully offset a higher cost of living.
Taxes can further affect how much workers are able to save. For one, the more you earn, the more of your income is taxed. Plus, state income tax rates and rules vary considerably, and some states don’t have an individual income tax at all.
Taxes in retirement also matter, since states differ in how they treat withdrawals from retirement accounts, pensions, and Social Security benefits.
Here’s a look at the states with the highest median retirement savings.
Maryland
In Maryland, the median retirement savings balance is $120,000. The cost of living in this state is 5% higher than the national average. It has a higher median home price of $448,407 — nearly $50,000 higher than the national average, according to Redfin. The top marginal tax rate is 5.75%.
New Jersey
New Jersey came in as the 4th state with the highest retirement account savings at $134,000. The cost of living in this state is almost 10% higher than the national average. It has a higher median home price of $563,000, according to Redfin. This state also has one of the highest top marginal tax rates at 10.75%.
Washington
In Washington, the median retirement savings balance is $143,400 — the third highest in the country. Cost of living is the sixth highest in the US at 7% higher than the national average. The median home price in Washington is a staggering $612,823 and the top marginal tax rate is 7%.
Hawaii
Hawaii’s median retirement savings account balance is $149,000. Along with ranking highly in terms of retirement savings, it also has the second-highest cost of living out of all U.S. states. Median home prices in Hawaii hover just over $722,000 and the top marginal tax rate is 11%.
Massachusetts
The state with the highest median retirement savings is Massachusetts at $150,000. Fortunately for retirees in this state, the average cost of living doesn’t even make the top 5. The cost of living in Massachusetts is 5.8% higher than the national average. The median home price in Massachusetts is $667,628 and the top marginal tax rate is 9%.
States with the least retirement savings
Here’s a look at the states with the lowest average retirement savings.
Louisiana
In Louisiana, the median retirement savings balance is $50,000. However, it also has one of the lowest costs of living in the country at 11.8% below the national average, as well as one of the lowest average median home prices in the nation at $259,977 according to data from Redfin. That’s compared to the national average of $398,771. Louisiana also has a top marginal tax rate of 3%.
New Mexico
In New Mexico, the median retirement savings balance is $50,000. Cost of living in this state sits at 7.8% below the national average. New Mexico’s average median home price is $357,729 according to data from Redfin. This state has a top marginal tax rate of 5.9%.
Alabama
The state of Alabama has a median retirement account savings of $46,000. The cost of living in this state is 11.2% below the national average. Alabama’s median home price is $307,408 according to data from Redfin. This state has a top marginal tax rate of 5%.
Oklahoma
Oklahoma’s median retirement account savings sits at $39,450, the second-lowest of all U.S. states. The cost of living in this state is 12.2% below the national average. Oklahoma’s median home price is $264,062 according to data from Redfin. This state has a top marginal tax rate of 4.75%.
Mississippi
Mississippi took the spot for the lowest retirement savings balance of all states with a median of $35,000. The cost of living in this state is 13% below the national average. Mississippi’s average median home price is $281,002 according to data from Redfin. This state has a top marginal tax rate of 4.4%.
It’s impossible to predict exactly how much you’ll need to retire comfortably because so many factors — from your future expenses to inflation and healthcare costs — can change over time. However, you can build a retirement plan based on what you know today and adjust it as your circumstances evolve.
When deciding on a target savings goal, you should consider:
Desired lifestyle
Where you plan to retire and the day-to-day lifestyle you hope to lead will determine how much you need to save.
Living expenses tend to decrease as people age, but this isn’t always the case. So, it’s important to consider all possibilities when calculating how much you need to feel financially secure in your later years.
Carefully consider your current expenses, how those might evolve over time, and what kinds of new expenses you may face as you age, such as healthcare or long-term care. When thinking about these costs, you should also account for inflation and how that may require that you pad your retirement account with extra funds.
Your retirement account may not be your only source of income in retirement. For many people, it’s just one piece of a broader financial plan. Social Security benefits, pensions, investment income, inheritances, and other assets can all affect how much you need to save in your retirement accounts. Considering these additional income sources can help you set a more realistic retirement savings goal.
Retirement timeline
If you’re aiming to retire early, this may mean saving more money and saving aggressively from an earlier age to hit your goals on time. However, if you plan to spend more years in the workforce, this will give you a bit more time and flexibility and reduce the number of retired years you need to save for.
Bitmine (BMNR), the largest Ethereum treasury firm, bought just 7,430 ether (ETH) last week, dialing back its buying spree as it redirected capital to a stock buyback.
The latest purchase, worth about $14 million at ether’s current price of $1,879, lifted BitMine’s holdings to 5,78 million ETH, or roughly 4.8% of Ethereum’s circulating supply, according to a Monday company update.
BMNR was 2.4% higher in pre-market trading.
The purchase marks one of firm’s smallest weekly additions since launching its Ethereum treasury strategy in June 2025. By comparison, the firm bought more than 111,000 ETH during one week in May and had regularly acquired tens of thousands of tokens throughout the first half of the year. The firm is nearing its goal to corner 5% of ETH supply.
Chairman Thomas “Tom” Lee attributed the slowdown to the company’s decision to repurchase approximately 5.5 million shares at an average price of $15.62 under its previously authorized $4 billion buyback program.
“The reduced pace of buys reflects that Bitmine repurchased 5.5 million common shares,” Lee said. He added that the company has purchased ETH every week since adopting its treasury strategy just over a year ago.