Home Blog Page 232

Probly Announces Its Prediction-Market Integration With TxFlow L1

0
Probly Announces Its Prediction-Market Integration With TxFlow L1


Probly, an on-chain prediction market application built around real-time events and changing expectations, today announced its deployment on TxFlow L1 through TxFlow Improvement Protocol 3, known as TIP3. At launch, Probly supports more than 5,000 events and 12,000 markets across six current categories: World Cup Sports, Geopolitics, Crypto, Finance, Economy, and Politics. As of July 13, 2026, Probly has 172 active live markets available for same-day trading, led by high-frequency Crypto “Up or Down” rolling markets across BTC, ETH, SOL, and XRP. These markets run across five-minute, 15-minute, one-hour, and four-hour cycles, with each live market marked by a LIVE badge and real-time countdown. Sports live markets are expected to roll out next.

Before It Happens: Onchain Signals for What Comes Next

The name Probly comes from “probably,” the word people use when the outcome of an event remains uncertain. It is also inspired by P(A), the mathematical notation used to represent the probability of an event. Each Probly market reflects changing expectations based on ongoing market activity and newly available information.

Before an event reaches its final outcome, the interface shows how its associated probability indicator develops over time. Probly brings together live event information, probability movements, event timelines, countdowns, and resolution details within a streamlined interface designed to reduce the technical complexity commonly associated with onchain applications.

Probly’s current market scope spans World Cup Sports, Geopolitics, Crypto, Finance, Economy, and Politics, with category classification subject to ongoing adjustment as the platform expands. Its live market offering currently focuses on continuously refreshed short-duration crypto prediction markets referencing BTC, ETH, SOL, and XRP. Probly is also the first prediction market application developed through TxFlow Improvement Protocol 3, or TIP3. TIP3 is the TxFlow L1 standard that defines how prediction market Channels connect to the network. Probly uses TxFlow L1 for application execution and to record relevant market, resolution, and settlement data on-chain.

The Rise of Onchain Prediction Markets Across Crypto and Real-World Events

Prediction markets are gaining greater attention as tools for organizing event-based information, measuring changing expectations and presenting real-time probability signals. The sector includes widely discussed platforms such as Polymarket and Kalshi. Their visibility has contributed to broader media and industry interest in prediction markets, event markets, collective intelligence, probability forecasting and real-time event information.

Probly enters the sector with a different technical architecture, operating as an on-chain application built directly on TxFlow L1 through TIP3. Under this model, probability indicators, market records, resolution information, and USDC settlement processes can operate within a connected blockchain infrastructure environment.

Probly. Before It Happens.

Media Contact

PR Manager

torygarcia@probly.com

Important Notice

This announcement is provided for general informational purposes only. It does not constitute an offer, solicitation, recommendation or invitation to enter into any transaction, event contract, wager, derivative, or other product.

Nothing in this announcement constitutes investment, financial, legal or trading advice. References to market information, probability indicators, settlement infrastructure, or product functionality should not be interpreted as a recommendation to participate in any market.

References to third-party companies, platforms and products are provided solely for general industry context. They do not imply affiliation, endorsement, or partnership.

Probly’s availability, functionality, event coverage, account features, wallet support and eligibility requirements may vary by jurisdiction. Access is subject to applicable laws, regulations, product rules, geographic restrictions and eligibility requirements.

No person should access or use the application in a jurisdiction where doing so would be prohibited or would require an authorisation that has not been obtained.

Disclaimer: This is a paid post and should not be treated as news/advice.  


Source link

Bitcoin and ethereum prices today, Thursday, July 16, 2026: Prices rise, ethereum becomes ‘increasingly compelling’

0
Bitcoin and ethereum prices today, Thursday, June 18, 2026: Prices sliding despite Iran peace deal


Bitcoin (BTC-USD) opened at $64,720.36 on Thursday, July 16, 2026, down 0.4% from Wednesday’s opening price. The value of bitcoin fell to $64,065.98 by 8:26 a.m. ET.

Ethereum (ETH-USD) opened at $1,917.05, up 1.5% from yesterday’s opening price. The price of ethereum moved down to $1,877.39 by 8:26 a.m. ET.

The prices of bitcoin and ethereum are having a bit of a shining moment this week, just as gold and silver prices continue to struggle. Since the softer-than-expected CPI report earlier this week, crypto prices have found significant room to rise.

Some investors are growing increasingly confident in a crypto rebound, with ethereum leading the charge. And this isn’t the first time ethereum has led bitcoin in a price recovery.

Yahoo Finance’s Ines Ferré reports:

“I continue to believe the tactical backdrop for crypto is improving, with ETH increasingly standing out as one of the more attractive ways to express that view,” Fundstrat digital asset strategist Sean Farrell said on Tuesday night.

Ethereum, which has jumped 7% over the past five days compared to bitcoin’s nearly 2% rise, is becoming “increasingly compelling,” Farrell said, given the “historical precedent for ETH leading broader crypto recoveries.”

During the 2022 bear market, ethereum began outperforming bitcoin several months before bitcoin eventually reached its market bottom, suggesting a similar pattern could be emerging.

Read more: Bitcoin jumps to $65,000: ‘Backdrop for crypto is improving’

The price of bitcoin this morning was 0.4% lower than yesterday’s open. Here’s a look at how the opening bitcoin price has changed versus last week, month, and year:

  • One week ago: +4%

  • One month ago: -2.4%

  • One year ago: -45%

The all-time high for bitcoin was $126,198.07 on Oct. 6, 2025. The all-time low value for bitcoin was $0.04865 on July 14, 2010. 

The price of ethereum this morning was 1.5% higher compared to Wednesday’s open. Here’s a look at how the opening ethereum price has changed versus last week, month, and year:

  • One week ago: +1%

  • One month ago: +6.8%

  • One year ago: -38.9%

The all-time high for ethereum was $4,953.73 on Aug. 24, 2025. The all-time low value for ethereum was $0.4209 on Oct. 21, 2015. 

Bitcoin, ethereum, and other cryptocurrencies are rapidly evolving. Follow the latest developments from Yahoo Finance and others here.

A bitcoin or crypto credit card generally works just like any other credit card. When you apply and get approved, you’ll be assigned a credit limit, and you can use your card to make purchases. If you don’t pay your total balance by your card’s monthly due date, you’ll start to accrue interest at your assigned APR.

The difference is the types of rewards you’ll earn. Instead of earning airline miles, rewards points, or cash back on your spending, you’ll earn crypto. The percentage back you earn on each purchase — such as 3% back on gas or 2% back at restaurants — is converted from U.S. dollars to bitcoin or another cryptocurrency at the current market value. You can then access your rewards through your connected crypto account.

For example, say you make a $500 purchase that earns 3% bitcoin rewards. You’ll earn $15 in U.S. dollars on that purchase. With a bitcoin credit card, your $15 may be converted at the current bitcoin value (about 0.00014 bitcoin in October 2025) and deposited in your crypto account.

The biggest benefit of crypto rewards is the potential for growth over time. Let’s say you had a total bitcoin rewards balance worth $100 USD at the end of 2024. By early October 2025, the value of those same rewards would have increased to about $114 — even if you didn’t earn any additional rewards over that time.

Learn more: Do you need a bitcoin credit card? What you can gain (and lose) by earning bitcoin rewards on spending

Whether you’re brand new to tracking the value of bitcoin and ethereum or a more seasoned crypto investor, Yahoo Finance’s price-of-bitcoin chart and price-of-ethereum chart below show a visual history of how the currency’s value continues to move and evolve. 

More on crypto from the Yahoo Finance team: 


Source link

This $28 million ether ‘straddle’ bet aims to profit from pure market chaos

0
This $28 million ether 'straddle' bet aims to profit from pure market chaos

It shows that major participants are not just “long-only” or “short-only” speculators; they are increasingly treating volatility as a separate asset class and using complex options Greeks, specifically vega (sensitivity to volatility) and gamma (sensitivity to price acceleration), to extract profit from market turbulence.

Inside the $28 million straddle

Notional value represents the total market value of the underlying asset controlled by the trade, rather than the cash paid to enter it.

The straddle involved the purchase of 15,000 contracts, with each contract representing 1 ETH. The notional value, therefore, is calculated by multiplying 15,000 by the market price of ETH on the day of execution. That amount comes to roughly $28 million.

According to Laevitas, the trader paid a premium of $852,000 to establish this $28 million notional straddle. That premium represents the maximum amount at risk if ether remains range-bound or quiet through the July 24 expiry, leading to a “time-decay” in option value.

Now, turning to the maximum possible gain: it is theoretically unlimited. This stems from the fact that volatility itself has no upper bound, as asset prices can, in principle, move dramatically in either direction.

Caveat

While the prospect of profiting from a move in either direction is enticing, the high cost of entry and the relentless decay of time value serve as a stark warning.


Source link

Its Dividend Looks Secure, But Don’t Chase JPM Stock After Q2 Earnings. Here’s Why.

0
SpaceX IPO Aftermath Hits Virgin Galactic Hard. How to Play SPCE Stock Here.


Bank earnings season is back, and JPMorgan Chase & Co. (JPM) just set the tone. The bank reported its Q2 2026 results on July 14, and the numbers were stronger than most expected a month ago.

JPMorgan Chase & Co. posted GAAP EPS of $7.70, beating estimates by 31.7% and well above the $5.24 from a year ago. Still, the stock fell about 2% in pre-market trading after the bank raised its 2026 expense outlook to $107.5 billion from $105 billion.

More News from Barchart

The stock had already been running up into the report, trading close to its 52-week high of $343.45. As the first major bank to report each quarter, JPM often sets the tone for the sector. It also continues to offer a solid dividend, with a $6.00 annual payout and a yield around 1.75%, backed by strong earnings and capital.

Now that earnings are out, where does JPMorgan Chase & Co. go next, and is the dividend enough reason to stay invested if upside looks limited?

Inside JPMorgan’s Latest Financials

JPMorgan Chase & Co. is a broad financial services company with businesses across consumer banking, investment banking, trading, asset management, and payments. It makes money from both interest income and fees, which helps keep things balanced.

The stock has been steady, up 21% over the past year and 7.57% year-to-date (YTD).

www.barchart.com

It is not cheap though, trading at a forward price-to-earnings ratio of 14,66 times versus the sector average of 11.34 times, showing investors are willing to pay a premium for its size and consistency.

For income investors, the appeal is clear. JPMorgan Chase & Co. pays a $6.00 annual dividend with a 1.75% yield, and the payout ratio is just 26.36%, leaving plenty of room for coverage. The bank has raised its dividend for 15 straight years and last paid $1.50 per share on July 6. It also approved a new $50 billion buyback program in late June and lifted its dividend by 10% after clearing the Federal Reserve stress test.

The latest quarter backs all of this up. Revenue came in at $58.02 billion, up 27% year-over-year (YOY) and 13% above estimates, helped by strong equities trading. EPS was $7.70, beating expectations by 31.7%, while net income rose 41% to $21.2 billion, supported by gains from Visa shares and other investments. 


Source link

How BONK’s post-exploit moves could spur a price decline of 18%

0
How BONK's post-exploit moves could spur a price decline of 18%


Bonk [BONK] suffered an exploit of $20 million on 6th July. The memecoin project wrote that it was enabled by a “malicious governance proposal.” Soon after, security analysts flagged the exploited weakness as the project’s security failure.

BONK exploit token move
Source: CryptoS6 on X

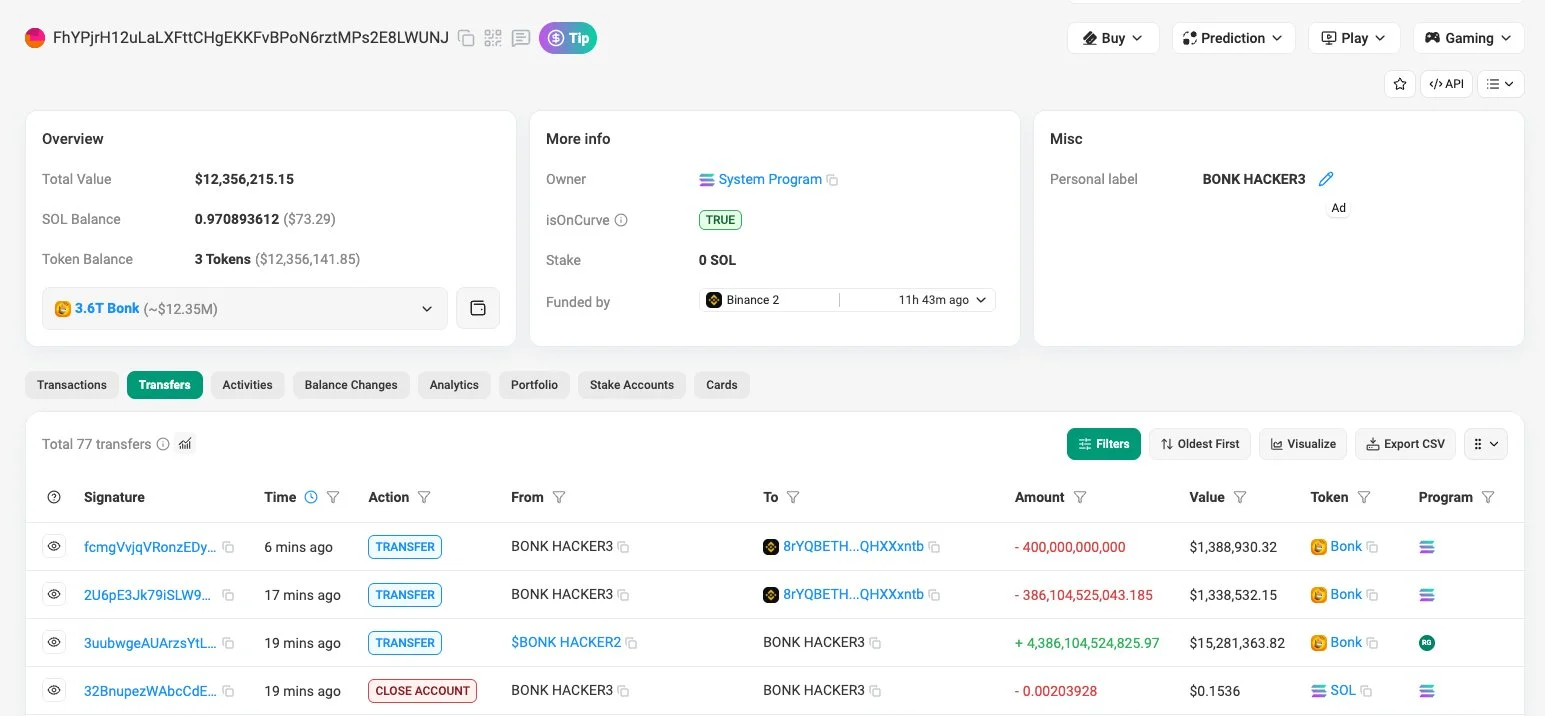
The BONK exploiter has continued to move funds though. Two transactions of around 400 billion BONK, worth $1.39 million and $1.34 million, were sent to the same Binance deposit address on Thursday, 16th July.

Now, the $2.73 million memecoin move does not confirm they were sold. However, they do suggest that the hacker was looking for an exchange exit.

BONK was already under severe bearish pressure, and the exploit earlier in July did its price action no favors. In the last 24 hours alone, the token has shed 6.72% of its value.

Remarkably, its daily trading volume was up by almost 120% too. Moreover, the Open Interest spiked by 30% in 24 hours. Sliding prices and rising volumes hinted at a notable uptick in selling pressure.

Can BONK holders hold on?

Since rallying to a swing high of $0.0000134 in the first week of January earlier this year, BONK has shed 74.18%. Even the early January rally was part of a broader downtrend the memecoin has been on since early February 2025.

Holders have no choice but to hold their losses or sell at extreme drawdown levels.

BONK 1-day ChartBONK 1-day Chart
Source: BONK/USDT on TradingView

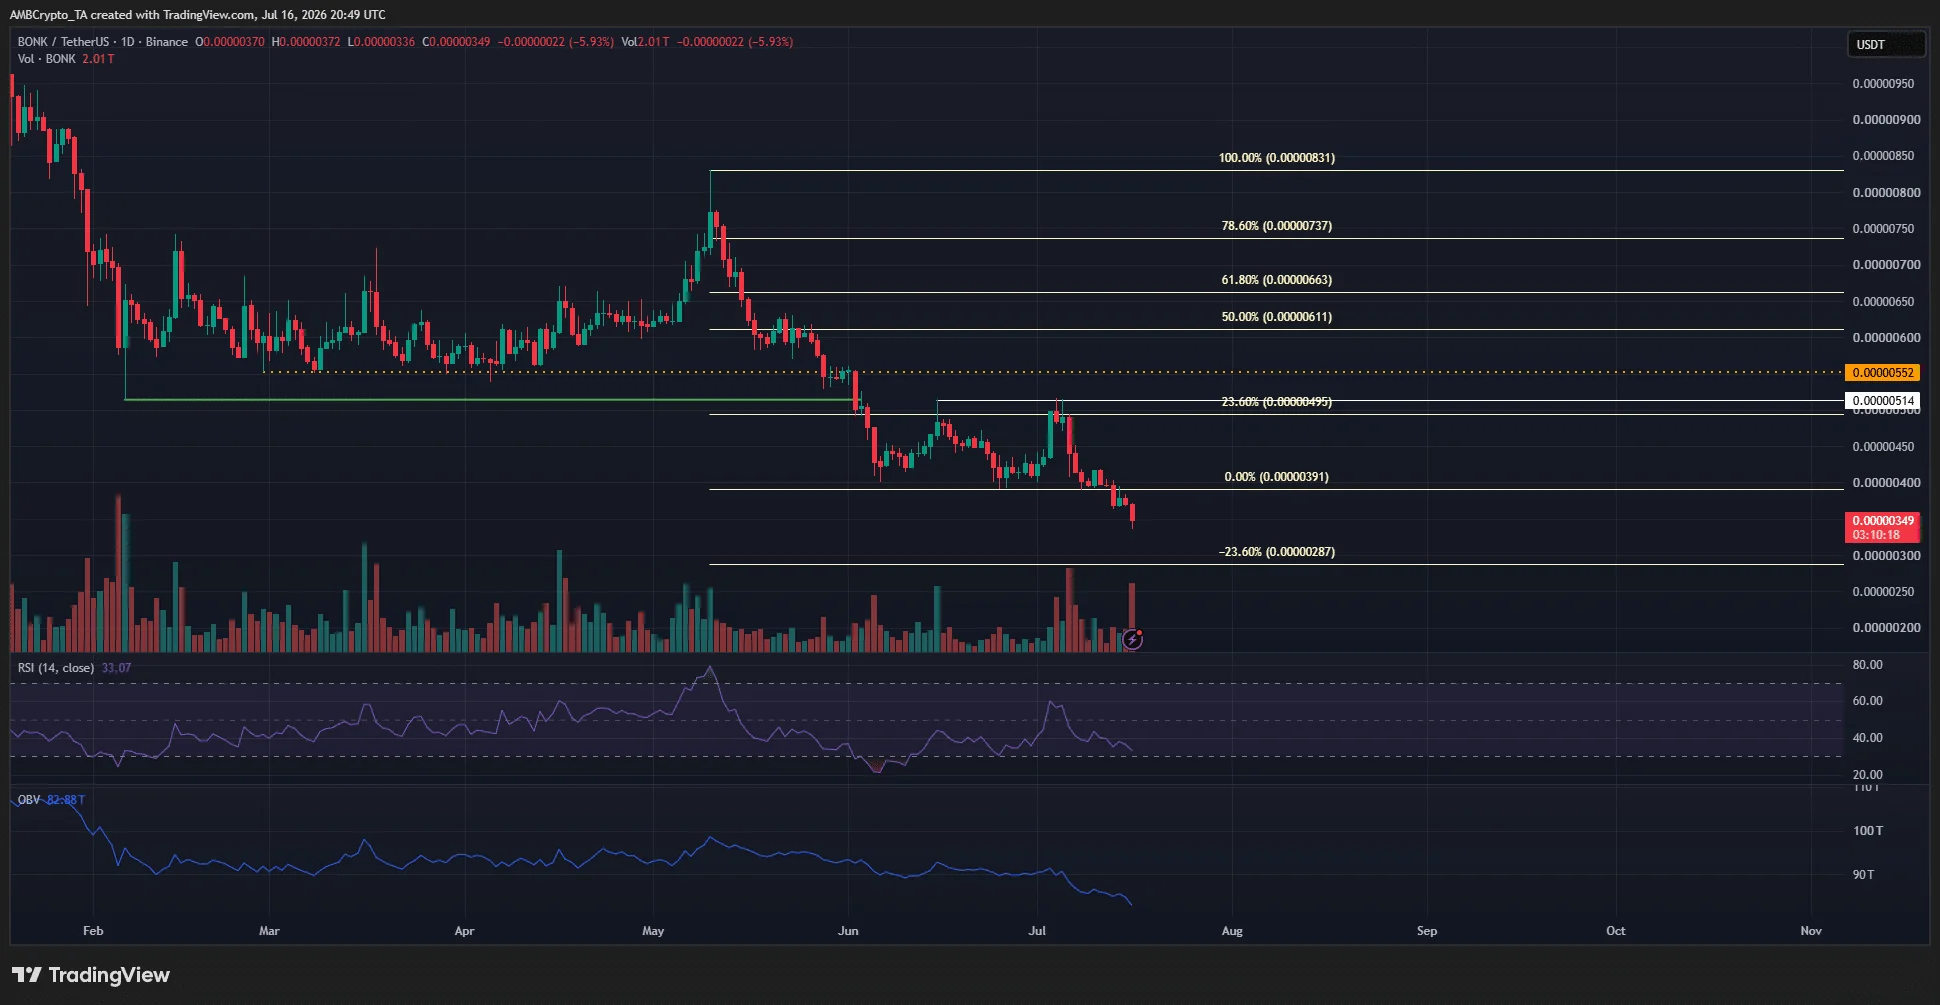
The $0.00000514 local resistance zone was tested earlier in July, but to no avail. The exploit and the subsequent bearish pressure forced prices to new lows.

The OBV also slid to new lows for the year to showcase the relentless selling pressure on the memecoin. Meanwhile, the RSI on the 1-day chart did not yet reach oversold territory.

As things stand, another 18% BONK drop is likely. The next price target will be $0.00000287, which is the 23.6% southward Fibonacci extension level.


Final Summary

  • Hacker behind BONK’s $20 million exploit earlier in July has been moving tokens to Binance, likely with the intent to sell.
  • Severe bearish pressure on the memecoin was amplified and another southbound move cannot be ruled out.


Source link

Bitcoin under $63,000 after new U.S. strike on Iran and Trump’s China allegation

0
Bitcoin under $63,000 after new U.S. strike on Iran and Trump's China allegation

Bitcoin and Asian stocks fell Friday after fresh U.S. airstrikes on Iran raised geopolitical uncertainty. Additionally, President Donald Trump’s allegations that China tampered with the 2020 election hurt risk sentiment, sending the Australian dollar lower.

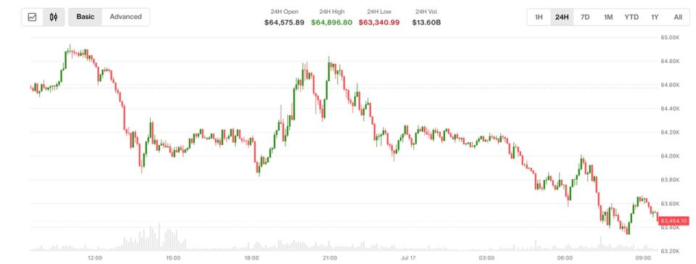
BTC, the leading cryptocurrency by market value, slipped below $63,000, extending Thursday’s nearly 1.4% slide from $65,000, according to CoinDesk data. As of this writing, the cryptocurrency traded just below its 50-day simple moving average, the widely-tracked gauge of near-term momentum.

Asian equity markets wilted, with Japan’s Nikkei trading nearly 3% lower at its lowest in over a month. Australia’s ASX 200 slipped by 0.5% alongside a 0.8% drop in futures tied to Nasdaq. Wall Street’s tech-heavy index fell by over 1.6% on Thursday.

Iran’s semi-official Fars news agency quoted Hormozgan Province Governorate, saying that U.S. airstrikes have hit five bridges in the southern Hormozgan province. A missile strike also hit Iran’s Chabahar maritime control tower. Surprisingly, WTI oil futures held steady at around $79 per barrel, ignoring the geopolitical stress from the fresh wave of U.S. attacks on Iran.


Source link

Corning Stock Signal Hints at Upside Potential Amid Breather

0
Corning Stock Signal Hints at Upside Potential Amid Breather


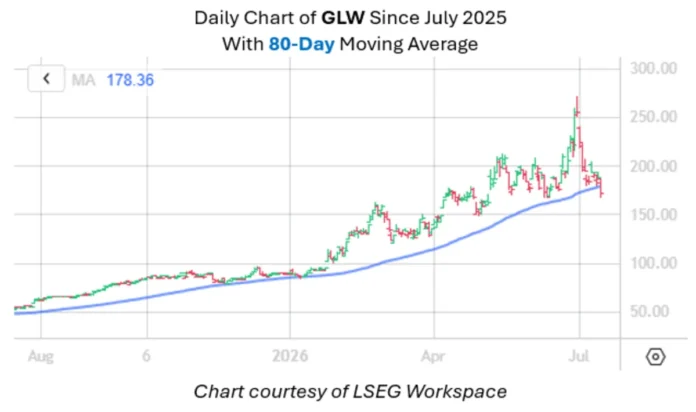
Corning Inc (NYSE:GLW) stock is down 7.8% at $172.92 this afternoon, part of its larger drawdown from its June 30 record peak of $271.38. Its no surprise the tech concern has fallen 36.4% since tapping its record. However, all is not lost, as the shares near a trendline with historically bullish implications.

According to Schaeffer’s Senior Quantitative Analyst Rocky White, GLW is trading within 0.75 times the 80-day moving average’s 20-day average true range (ATR), after spending at least 80% of the previous two weeks and 80% of the prior 42 trading sessions above that trendline.

This setup has appeared 19 times over the last decade, after which the stock was higher one month later 72% of the time, averaging a 4.74% gain. A similar move from the stock’s current perch would put the shares at $181.12.

glw-pb

It’s worth noting shorts have been retreating, with short interest down 13.7% during the most recent reporting period. This accounts for 2.6% of the stock’s available float, or less than two days’ worth of pent-up buying power.


Source link