Coinbase’s Jesse Pollak said he is stepping back from leading the Base app after acknowledging that his bet on an onchain social economy failed to drive crypto adoption as he had expected.
The Base creator said he had spent the last two years betting that builders and onchain-native social experiences, including Farcaster, Zora, mini apps and creator coins, would fuel crypto’s next growth wave. But in a post on X on Wednesday, he said while developers did spur adoption through products like stablecoins, prediction markets and perpetual futures, social applications “disintegrated completely.”
“I was definitively wrong,” Pollak wrote, adding that Base’s focus on social left it behind competitors in key areas including trading, tokenization and payments.
As part of the pivot, Pollak said that the leadership of Base app will return to Coinbase, where popular crypto investor Jordan Fish, also known on X as ‘Cobie,’ will oversee its development. Pollak said Fish will work to make the Base app “the best damn app for onchain,” including expanding beyond the Base ecosystem, while Base itself will prioritize trading, payments and AI agents as it seeks to become infrastructure for global finance.
Dogecoin [DOGE] had tried to scale the $0.080 resistance zone at the start of July, but was unable to. It appeared that the bulls might be making another attempt to drive prices higher.
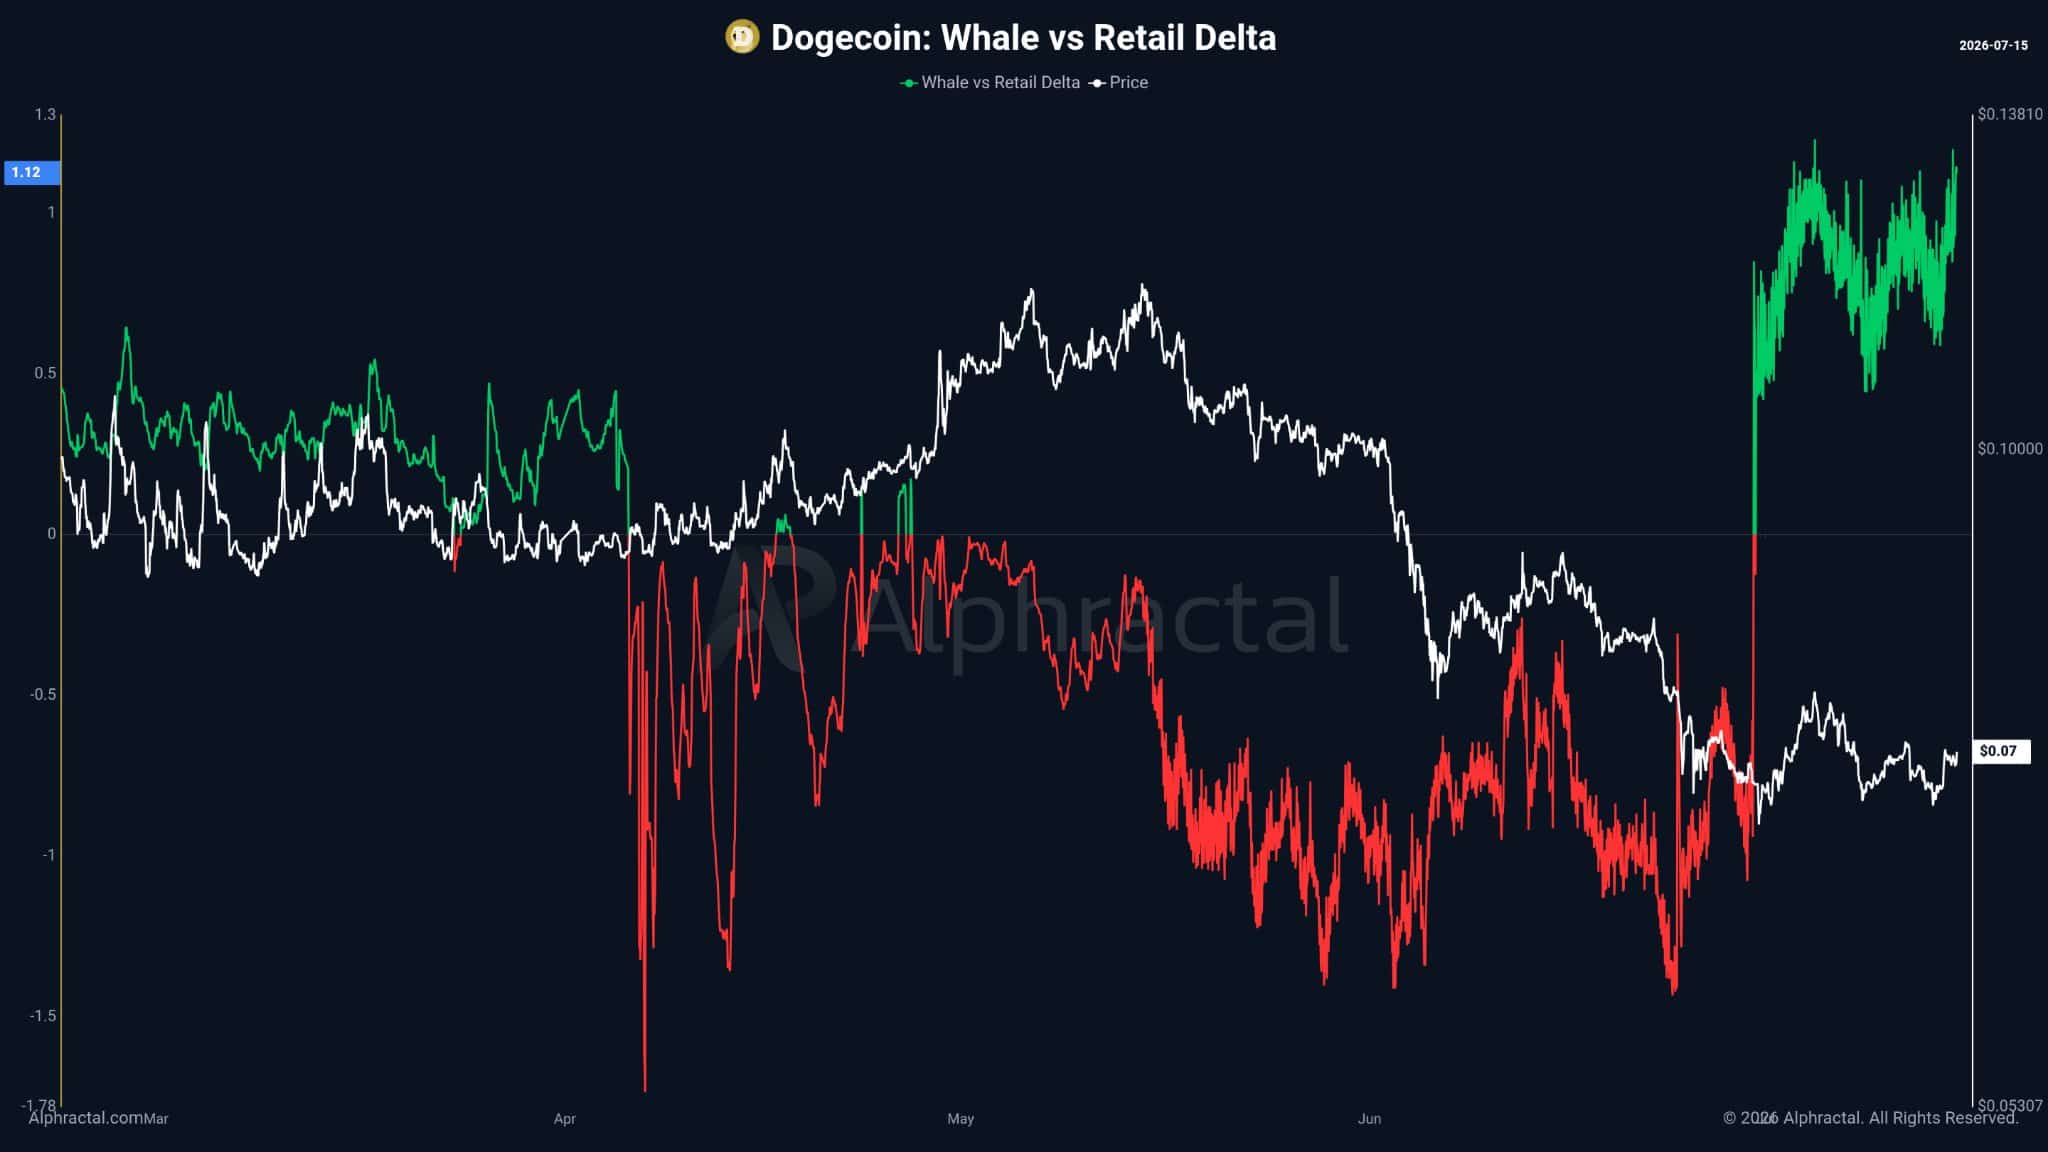
Source: Joao Wedson on X
Founder and CEO of crypto intelligence platform Alphractal, Joao Wedson, observed in a post on X that whales were going long on Dogecoin while retail continued to hold short positions.
This sentiment shift occurred as DOGE fell just below the $0.07 round number earlier in July. The analyst believed that this change must persist if the memecoin can change its long-term downtrend measurably.
As things stand, a short squeeze is possible, but sustained demand is needed to help drive the memecoin towards recovery.
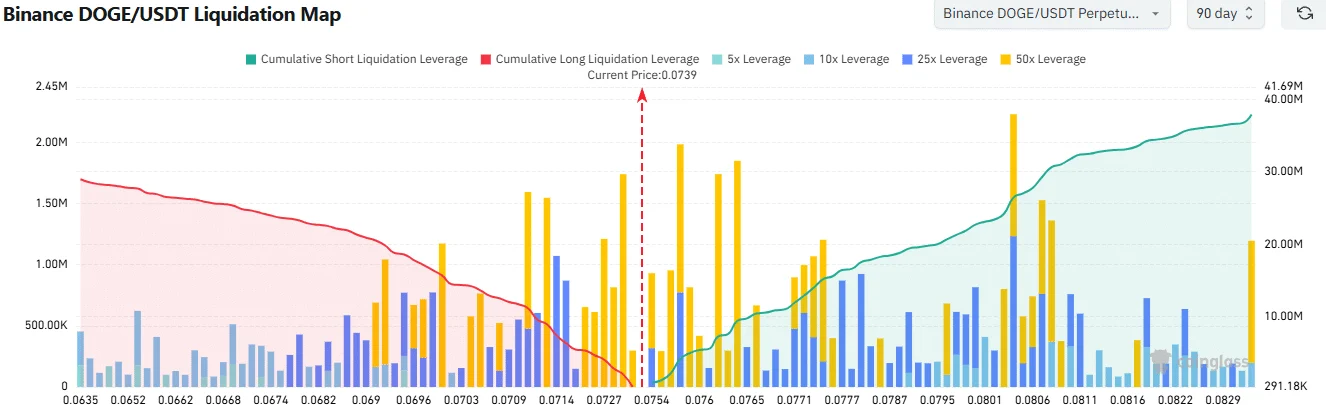
Source: CoinGlass
The 3-month liquidation map revealed that a price move toward $0.08 was more likely than a downward drop, based solely on liquidation concentrations.
The cumulative short liquidation leverage was stronger. This meant that a price move higher would force more liquidations, and these market buy orders in the perpetuals market could help Dogecoin climb even higher.
Yet, it is possible that such gains would quickly reverse and turn out to be just a short squeeze.
Let’s see if the price charts agree with the liquidation map.
Whale longs versus bearish structural trends
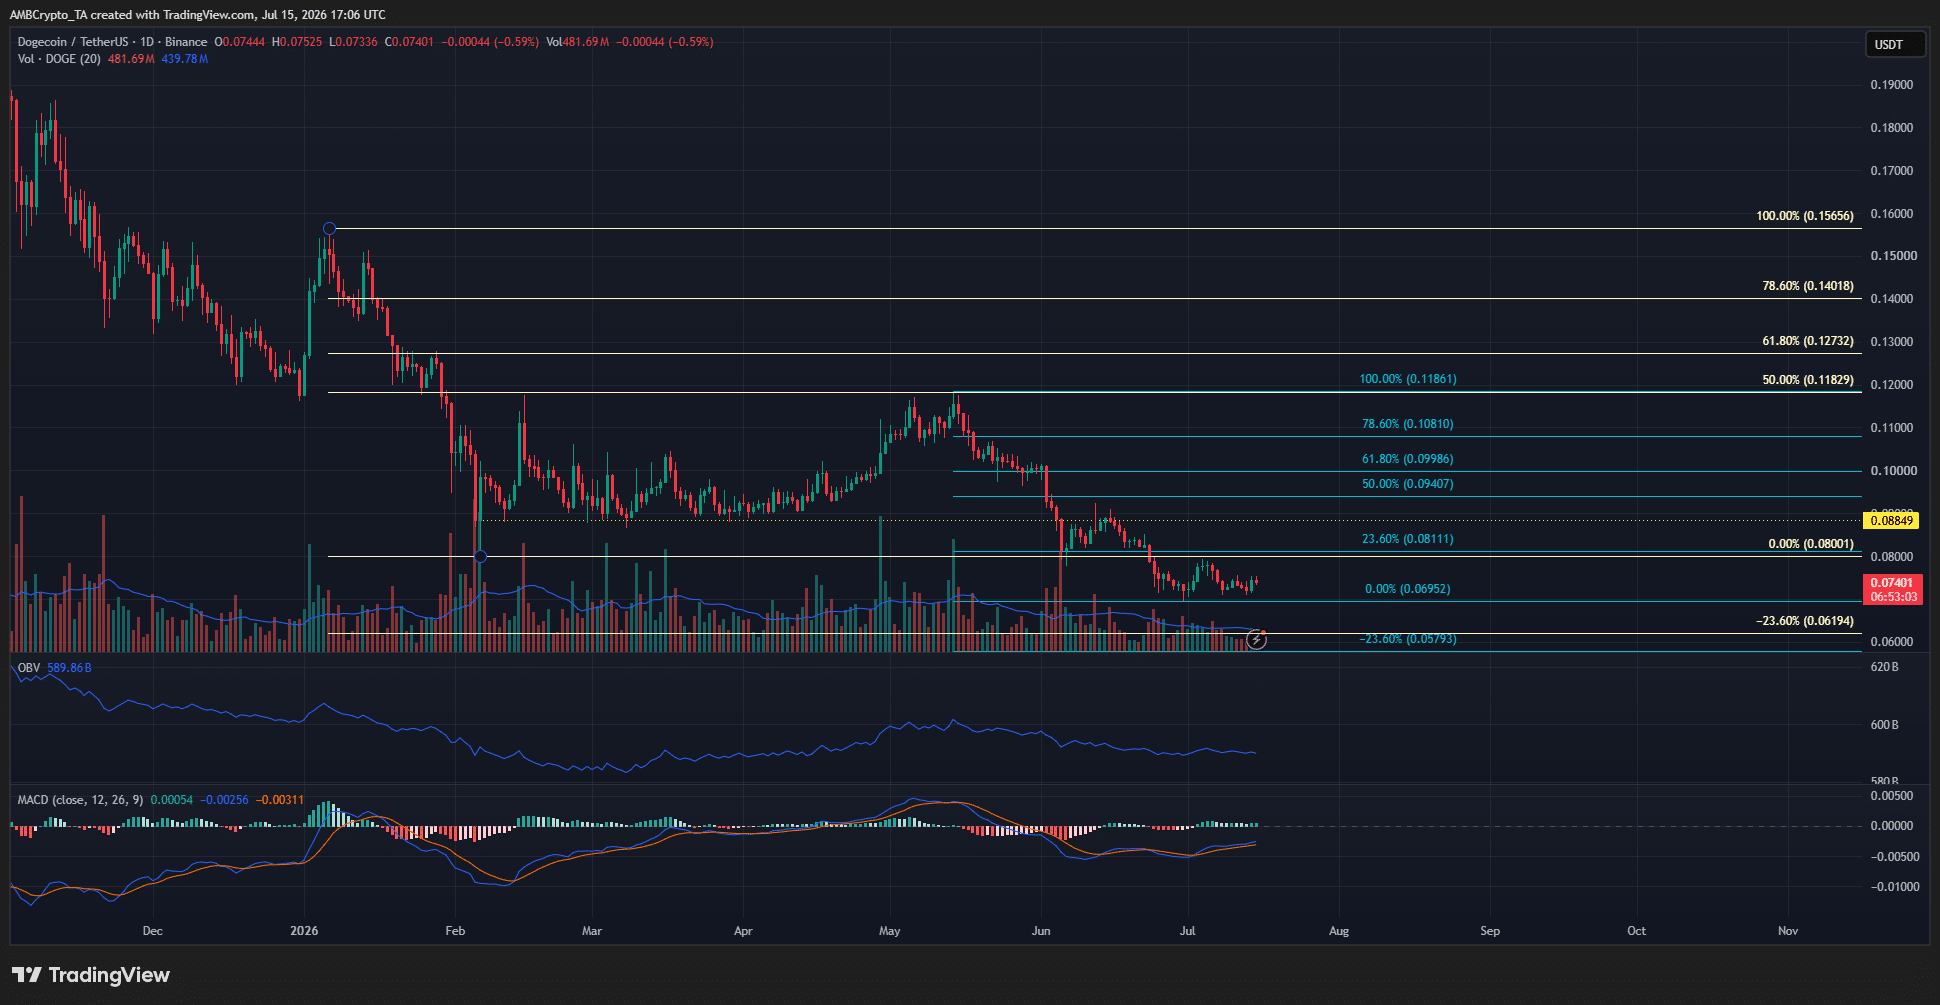
Source: DOGE/USDT on TradingView
The February low at $0.08 was breached in June, making the $0.118 swing high the level that anchors the downtrend in place. Interestingly, the $0.081 level marked the 23.6% retracement level.
It is a short-term resistance zone, and has acted so in recent weeks. If reclaimed as support, a rally up to $0.108 is possible.
There is also a potential bearish scenario where Bitcoin [BTC] is unable to climb meaningfully past $65k. In which case, Dogecoin might make a final sweep of the $0.08 area before falling to new lows.
Final Summary
Whales have been going long on Dogecoin even as retail remained short, a sentiment divergence that could have a say in price trends.
A lack of strong buying pressure and the potential of a short squeeze to $0.08 meant a Dogecoin recovery remains unlikely.
Inflation eased in June, according to data released by the Bureau of Labor Statistics on Tuesday.
Over the last 12 months, consumer prices increased 3.5% before seasonal adjustment, down from 4.2% in May. This was well below the 3.8% annual increase that Bloomberg economists were anticipating.
Energy prices, particularly gasoline, were the biggest contributor.
The index for energy has been steadily declining, falling 5.7% in June after rising 3.9% in May, 3.8% in April, and 10.9% in March. This was the largest one-month drop since April 2020. The gasoline index decreased 9.7% over the month. Core CPI, which excludes food and energy costs, remained flat at 0% monthly and rose 2.6% annually.
“The data offered a partial reprieve. Energy costs fell in June, and core inflation (which excludes energy and food) held steady. Both came in below market expectations,” said Moody’s Ratings chief credit officer Dr. Atsi Sheth.
“Core inflation matters for monetary policy, but headline inflation (which includes food and energy) is what shapes household budgets and purchasing power. June’s dip in energy costs may not last. Revived geopolitical tensions in the Strait of Hormuz could reverse that relief quickly.”
Energy prices dipped, but experts say this probably won’t last
Drivers felt some relief at the pump in the last few weeks after news of the US-Iran Memorandum of Understanding pointed toward improving relations in the Middle East. The national average price for a gallon of regular gas hit over $4 last month, according to AAA, but began to settle after news of a ceasefire, with the national average now sitting at $3.85.
However, with the conflict heating up again, experts say this decrease in gas prices likely won’t stick. Americans could start to see gas prices climbing yet again.
“Inflation continues to be a thorn in the side of most American households. Geopolitical instability in the Strait of Hormuz will continue to keep energy prices volatile, and most dips in gas prices look likely to be temporary at best,” said Dr. Selma Hepp, chief economist at Cotality.
Drivers also saw some price stability and decreases in insurance and vehicle costs.
The latest CPI also showed a 2% decrease in the motor vehicle insurance index after falling 1.7% in May. The used cars and trucks index fell 0.2% in June.
The new vehicle index was up 0.5% for the 12 months ending in June 2026, but remained unchanged month over month.
Other costs that decreased included communication (down 1.5%), apparel (down 0.6%), and medical care (down 0.1%).
Food prices climbed in June
Despite paying less for fuel and some transportation-related expenses, Americans were shelling out more for groceries. Four of the six major grocery store food group indexes increased in June.
The food index rose 0.2% in June, while food at home also increased 0.2% over the month. Other food at home increased 0.5%.
Eggs had the largest monthly increase in this category at 4.3%.
Over the month, the meats, poultry, fish, and eggs index increased 0.6%, the dairy and related products index rose 1.2%, and the cereals and bakery products index increased 0.3%.
Other categories with increases included recreation (up 0.5%), household furnishings and operations (up 0.2%), and personal care (up 0.2%).
Investment giant Cantor Fitzgerald and cryptocurrency-focused broker-dealer Securitize (SECZ), are revamping initial public offerings (IPOs) with tokenization and blockchain technology, the companies said on Wednesday.
Under the agreement, Cantor will leverage its equity capital markets and trading capabilities, while Securitize will provide the tokenization infrastructure used to issue, distribute, and service tokenized securities, according to a press release.
Large traditional finance players are taking rapid steps towards the tokenization of capital markets. This week the Depository Trust & Clearing Corporation (DTCC) announced further plans to tokenize stocks with a range of partners including JPMorgan, Goldman Sachs, BlackRock and Vanguard.
The collaboration will enable public companies to raise capital and issue securities onchain with improved operational efficiency and modernized ownership records, while still operating within the established capital markets framework of traditional public offerings, the companies said.
Rather than focusing on tokenized funds or secondary trading, this partnership extends blockchain infrastructure directly into IPOs and follow-on offerings, a Securitize spokesperson said in an email.
Over the past couple of years, the word “AI” has become like a broken record, heard at least once almost every day, often followed by a wave of anxiety.
What has happened amid all the FOMO and paranoia is that users have begun sharing virtually everything deemed “confidential” under the sun in search of answers.
Businesses pay for intelligence, but for that to be useful, you need to present the AI model companies with proprietary data, workflows, and corrections that give them a competitive edge.
The buyer is essentially giving up their knowledge simply to make use of what they have purchased.
Nadella’s concern is that companies ultimately pay twice, once in cash and again with institutional know-how over time.
Satya Nadella says companies may be paying for AI twice
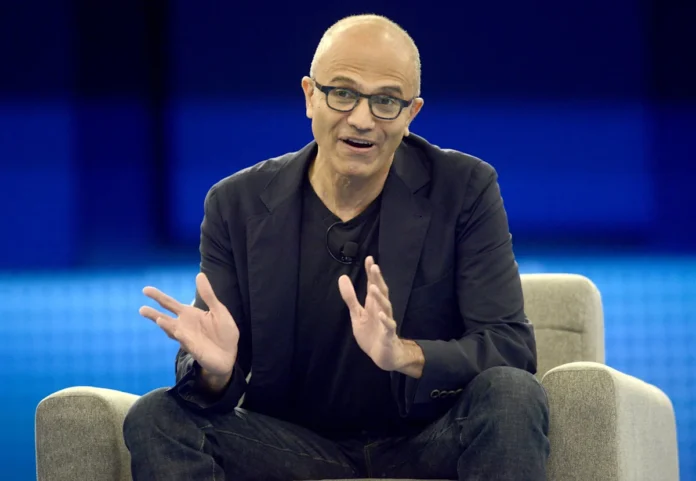
Microsoft CEO Satya Nadella argued that the visible cost of AI might just be the beginning.
“You essentially pay for intelligence twice, once with money, and again with something even more valuable: the proprietary knowledge you must reveal to make that intelligence useful,” Nadella wrote in a recent blog post.
For AI systems to perform better, there needs to be higher-quality internal context, which likely includes employee prompts, operational procedures, agentic activity, and corrections.
More Palantir:
“Models learn ‘from exhaust,’ the prompts people write, the tools agents use, and especially the corrections people make when the model is wrong,” Nadella said. “Every correction is distilled into institutional know-how.”
“I am paying for tokens that create no value,” Karp said in his most recent appearance on CNBC’s “Squawk Box,” describing the frustration he hears from enterprise customers. “These people are stealing the weights and alpha of my business.”
Additionally, Karp also challenged the industry’s basic pricing model: “If I can make you $1 billion tomorrow, wouldn’t I say I’ll make you $1 billion, and I want 30%? Why are they charging for tokens if it’s so valuable?”
Nadella’s version feels a lot less confrontational, but far more coherent, than Karp’s. Still, the underlying warning remains the same.
Businesses are effectively renting models while donating the knowledge that makes them much more capable.
“In consuming intelligence, you are creating intelligence, and what you create should belong to you,” as Nadella puts it.
Microsoft CEO Satya Nadella’s enterprise AI warning echoes concerns raised by Palantir CEO Alex Karp. Stephen Brashear/Getty Images
Nadella’s warning strengthens Palantir’s core AI pitch
For Palantir (PLTR) stock investors, Nadella’s warning is important and may have indirectly validated the problem Karp says Palantir was built to solve.
The CEO of the controversial tech firm Karp argued that enterprises should not expose their proprietary data, workflows, and operational knowledge directly to large language models outside their organizations.
Palantir’s answer is Ontology, an application layer that connects models to company operations while controlling what models can access and retain.
Karp said Ontology makes AI “safe and useful and precise,” preventing models from caching customer data, replicating the business, or transferring sensitive intellectual property.
He went a step further in his interview with podcaster Mathias Döpfner, saying businesses need an application layer that “protects your data from being essentially abused by large language model providers.”
If customers become more wary of the data they give up, Palantir could be in line for a massive long-term windfall, but it could also create valuation risks elsewhere in the AI sector.
Palantir needs to prove Ontology can turn that strategic concern into durable contracts, expanding margins, and measurable customer returns.
It’s worth mentioning that the stock is down 27% in the past six months and more than 26% year-to-date, according to Seeking Alpha data. Still, Palantir stock is changing hands at 88 times non-GAAP forward earnings, a steep premium, to say the least, compared to the sector median of around 25 times.
Nadella’s warning raises the stakes for the AI trade
The interesting part is that the broader AI trade is already up against the uncomfortable question that Wall Street hasn’t answered: Who will earn enough money to justify the extraordinary spending?
For perspective, Amazon, Microsoft, Alphabet, and Meta are projected to spend about $630 billion on data centers and AI chips in 2026 alone, according to Reuters, more than 4 times their 2023 guidance.
However, with recent developments, it seems the chickens are finally coming home to roost as the AI trade undergoes a shakeout.
Bank of America’s latest survey found that 45% of fund managers view an AI bubble as the market’s biggest tail risk, Reuters also reported. Yet investors remain heavily committed to the chip stock trade.
Moreover, several of Wall Street’s most popular personalities have sounded alarms.
Ray Dalio says AI is “now in the early stages of a bubble,” while Jeremy Grantham warns that “sooner or later, the bubble will burst.”
“Big Short” investor Michael Burry has long been skeptical of the AI boom, calling semiconductor valuations “a pure form of overvaluation” and warning that the end may be near.
Nadella’s argument adds to those vulnerabilities.
The reverse information paradox may lead customers to redirect spending toward private, model-agnostic systems, weighing on the biggest names in AI and calling their nosebleed valuations into question.
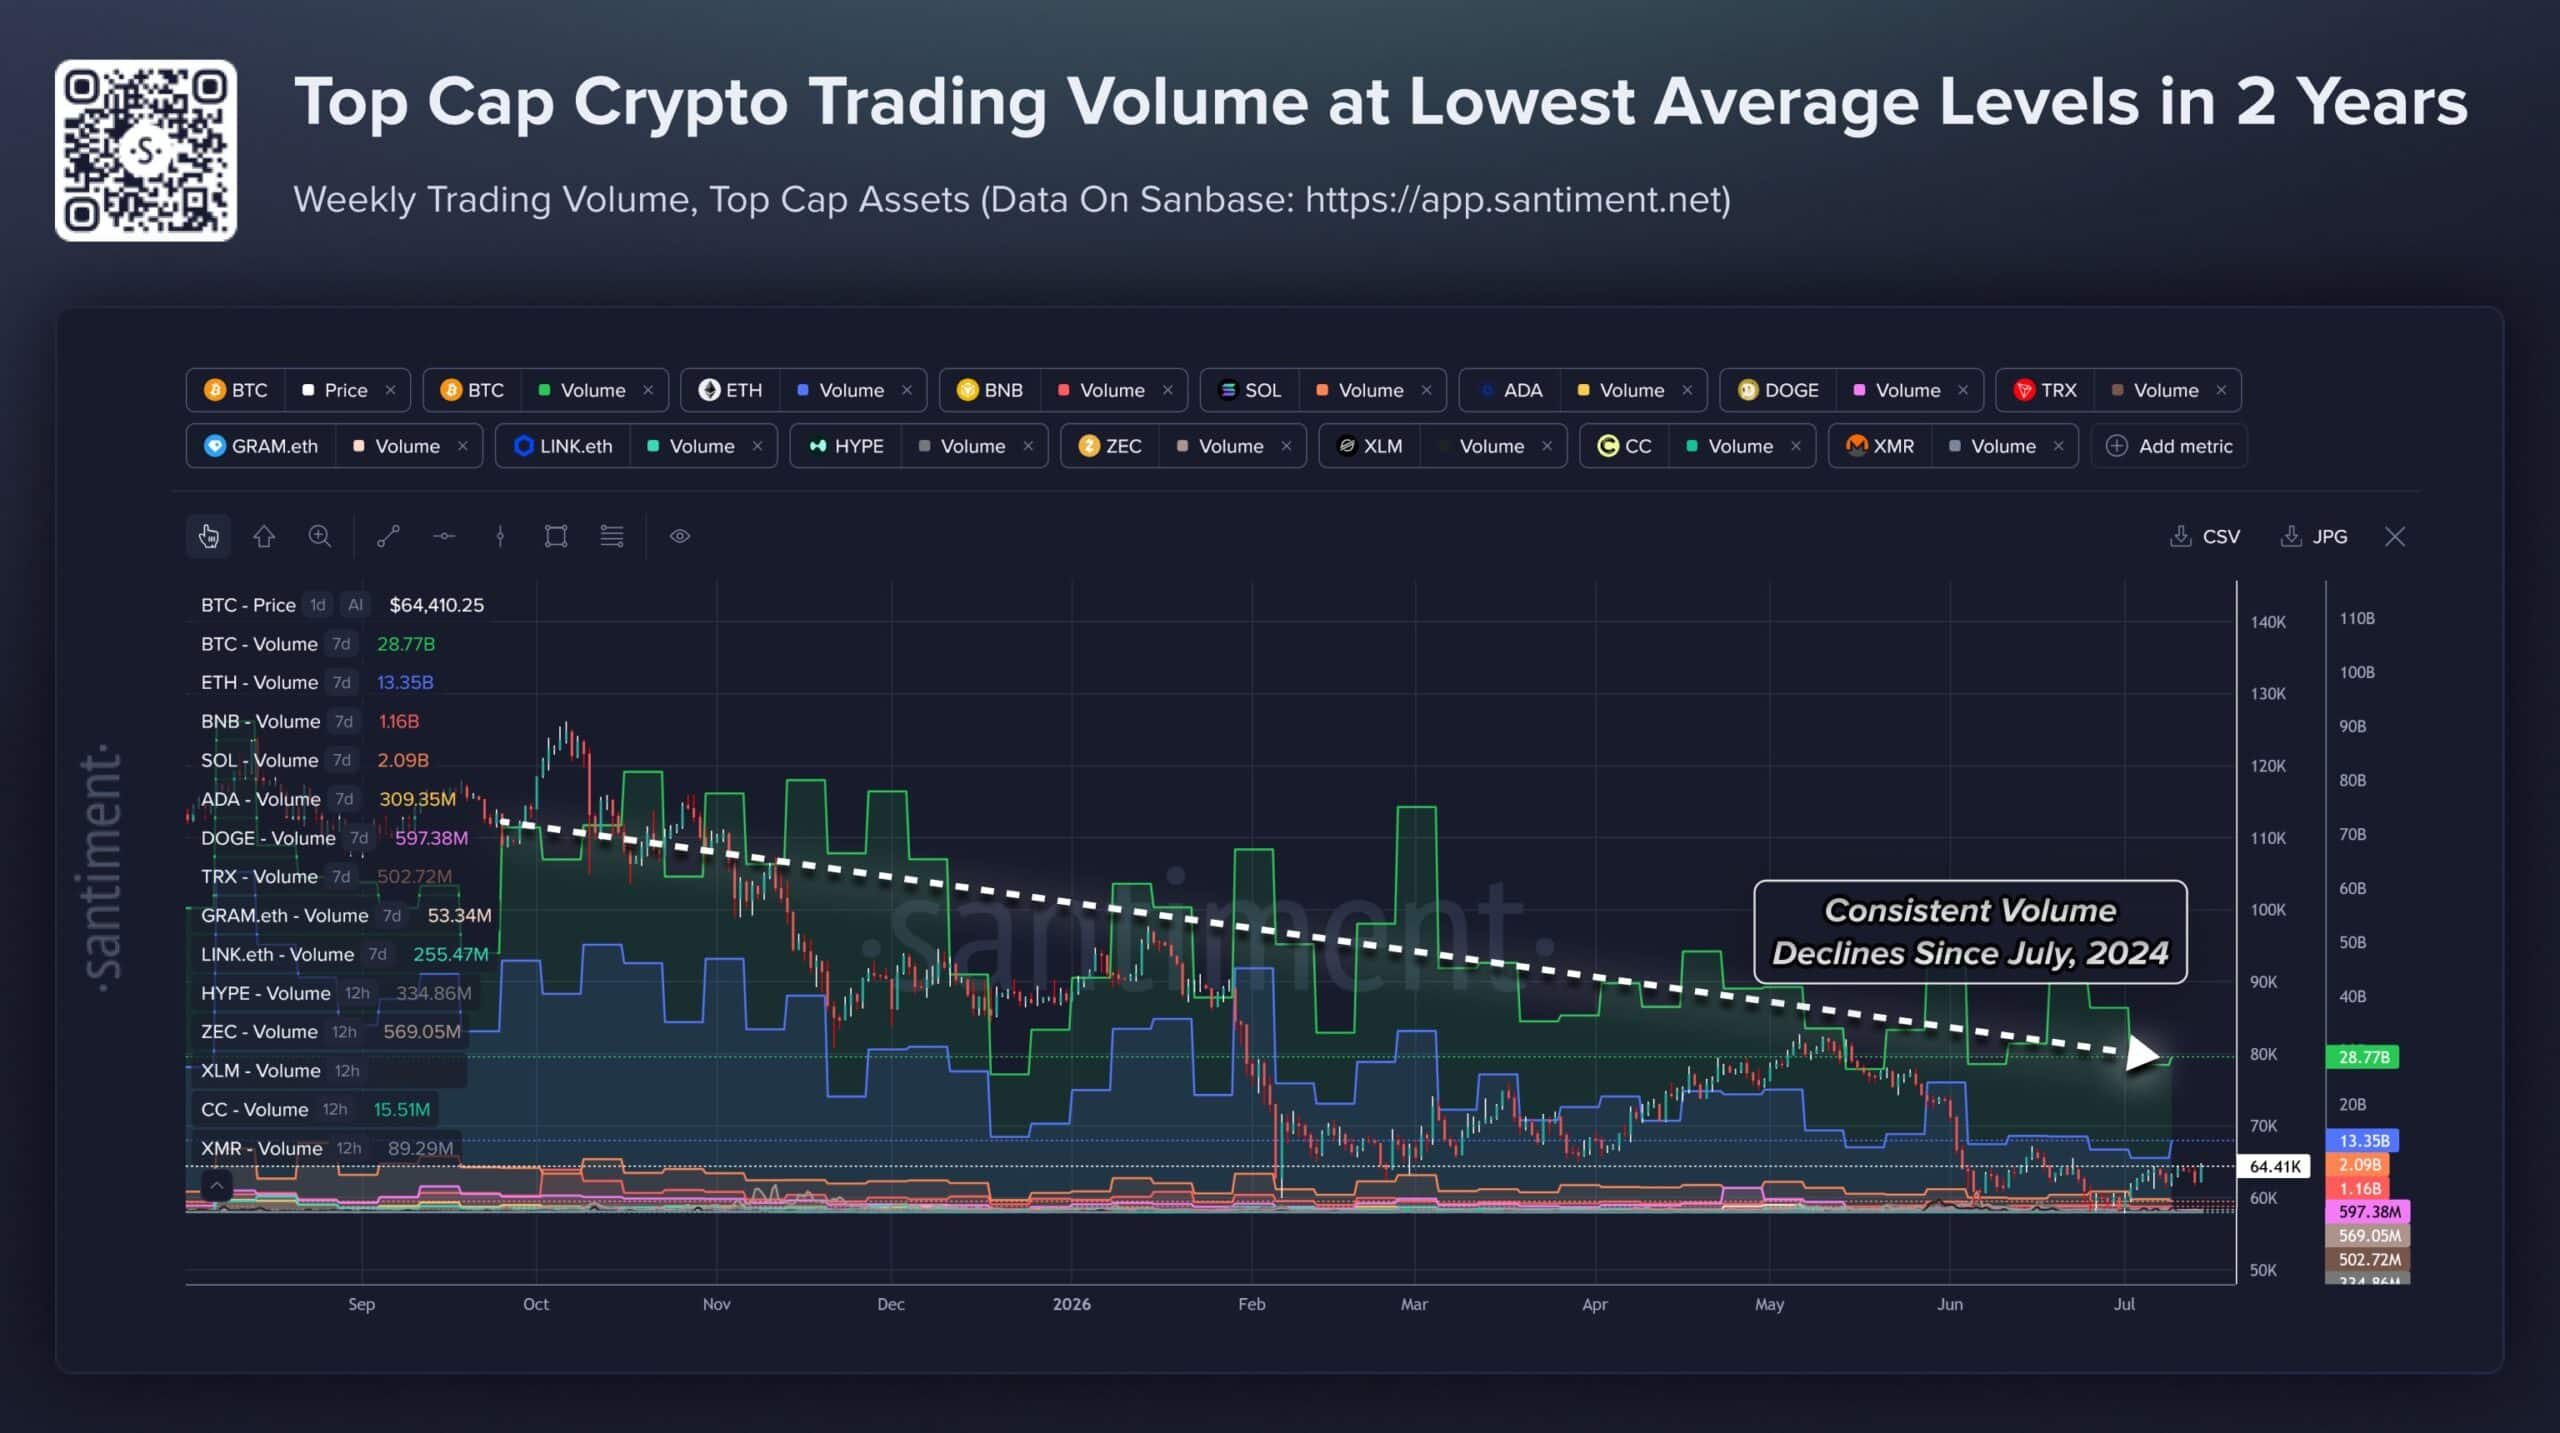
The trading volumes of the top crypto assets have been dwindling since July 2024, wrote the analytics platform Santiment in a post on X.
Source: Santiment on X
The trading activity was at its weakest average level in two years. It reflected weak demand and lower market confidence. Market participants are not rotating capital as aggressively, and each sell-off prompts more capital to flee.
Heavy macro pressure, Bitcoin [BTC] spot ETF outflows, and bearish price action since October 2025 for the leading crypto helped explain the dwindling volumes.
Thin liquidity means that reduced demand would mean rallies can be more easily faded. Yet, if seller exhaustion has reached cyclical extremes, a subsequent recovery could be quick, and even modest buying pressure could move prices quickly.
The Solana buying opportunity
Source: Ali Charts on X
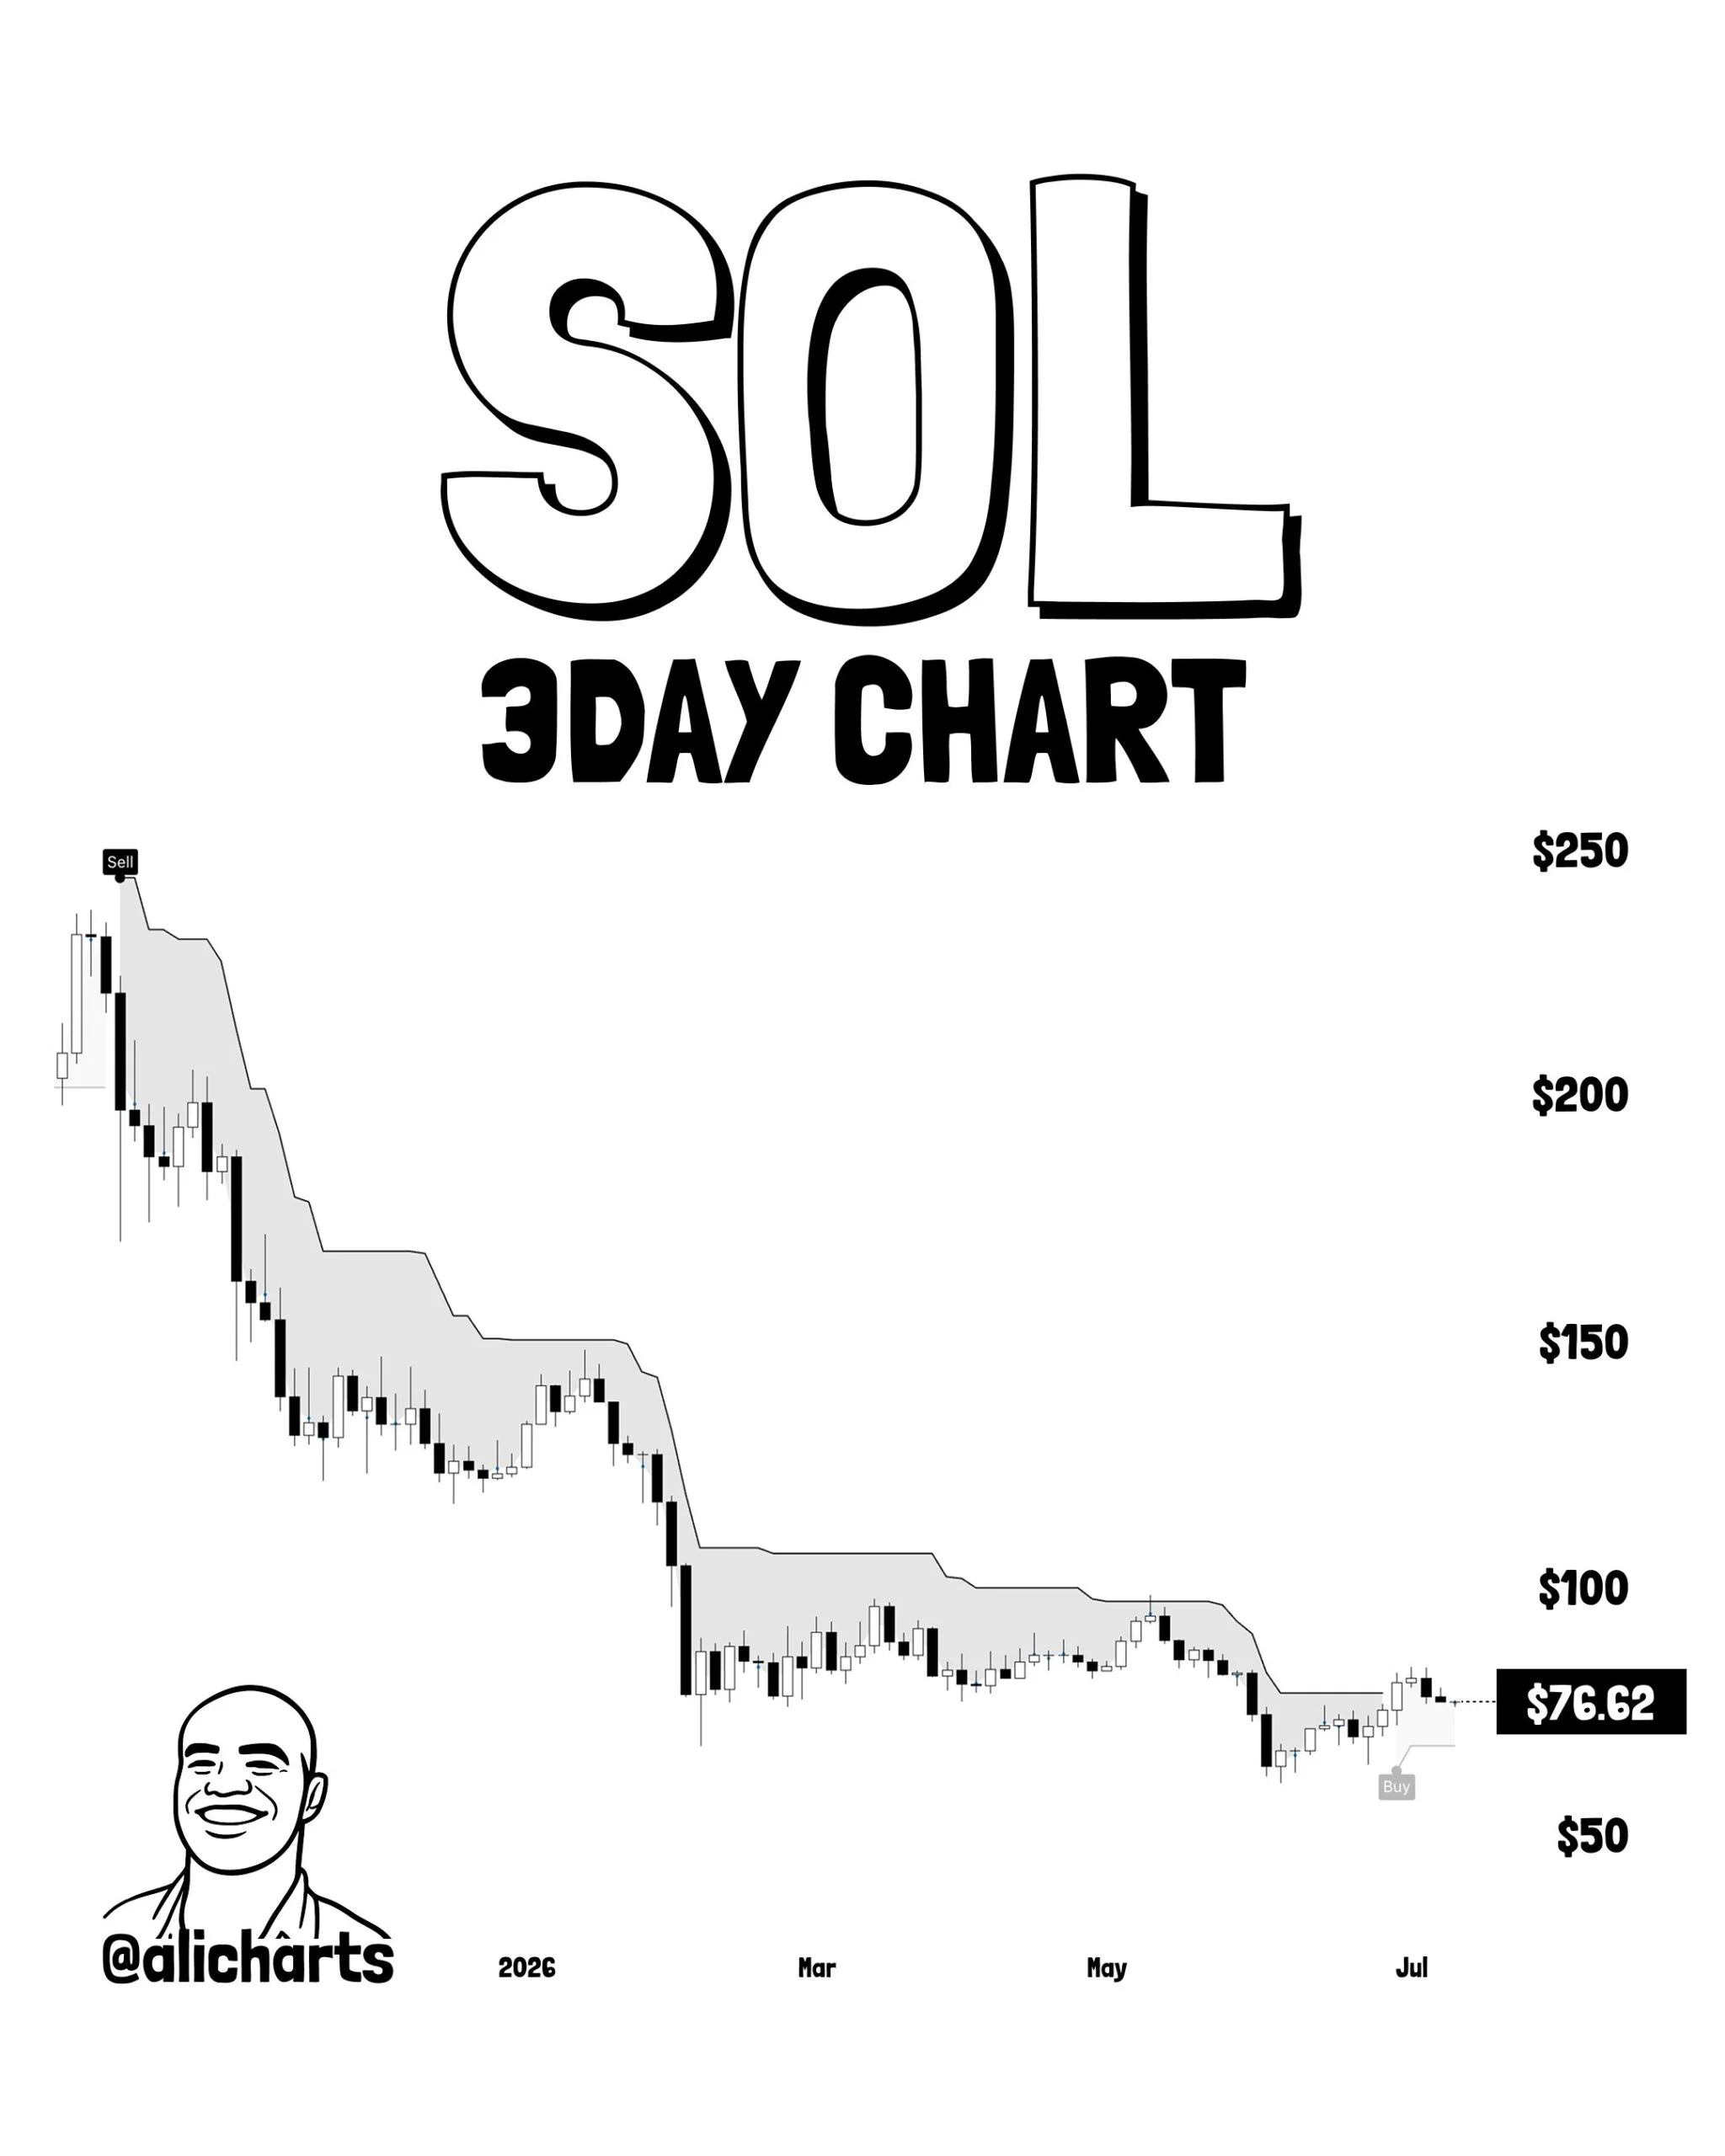
Against this backdrop of reduced volume, Solana [SOL] has turned bullish, according to crypto analyst Ali Martinez. The popular technical analyst used the SuperTrend tool on the 3-day timeframe to show that the ATR trailing stop has flipped bullishly.
This is a buy signal, and the $96 and $121 levels were the next levels to watch out for.
The Hodler Net Position Change metric on Glassnode has been positive throughout 2026. The metric tracks the monthly position change among long-term investors, and positive trends show hodlers were actively adding to their holdings.
SOL still trading within a bearish trend
Source: SOL/USDT on TradingView
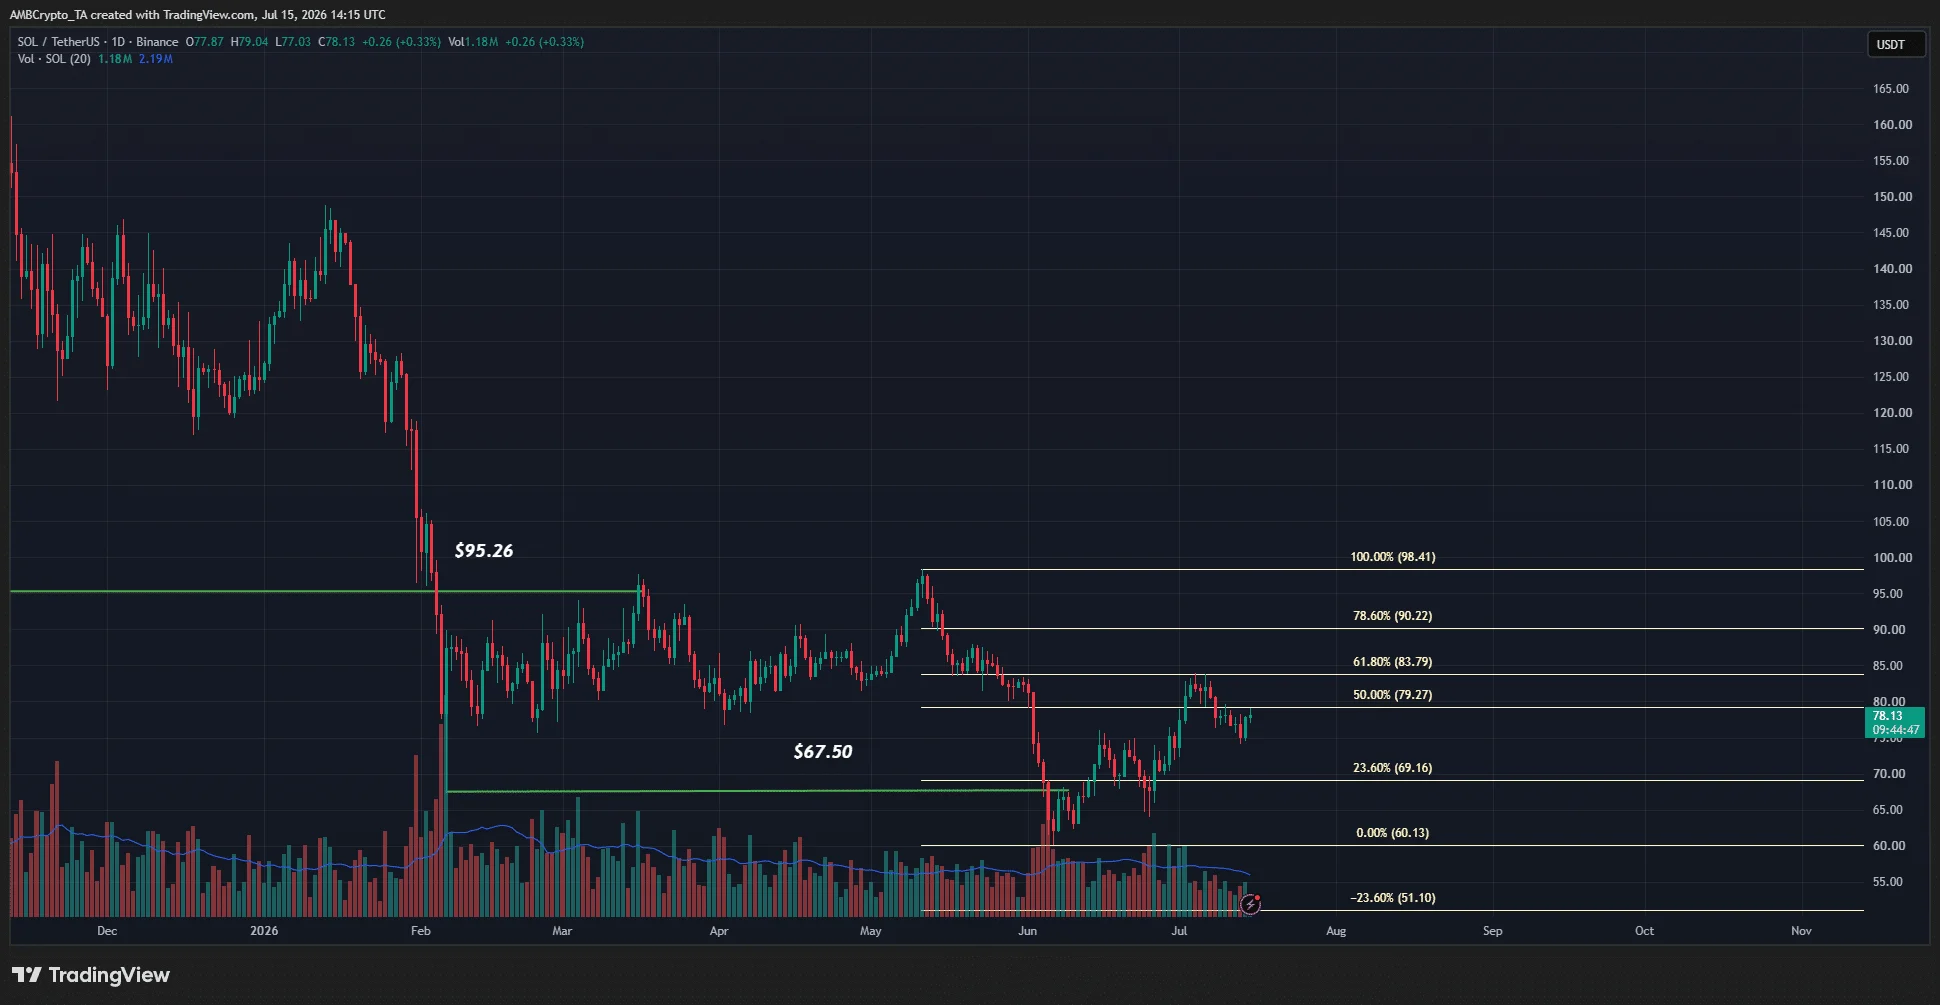
The swing lows at $95.26 and $67.50 were broken earlier this year, keeping the bearish Solana swing structure in place. Based on the drop from $98.41 to $60.13, Fibonacci retracement levels were plotted.
The $83.79 and $90.22 were the key resistance levels to watch out for. Another one was the $116 level, which was the realized price of Solana. Since the market price was well below this level, it showed that the aggregate holder base was facing unrealized losses.
This can prompt a sell-off on subsequent price bounces, making recovery harder until the wider market recovers and attracts greater capital inflows.
Recent selling pressure has also been reinforced by large token movements. A $15.14 million onchain SOL token move from Alameda Research was spotted recently, and the subsequent short-term price move resulted in just over $10 million in long liquidations.
Final Summary
The Solana buy signal in recent days and hodler accumulation trends throughout 2026 gave the altcoin a bullish tint.
Yet, the price charts and overhead supply zones meant a meaningful recovery would be difficult and requires greater capital inflows.
For the first time since at least 1974, new homes are selling for less than existing ones, and the culprit is a mix of builders getting generous and sellers refusing to budge.
In the first quarter of 2026, the median price of a new single-family home was $403,200—$1,400 below the median existing home price of $404,600, according to data sent to Fortune by the National Association of Home Builders, drawing on Census Bureau and NAR figures.
It marks the fourth consecutive quarter in which existing home prices have exceeded new home prices, a streak that began in the second quarter of 2024. Typically, new homes carry a premium over existing ones. That premium, which has averaged 16% going back to 1987, fell to -2% as of April 2026—the first time it has gone negative in data stretching back five decades, according to John Burns Research & Consulting.
But Alex Thomas, research manager on the macro team at John Burns, said it points to old fashioned supply and demand.
“There’s a lot that goes into that data point that is, like, some of it is an artifact of methodology, but there’s some truth to it as well,” he told Fortune.
New home prices are nearly $1,400 cheaper than resales.
Courtesy of John Burns Research and Consulting
A changing home build
Builders have been shrinking what they build. The median size of a new home sold has contracted to around 2,400 square feet, down from roughly 2,500 in 2022 and 2,700 in the mid-2010s. Smaller homes mean lower prices—and that alone accounts for part of the apparent discount relative to the existing home market, which skews larger. NAHB also attributed the pricing shift to builders constructing on smaller lots, shifting production toward the South, and offering incentives to move inventory—all against a backdrop of rising construction costs driven in part by tariffs on building materials that NAHB estimates have added as much as $9,200 to the average new home price.
All included in that price change is where the house is located.
“Home prices are holding much firmer in Northeast and Midwest markets that have not seen as much of an increase in supply,” Thomas said. “There just aren’t that many new homes being built in those regions, and softer pricing conditions across the Sunbelt are dragging down national median new home prices.”
The NAHB data confirms the regional divergence: New homes still carry a $309,200 premium over existing homes in the Northeast and a $66,800 premium in the Midwest. The discount flips in the West, where existing homes run $55,500 above new, and the South, where the gap is just $700.
Still, Thomas says the deals are real, and may even be larger.
“The true discount could be more substantial in certain markets, given that many builders are offering incentives beyond just price cuts, such as design credits, rate buydowns, or covered closing costs, that are not captured in Census data on median new home prices,” he said. John Burns’ survey work puts those incentives at roughly 7 to 8% of new home sale prices, a level Thomas called “pretty abnormal” relative to historical norms.
The affordability crisis has pushed builders further: Nearly 20% of new homes faced outright price cuts in the fourth quarter of 2025, according to Realtor.com. Buyers in markets with dense new construction have taken note, walking into builder offices and negotiating across competing communities.
Sellers holding onto the old for the highest dollar
The reason builders are willing to deal comes down to an asymmetry with resale sellers.
“Existing home prices are sticky on the way down,” Thomas said. “Resellers want the same prices their neighbors got a year or two ago, and are slower to adjust prices when market conditions change. Existing owners can delist and wait out the market, whereas builders have to move inventory given holding costs.”
However, he said, “I wouldn’t blame boomers specifically.”
Data, on the other hand, shows a distinct generational divide. Baby boomers now account for 42% of all buyers and a dominant 55% of all sellers, according to NAR’s 2026 generational trends report—and those who do sell are moving with equity-fueled flexibility that younger buyers simply don’t have. Meanwhile, boomers who hold low-rate mortgages or own their homes outright have little financial pressure to list.
A Redfin analysis of 2024 Census data found that empty-nest baby boomers own 28% of U.S. homes with three or more bedrooms, compared with just 16% for millennial households with children. Many can’t afford to move even if they wanted to. Meredith Whitney, the Wall Street analyst who predicted the 2008 financial crisis, has noted just one in 10 seniors can afford assisted-living facilities, leaving millions effectively trapped in homes they can no longer leave.
There’s also a rate-lock phenomenon that has effectively frozen the resale market. The average first-time homebuyer age hit a record 40 in 2025, and the share of first-time buyers fell to an all-time low of 21%, according to NAR—the lowest since the association began tracking the figure in 1981. Thomas tracks the gap between the average outstanding mortgage rate—currently around 4.3%—and prevailing market rates, now closer to 6.5%. Until those two lines converge, transaction volumes will remain depressed and the pressure on builders to discount will persist, he said.
“The takeaway is that the premium is negative for the first time ever,” Thomas said. “And I think what it’s saying is correct—there are deals right now.”