Decred [DCR] surged 24.03% over the past 24 hours at press time and attracted renewed market attention after buyers returned aggressively. Daily trading volume jumped 400.65% to roughly $8.3 million, while market capitalization climbed 24.07% to $242.93 million.
Those gains reflected stronger participation rather than isolated buying activity. Investors also returned after DCR spent months trading inside a persistent downtrend. As a result, the rally shifted market sentiment and placed the token among the strongest performers during the session.
Even so, higher trading activity alone did not confirm that buyers had gained complete control. Instead, the rapid expansion in volume suggested the market had entered a decisive phase where both buyers and sellers actively competed for direction.
Selling pressure lingered beneath the rally
Despite the impressive price recovery, spot market positioning painted a more balanced picture.
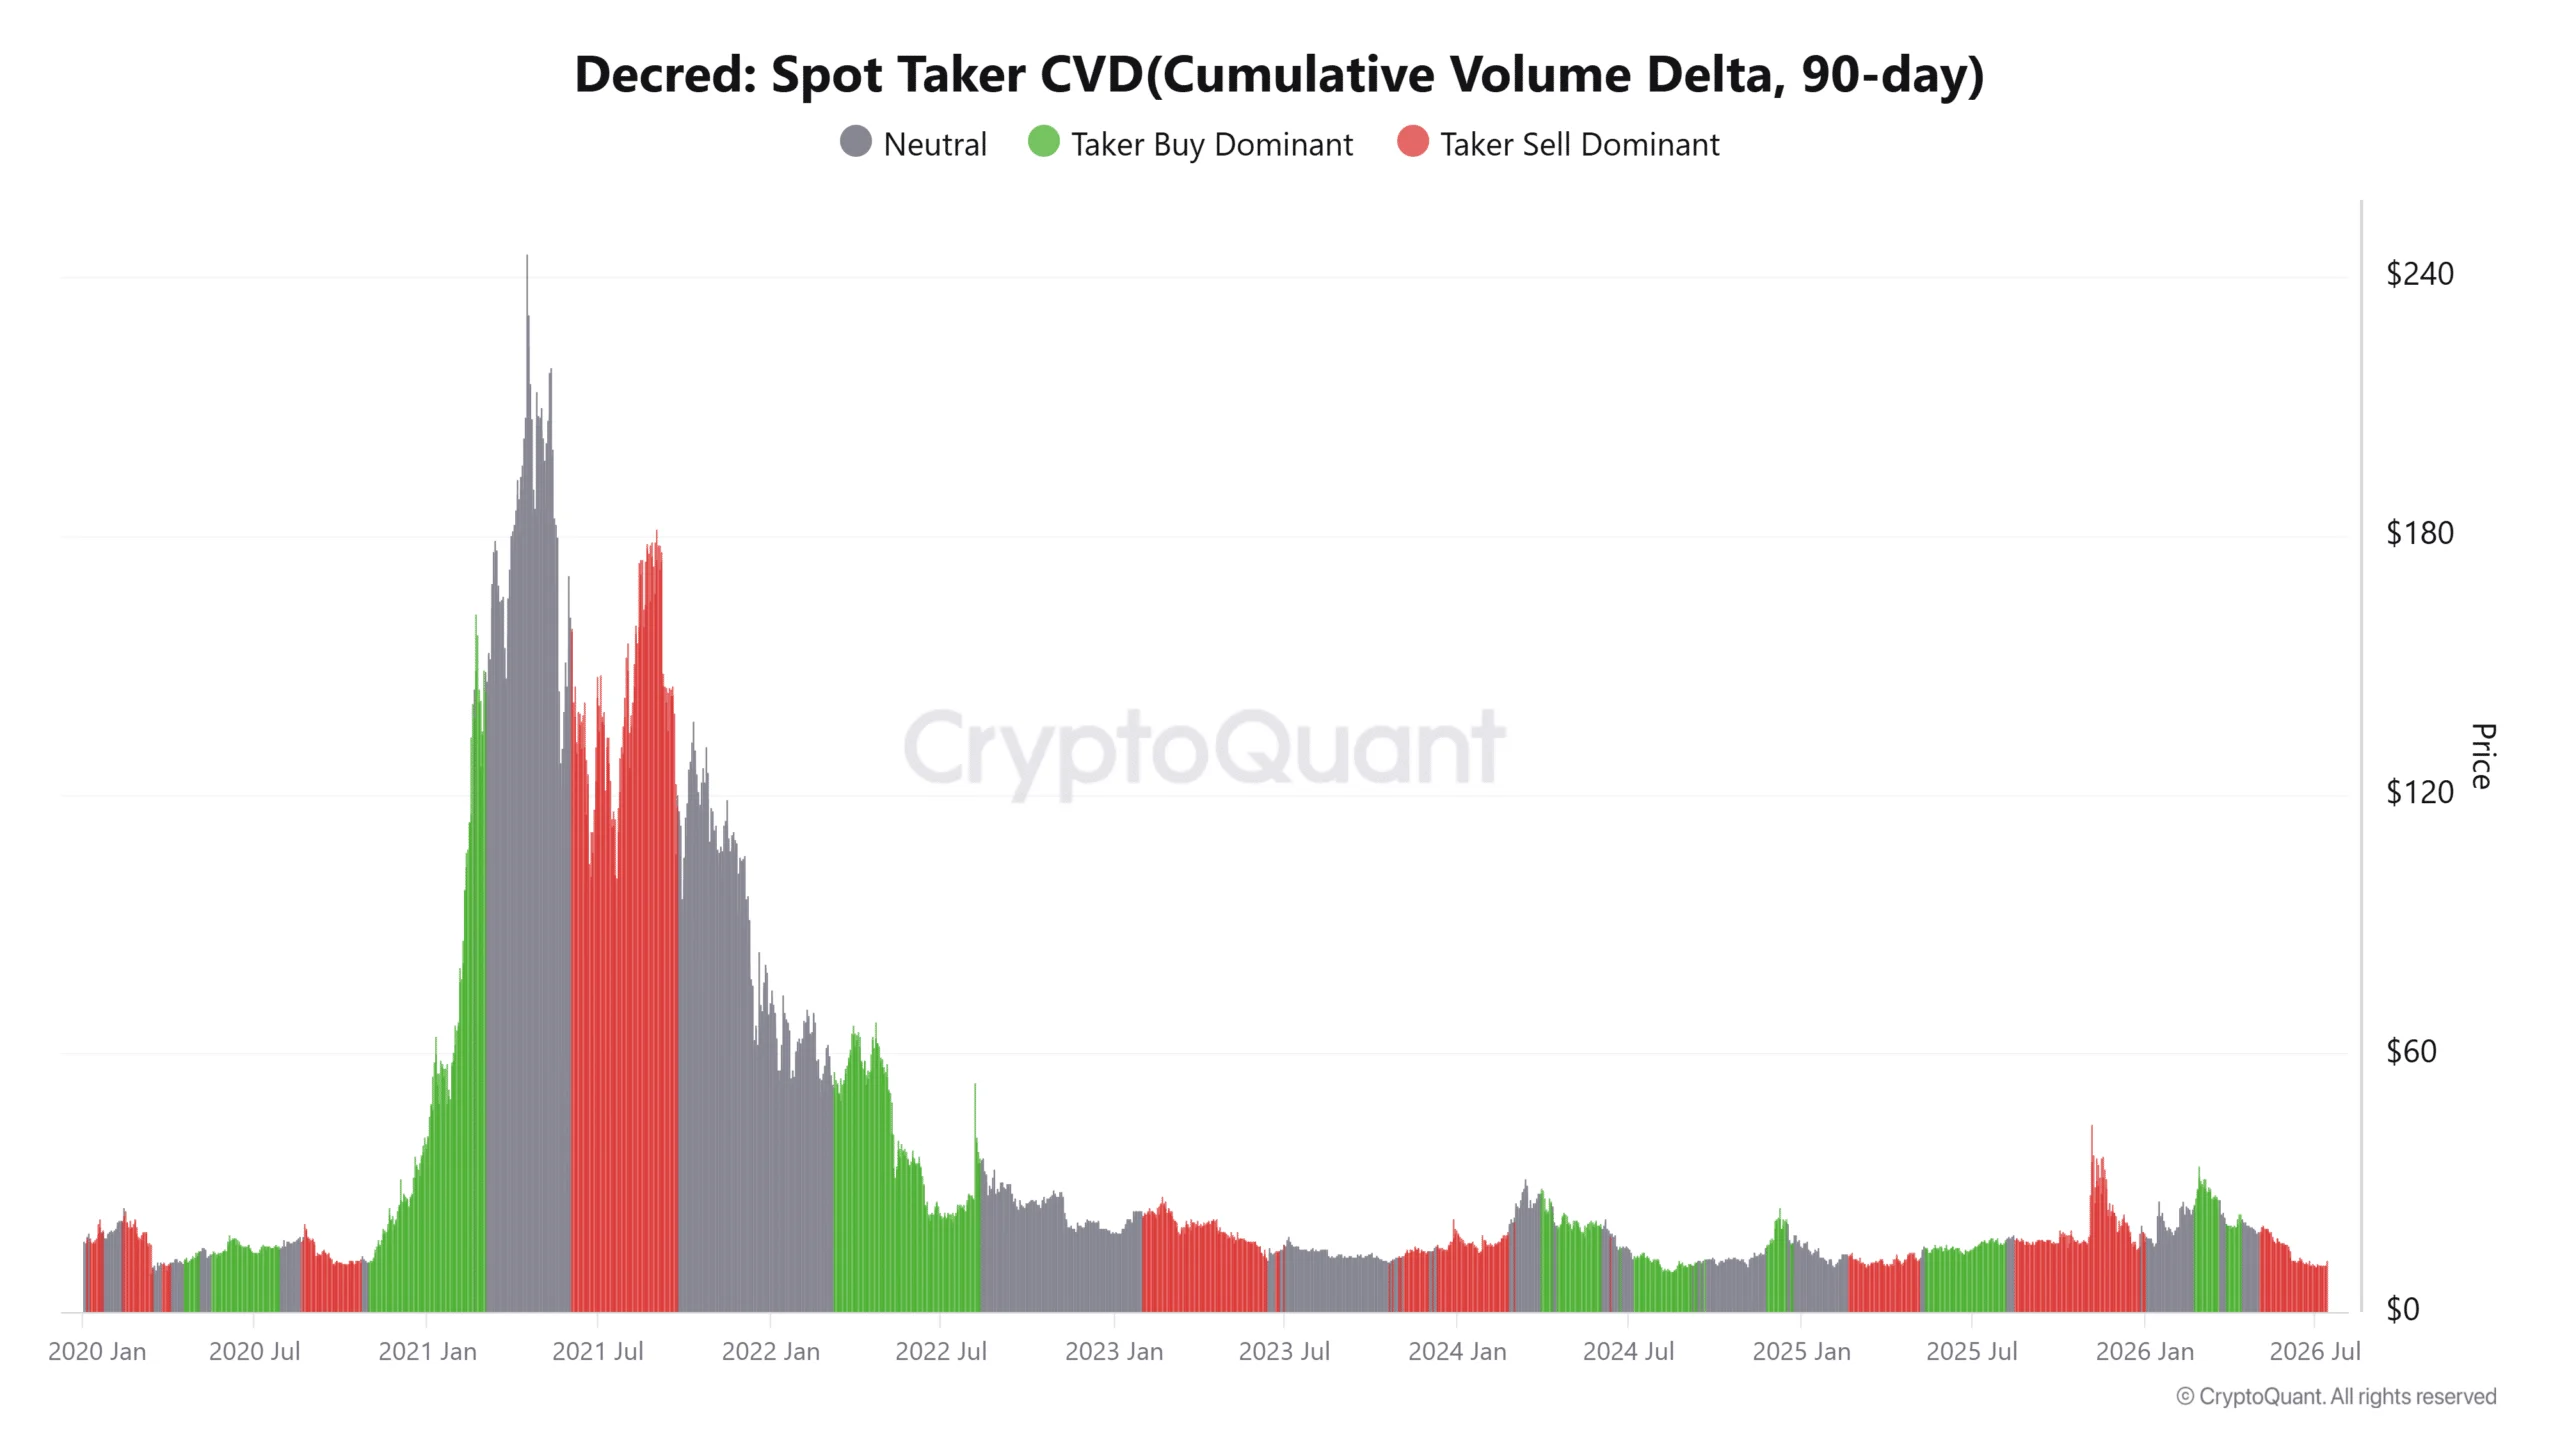
The 90-day Spot Taker Cumulative Volume Delta remained seller-dominant, indicating market sell orders continued to exceed aggressive buy orders throughout the broader period. Such a reading highlighted that sellers still entered positions even as the price advanced sharply. However, buyers absorbed much of that supply instead of allowing the rally to reverse immediately.
Such behavior often reflected improving demand because sustained buying managed to offset continuous selling pressure. Even so, the indicator showed that bullish conviction had not become one-sided. If aggressive selling continues to increase near higher price levels, DCR could face stronger resistance before extending its recovery.
Source: CryptoQuant
Large orders hinted at stronger market conviction
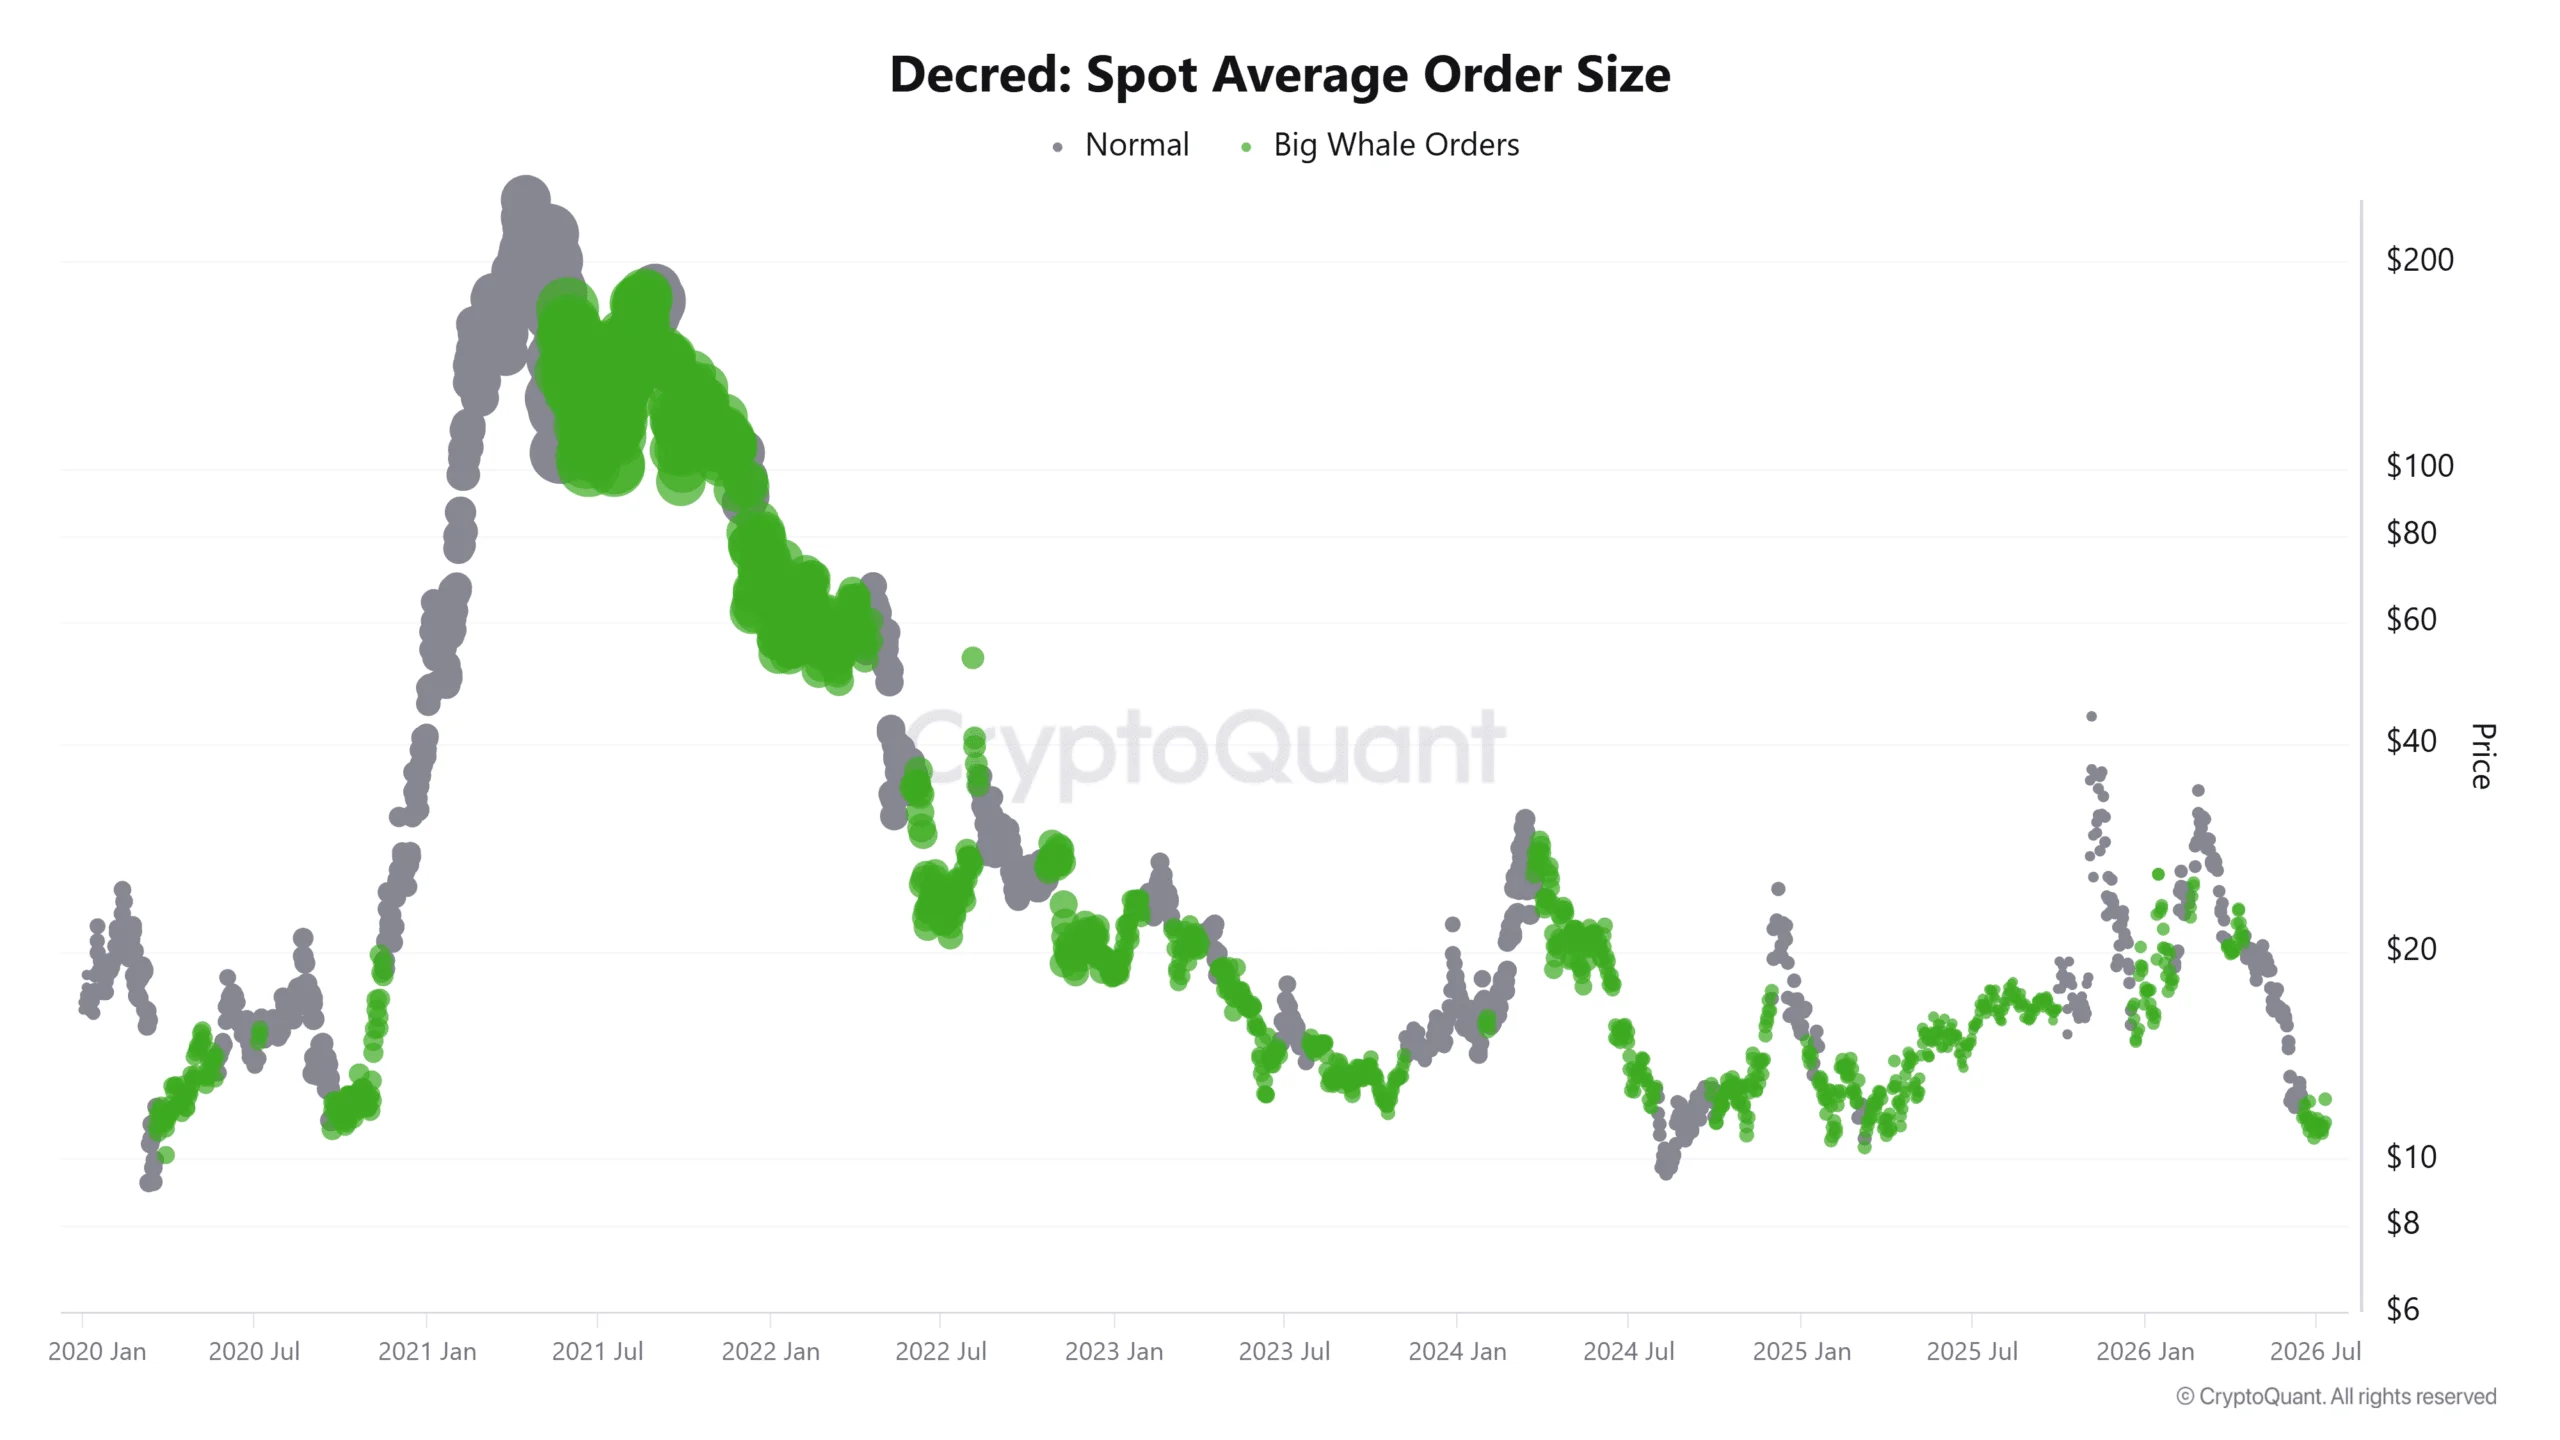
Spot Average Order Size showed the appearance of big whale orders during the rally, revealing that larger participants had become increasingly active. This development aligned with the sharp increase in trading volume instead of contradicting it.
Larger transactions generally reflected stronger capital deployment than retail-driven activity. Although the indicator did not reveal whether every order represented buying or selling, it confirmed institutional-scale participation had increased.
Such participation often carried greater influence over short-term price direction because larger orders absorbed liquidity more efficiently. As interest from bigger players expanded, Decred attracted broader market attention.
Even so, continued participation from these traders would remain necessary if buyers intend to sustain the recent advance.
Source: CryptoQuant
Channel breakout shifted DCR’s technical outlook
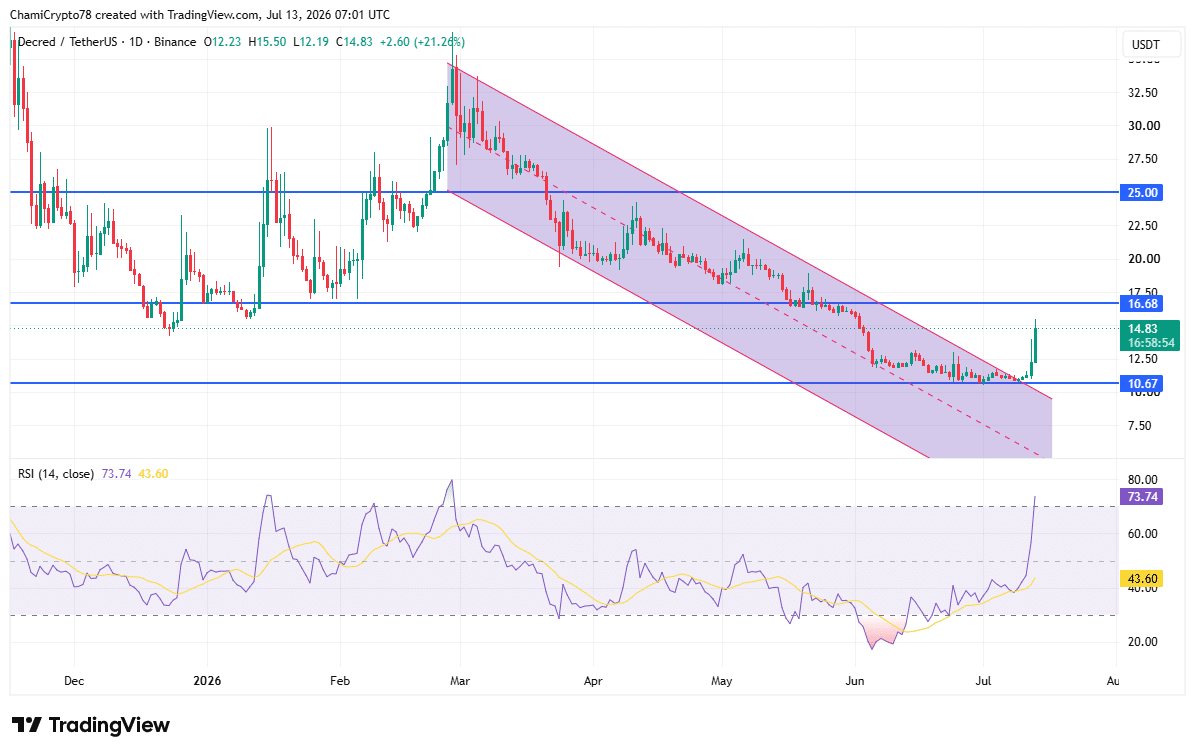
DCR broke above its multi-month descending channel after spending several months respecting lower highs and lower lows. The breakout marked the first decisive violation of the bearish structure visible on the daily chart. Price also rebounded strongly from support near $10.67 before climbing toward the next major resistance at $16.68.
Meanwhile, the Relative Strength Index reached 73.74 as of writing, placing the indicator inside the overbought territory after a sharp rise from neutral conditions. Such readings typically indicate exceptionally strong buying activity, but they also warn of potential short-term exhaustion.
Even so, the breakout remained technically significant because the price closed above the descending channel rather than rejecting from its upper boundary. If buyers defend the breakout zone, DCR could challenge $16.68. Otherwise, profit-taking could trigger a healthy pullback before another attempt higher.
Source: TradingView
Can DCR clear $16.68 next?
Decred’s breakout significantly improved its technical structure after months of sustained weakness.
Rising volume and increased whale-sized orders supported that shift, although seller dominance within Spot Taker CVD showed supply had not disappeared.
If buyers continue absorbing aggressive selling, DCR could reclaim $16.68 and strengthen the recovery. Otherwise, persistent selling pressure near resistance could slow the advance before the next directional move develops.
Final Summary
Decred broke its long-term downtrend while rising volume reflected renewed market participation.
Seller pressure persisted, yet buyers absorbed supply as DCR approached key resistance near $16.68.
Longleaf Partners, managed by Southeastern Asset Management, released its second-quarter 2026 investor letter for its “Partners Fund”. A copy of the letter can be downloaded here. The letter states that the portfolio holdings are attractive now based on both P/V and P/FCF metrics. However, the Fund returned 3.87% in the quarter, significantly lagging the S&P 500’s 15.20% return and the Russell 1000 Value Index’s 13.87% gain. An underweight in Information Technology (IT) primarily contributed to the underperformance. The market’s preference for overvalued stocks in Industrials and other sectors led to inflated multiples, overshadowing real earnings power. The Firm’s investment approach focuses on median, unweighted multiples, prioritizing growth in free cash flow per share, the potential for multiple expansion, and strategic initiatives. In addition, please check the Fund’s top five holdings to know its best picks in 2026.
In its Q2 2026 investor letter, Longleaf Partners Fund highlighted CNX Resources Corporation (NYSE:CNX). CNX Resources Corporation (NYSE:CNX) is an independent natural gas and midstream company. The one-month return of CNX Resources Corporation (NYSE:CNX) was -2.94%, and its shares lost 9.12% of their value over the last 52 weeks. On July 10, 2026, CNX Resources Corporation (NYSE:CNX) stock closed at $31.99 per share, with a market capitalization of $4.53 billion.
Longleaf Partners Fund stated the following regarding CNX Resources Corporation (NYSE:CNX) in its Q2 2026 investor update:
“CNX Resources Corporation (NYSE:CNX) – After contributing in the first quarter, natural gas company CNX Resources detracted in the second quarter. The company reported another solid quarter and continues to focus on steadily growing FCF per share and value per share. While it was mildly disappointing that CNX did not get a fuller runup earlier in the year like some of its less conservatively financed energy stock peers yet still traded off this quarter, we take comfort knowing that the company has been one of our best share repurchasers over the last several years. This means that stock pullbacks are buying opportunities for the company and for us. We had trimmed our position when energy stocks were riding highest in the wake of the Iran War, but we added back to CNX at better prices recently.”
Is CNX Resources (CNX) the Top Oil & Gas E&P Stock Outperforming Despite Sinking Oil Prices?
CNX Resources Corporation (NYSE:CNX) is not on our list of 40 Most Popular Stocks Among Hedge Funds Heading Into 2026. According to our database, 42 hedge fund portfolios held CNX Resources Corporation (NYSE:CNX) at the end of the first quarter, compared to 46 in the previous quarter. While we acknowledge the potential of CNX Resources Corporation (NYSE:CNX) as an investment, we believe certain AI stocks offer greater upside potential and carry less downside risk. If you’re looking for an extremely undervalued AI stock that also stands to benefit significantly from Trump-era tariffs and the onshoring trend, see our free report on thebest short-term AI stock.
Robinhood’s (HOOD) new blockchain has posted a strong debut, quickly emerging as one of the busiest networks for decentralized trading and reinforcing the broker’s strategy to expand tokenized financial products, Wall Street broker Bernstein said in a Monday research report.
Since launching its mainnet on July 1, Robinhood Chain has generated $3.1 billion in decentralized exchange trading volume over the past week, making it a top-five chain by DEX activity, the broker said. More than 65,000 users now hold around $13 million in tokenized stocks and $300 million in stablecoins on the network.
“Strong early adoption highlights the growing convergence of tokenized real world assets with the broader DeFi ecosystem, as industry participants continue to innovate across multiple business models for regulated asset tokenization,” wrote analysts led by Gautam Chhugani.
Robinhood launched the public mainnet of Robinhood Chain on July 1, an Ethereum layer-2 blockchain built on Arbitrum that’s designed for tokenized real-world assets and decentralized finance.
The network underpins the firm’s tokenized stock offering, enabling 24/7 trading, self-custody and onchain use cases such as lending and collateral, while supporting integrations with decentralized applications and liquidity providers.
Gold (GC=F) August futures opened at $4,106.60 per troy ounce on Monday, July 13, 2026, down 0.2% from Friday’s closing price. As of 8:29 a.m. ET, the price of gold was down to $4,068.10.
Gold prices opened lower and are moving lower still following several exchanges of airstrikes between the U.S. and Iran over the weekend. Geopolitical events continue to be the most influential driver of precious metal prices.
At the moment, it’s still unclear how the latest attacks have affected shipping traffic in the Strait of Hormuz, as there have been conflicting reports from Washington and Tehran about whether the strait is open and whether oil shipments are moving through it.
These latest escalations have sent oil prices (BZ=F) over 9% higher over the last five-day period, carrying gas prices higher right along with them. The longer these conflicts continue, the more inflation will remain a central focus for the Fed in its upcoming rate decisions. Higher rates tend to put downward pressure on gold prices.
Current price of gold
The opening price of gold futures on Monday, July 13, 2026, was down 0.2% from Friday’s closing price. Here’s a look at how the opening gold price has changed versus last week, month, and year:
One week ago: -1.6%
One month ago: -2.4%
One year ago: +23.3%
For context, the one-year gain for gold was 95.6% on Jan. 29.
Want to learn more about the current top-performing companies in the gold industry? Explore a list of the top-performing companies in the gold industry using the Yahoo Finance Screener. You can create your own screeners with over 150 different screening criteria.
Gold prices explained
The price of gold can be quoted in multiple forms because the precious metal is traded in different ways. The two main gold prices investors should know about are spot prices and gold futures prices.
The spot price of gold is the current market price per ounce for physical gold as a raw material, sometimes called spot gold. Gold ETFs that are backed by physical gold assets generally track the gold spot price.
The spot price is lower than what you’d pay to buy gold coins, bullion, or jewelry, since your total price will include a markup called the gold premium that covers refining, marketing, dealer overhead, and profits. The spot price is more like a wholesale price, and the spot price plus the gold premium is the retail price.
Gold futuresare contracts that mandate a gold transaction at a specific price on a future date. These contracts are exchange-traded and more liquid than physical gold. They settle on the contract expiration date or earlier, either financially or via delivery. A financial cash settlement involves paying the contract’s profit or loss in cash. Delivery means the seller sends physical gold to the buyer for the contracted price.
Factors that affect gold prices
Supply and demand determine gold spot prices and gold futures prices. Factors that influence gold supply and demand include:
Liquidity often separates a market bottom from a prolonged bear phase.
The logic is simple: During a risk-off market, capital can either move to the sidelines or leave the crypto ecosystem altogether.
Understanding the difference between these two behaviors is key to identifying whether the market is approaching a bottom or entering a deeper bear phase.
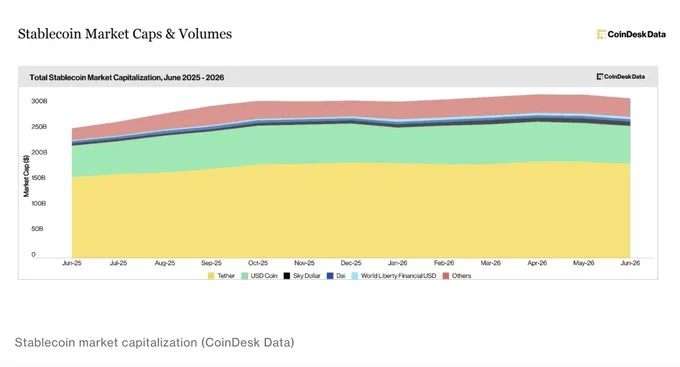
Notably, this is where the latest stablecoin flows come into focus. As the chart below shows, the stablecoin market cap has fallen by nearly $10 billion since May, with $7.7 billion leaving in June alone, marking the largest monthly contraction since the Terra-Luna collapse in May 2022.
Source: CoinDesk
In other words, the crypto market has seen two straight months of liquidity leaving the ecosystem, with June posting the biggest stablecoin outflow in four years.
That’s a strong sign the market remains firmly in a risk-off phase, drawing clear parallels with the liquidity conditions seen during the 2022 bear market.
From a technical perspective, this liquidity contraction lined up with Bitcoin’s 3.6% correction in May and a 20.45% decline in June.
Together, these signals suggest BTC’s current correction is looking less like a bottoming process and more like the type of liquidity-driven weakness that defined the 2022 bear cycle.
The next question is whether that trend is starting to change.
Stablecoin dominance hints at Bitcoin’s next bottom
Normally, a risk-off environment typically drives capital into traditional safe-haven assets.
However, that’s not what happened this time. Gold closed May down 1.6% and June down 11.73%; even stablecoins recorded their largest monthly outflow.
In other words, the capital leaving stablecoins did not rotate into gold, suggesting investors weren’t simply shifting from one defensive asset to another.
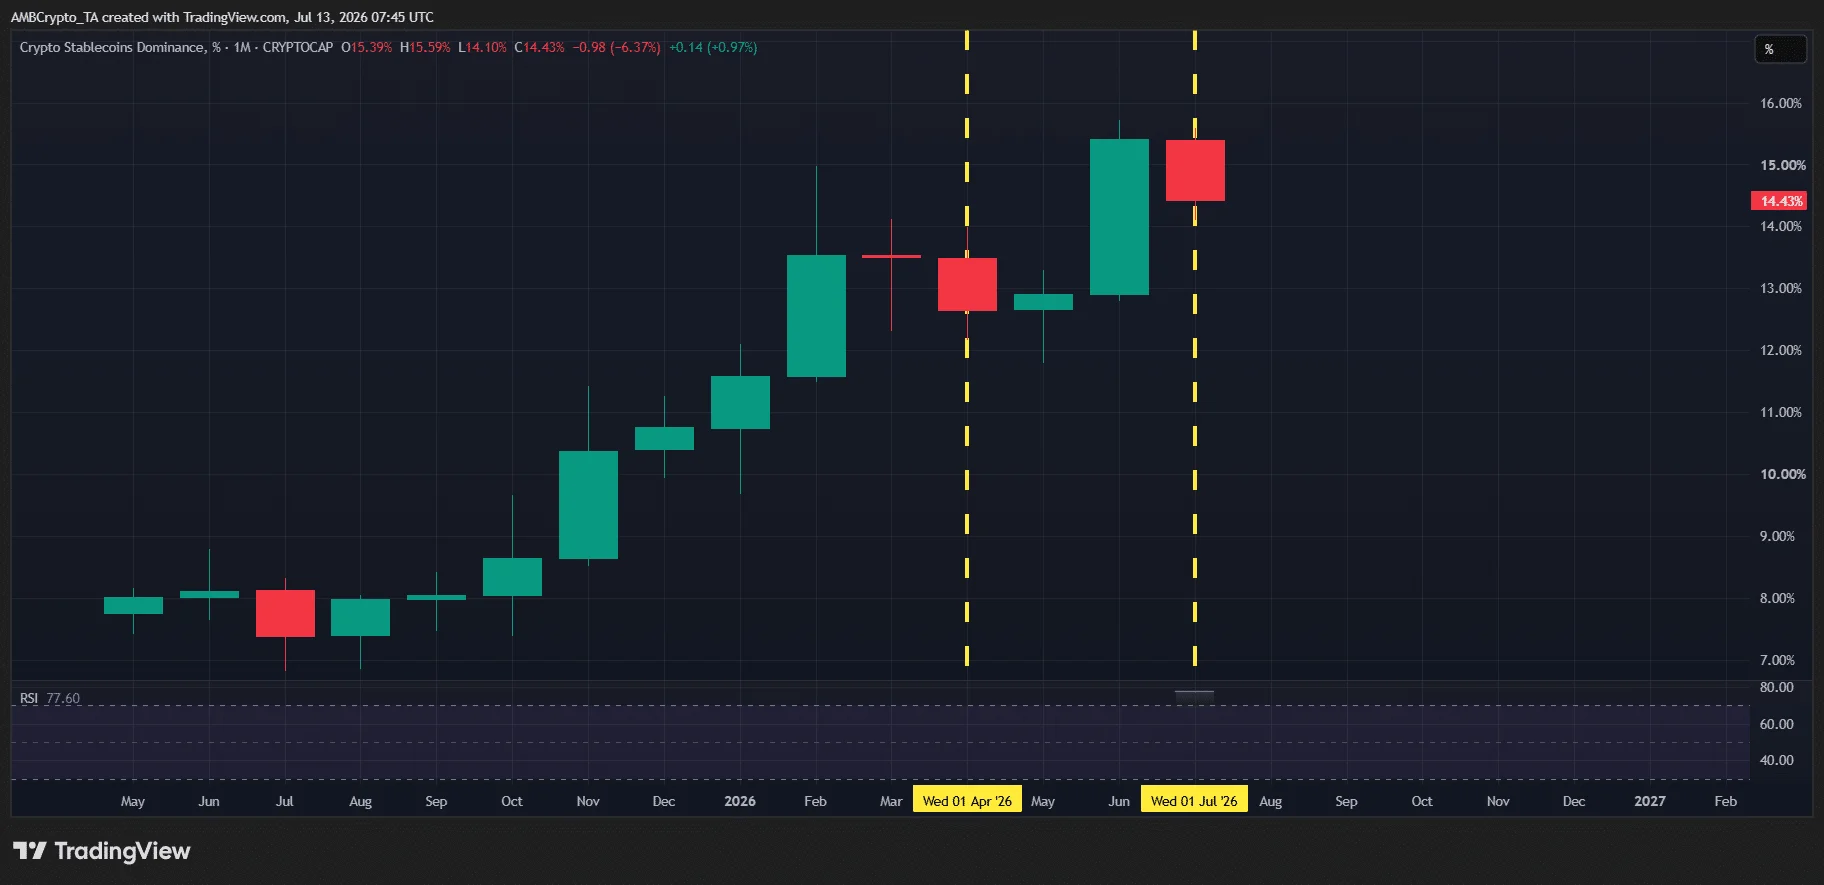
According to AMBCrypto, that divergence could be one of the key signals to watch this cycle. As the chart below shows, Stablecoin Dominance (STABLE.D) has fallen 6.5% so far this month after climbing more than 20% over the previous two months.
At the same time, Bitcoin Dominance (BTC.D) has continued to hold around 60%, despite slipping nearly 3% over the same period.
Source: TradingView (STABLE.D)
Taken together, these signals suggest the liquidity contraction that accelerated through May-June may be starting to slow.
More importantly, with BTC.D still holding near 60%, and there is no meaningful rotation into gold, and capital remains largely “Bitcoin-centric.” That’s a notable shift from the 2022 bear market, where liquidity broadly exited risk assets instead of staying concentrated in Bitcoin.
Therefore, if STABLE.D continues to trend lower, it would suggest sidelined capital is gradually moving back into the market. That makes a bottom in STABLE.D one of the key signals to watch, as it could coincide with Bitcoin finding a bottom and beginning its next move higher.
Final Summary
June saw the largest stablecoin outflow in four years, but the money didn’t move into gold, suggesting investors are staying on the sidelines.
With STABLE.D falling and BTC.D holding near 60%, a bottom in stablecoin dominance could signal Bitcoin’s next move higher.
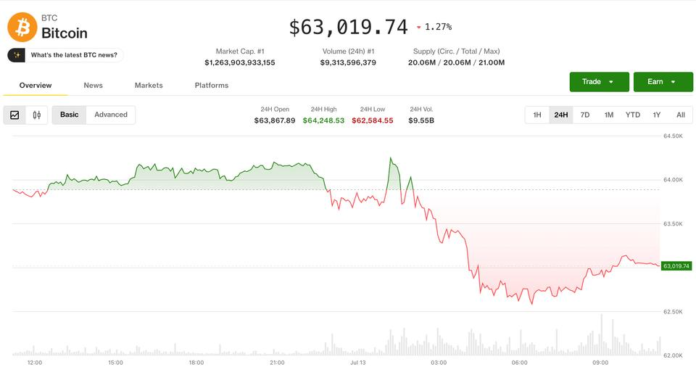
The crypto market pulled back during Asian and European hours on Monday, with bitcoin BTC$63,009.74 falling to $63,100 from above $64,300 at the weekly close at midnight UTC.
That’s a decline of about 1%. Steeper losses hit the altcoin market. Lighter (LIT) led the downside cascade, sliding 8% in its first major selloff since rallying by more than 200% over the past two months.
The exit from riskier assets was felt across equity markets, too. South Korea’s Kospi index lost 9.2% as SK Hynix, the memory-chip maker that went public in the U.S. on Friday, slumped 15%. Japan’s Nikkei and China’s SSE both fell more than 2%.
The drops reflected reignited tensions in the Middle East as Iran and the U.S. fought over control of the Strait of Hormuz, with both nations firing airstrikes against each other.
U.S. equities are also indicated to open lower, with Nasdaq 100 index futures and S&P 500 futures losing 0.9% and 0.25% since midnight, respectively.
It’s worth noting that going into the weekend bitcoin and the broader crypto market enjoyed a period of bullish price action, steering itself away from immediate danger, and Monday’s selloff could also be attributed to profit-taking.
Derivatives positioning
Bitcoin derivatives positioning held steady this week. Open interest (OI) was steady at $17 billion, while the three-month annualized basis held at 3.8%.
Funding rates were little changed to positive across multiple venues, with Bybit the notable exception at roughly -13% annualized on BTC perps. Stable OI alongside a firm basis and constructive funding suggests the market is holding its positioning without meaningful new leverage being added in either direction
Options positioning has tilted bullish. The 24-hour put/call ratio sits at 64/36 in favor of calls, and while the one-week delta skew remains elevated at 16%, it has narrowed from 26% a week ago, suggesting call demand is easing off rather than building.
The at-the-money term structure remains in contango, with the front end around 34%-35% and the long end at ~43% out to mid-2027, which implies traders see a calm longer-term volatility environment
Coinglass data shows $253 million in 24-hour liquidations, with a 76-24 split between longs and shorts. BTC ($70 million) and ETH ($60 million) led in terms of notional liquidations.
The Binance liquidation heatmap indicates $62,000 as a core liquidation level to monitor, in case of a price drop.
Token talk
AI tokens FET and NEAR showed strength, rising by around 1.5% apiece despite the rest of the market suffering losses.
Hyperliquid (HYPE) followed rival LIT down, dropping by around 3.3% to $65.1, its lowest point since July 2.
CoinMarketCap’s “Altcoin Season” indicator reflects the recent volatility. The measure is reading 56/100 after rising from last week’s average of 50. This implies more risk-on sentiment from investors following months of heavy losses.
One of the most volatile tokens of late has been ADA$0.1597, which suffered a grueling 39% downturn in June before bouncing by more than 40% at the start of July. It has since retraced that upshift, losing 19% since July 4.
Solana-based decentralized exchange jupiter (JUP) has also struggled of late, losing more than 15% over the past week as daily trading volume dwindled to just $17 million, down from 2025 when it regularly topped $500 million.
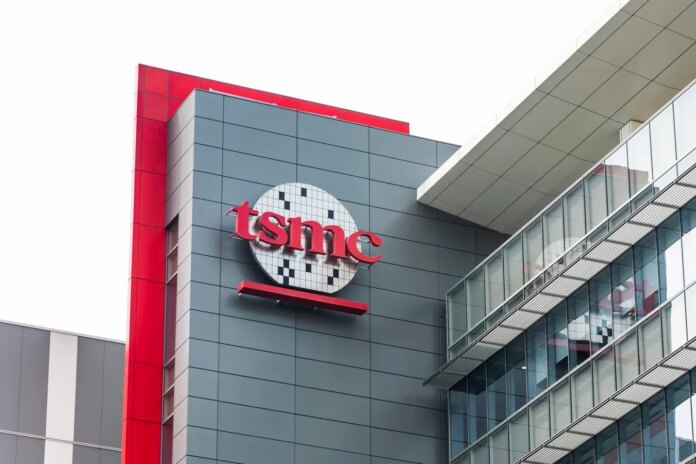
Taiwan Semiconductor Manufacturing Company (TSMC) plant in Tainan Science Park, Taiwan; TSMC is the world’s largest dedicated independent semiconductor foundry.
Getty
Taiwan Semiconductor’s second quarter earnings could cure—or aggravate—AI investing jitters. The chip foundry is the undisputed leader in the manufacture of high-performance AI chips and advanced packaging technology that helps chips work together more efficiently.
TSMC’s customers are the largest drivers of AI capital spending, so the company has a close view on the demand dynamics shaping the industry. For that reason, investors and analysts are watching TSMC’s earnings, capital budget and commentary closely to gauge the health and trajectory of the AI buildout.
Evaluating TSMC’s 2026 Momentum
In 2026, Taiwan Semiconductor is converting strong AI-related demand into solid revenue and profit gains. In the first quarter, TSMC reported a year-over-year revenue gain of 35.1% in New Taiwan dollar terms. Gross margin increased to 66.2% from 58.9% in the prior year quarter, supporting a diluted EPS gain of 58.3%. Capital expenditures were slightly below the prior quarter’s spend, and 6% higher than the same quarter last year.
The company’s high-performance computing platform, which includes AI solutions, produced 61% of revenue. The next-largest platform in the quarter was smartphone, accounting for 26% of revenue.
TSMC Financial Snapshot And Forward Milestones
Taiwan Semiconductor reports in New Taiwan dollars and uses a weighted average exchange rate to convert quarterly metrics into U.S. dollars. The U.S.-traded security is an ADR trading on the NYSE as TSM. Each ADR represents five ordinary shares, so there are separate figures for EPS and earnings per ADR.
The table below summarizes the key financial metrics for the first quarter and projected 2026 values for revenue, gross margin and capital expenditures.
Key Focus Areas For TSMC’s Second Half Of 2026 Guidance
Capital Spending
Capital spending represents risk and reward at TSMC. Company leadership has said the capital spending is “always correlated” with higher growth opportunities. But the capital-intensive nature of foundry business is inherently risky. During periods of high demand, TSMC must expand capacity while innovating to enable faster, more efficient processing.
In the first quarter, TSMC said its 2026 capital spending budget would land toward the high end of its $52 billion to $56 billion guidance range. A reduction from that range could signal a more cautious growth outlook.
AI/HPC/5G Demand
TSMC has identified AI, high-performance computing, and the 5G buildout as megatrends driving the industry. Demand created by these trends, led by AI, drives the company’s capital spending budget and its outlook.
In the first quarter 2026 earnings call, TSMC chairman and CEO C.C. Wei characterized AI demand as “extremely robust.” Analysts expect to hear more of the same in the second quarter update.
Advanced Packaging Capacity
TSMC’s advanced packaging technology, CoWoS, is increasingly becoming a competitive differentiator and growth story. CoWoS is the industry standard method for integrating multiple chips into a single unit to create performance gains.
The problem is that CoWoS production is constrained, even more so than chip output. Nvidia has reportedly booked 60% of TSMC’s CoWoS capacity through 2026 plus more than half of the 2026-2027 expansion.
TSMC is addressing the bottleneck by building advanced packaging facilities in Arizona and “ramping up two new packaging facilities in Taiwan” according to CNBC. Analysts will want to know the progress of these buildouts.
N2 Ramp Progress
N2 is the latest generation of TSMC’s chip technology, which should command the highest pricing and margins. Prior generations N3, N4, and N5 are less powerful and efficient for high-performance applications but remain in demand for other uses.
The company began high-volume manufacturing of N2 in the fourth quarter of 2025. In the first quarter earnings call, Wei noted that N2 was ramping successfully at two sites, supported by smartphone, AI and HPC demand. Analysts will be watching for more data on N2 margins and how that affects the company’s overall profitability.
Gross Margin Outlook
TSMC recorded a gross margin increase for the first quarter of 2026 and guided second quarter gross margin in the range of 65.5% to 67.5%. The company predicted that N2 production ramp costs and overseas fab expansion could dilute gross margins by 2% to 3% for the full year of 2026.
The margin dilution could continue over the next few years as TSMC continues to ramp and optimize its production capacity. The company’s ability to project N2-related dilution for the second half of 2026 will help analysts evaluate future margin guidance.
What Experts Say About TSMC’s Outlook
Analysts are largely positive about Taiwan Semiconductor’s outlook. Average revenue estimates imply year-over-year sales growth in excess of 35% for the next two quarters. The average 2026 revenue estimate is $5.2 trillion, which would be a 36.5% gain over 2025.
EPS estimates also indicate expected growth. Analysts project $3.83 for the second quarter EPS for a 55% gain over the prior-year result of $2.47. The consensus estimate for 2026 is $15.91 per share, which is 49.3% improvement over 2025.
The Bull Case For H2 2026
Counterpoint estimated that Taiwan Semiconductor owned 73% of chip foundry demand in the first quarter of 2026. That dominance is fueled by TSM’s reputation as a critical design and manufacturing partner to the world’s largest tech companies. That positioning largely ensures that TSMC will profit from ongoing chip demand, which is currently strong and expected to remain that way for years.
The company’s advanced packaging technology should continue to be a differentiator, despite the capacity constraints. There are competing technologies, but they are less mature. And because switching platforms requires a full chip redesign, customers who build around CoWoS tend to stay.
These trends position TSMC for strong growth in the second half of 2026 and beyond.
The Bear Case For H2 2026
TSMC’s annual report filed with the SEC notes that “foundry customers generally do not place purchase orders far in advance” because the technology evolves so quickly. That means the company has limited protection from a massive spending slowdown. Should AI chip demand suddenly dry up, TSMC’s financial performance would reflect the change within a few quarters.
A dramatic slowdown in the short term would be difficult to manage, since it would coincide with heavy capacity investment and rising competition.
Escalating tensions between China and Taiwan represent another threat to TSMC, though probably not an immediate one. China has long expressed its intention to take control of Taiwan, which is currently a self-governing province. Most of TSMC’s manufacturing facilities are in Taiwan, and a military conflict would likely disrupt production.
In March 2026, U.S. intelligence said China is not planning on invading in 2027—but there is no guarantee.
Is TSM Stock One To Buy Now?
Taiwan Semiconductor is a primary beneficiary of the massive AI investments being made by the world’s largest tech companies. So far, TSMC has managed this period of high demand well, maintaining strong profitability while making strategic capacity investments and advancing its technology. Investors like to see that careful balance between managing current operations well while pursuing future growth.
But to invest in TSM stock now, you must believe that AI and HPC demand will remain strong for the foreseeable future. The company is funneling billions into capacity expansions, and those fabs need to be well-utilized. A sharp downturn in demand could lead to excess capacity down the road, at a time when competitors are investing heavily to close the gap.
TSMC is a solid, well-run company with a positive outlook. The second quarter earnings probably report won’t change that conclusion. But it should provide important feedback on how far and fast the AI spending trend will go. You can use that feedback to assess how risky TSMC’s capital budget is and whether this AI stock fits your investment criteria.
Frequently Asked Questions (FAQs)
Taiwan Semiconductor will report its second quarter 2026 earnings on Thursday, July 16, 2026 at 2:00 p.m. Eastern Time. Investors can access the video webcast from investor.tsmc.com.
Yes, TSMC is considered a bellwether for the artificial intelligence industry. The company is the primary fabricator of AI chips and its financial performance is tied directly to AI chip demand from Nvidia, Apple, AMD and the major cloud providers.
Taiwan Semiconductor’s manufacturing capacity is concentrated in Taiwan, a self-governing province that China has threatened to claim by force. Tensions among Taiwan, China and the U.S. present the largest risk to the company’s operations. There is a secondary risk of slowing AI spend.