Solana on-chain activity has dropped to a level never seen since late 2023, further underscoring the structural factor that could derail a strong price recovery.
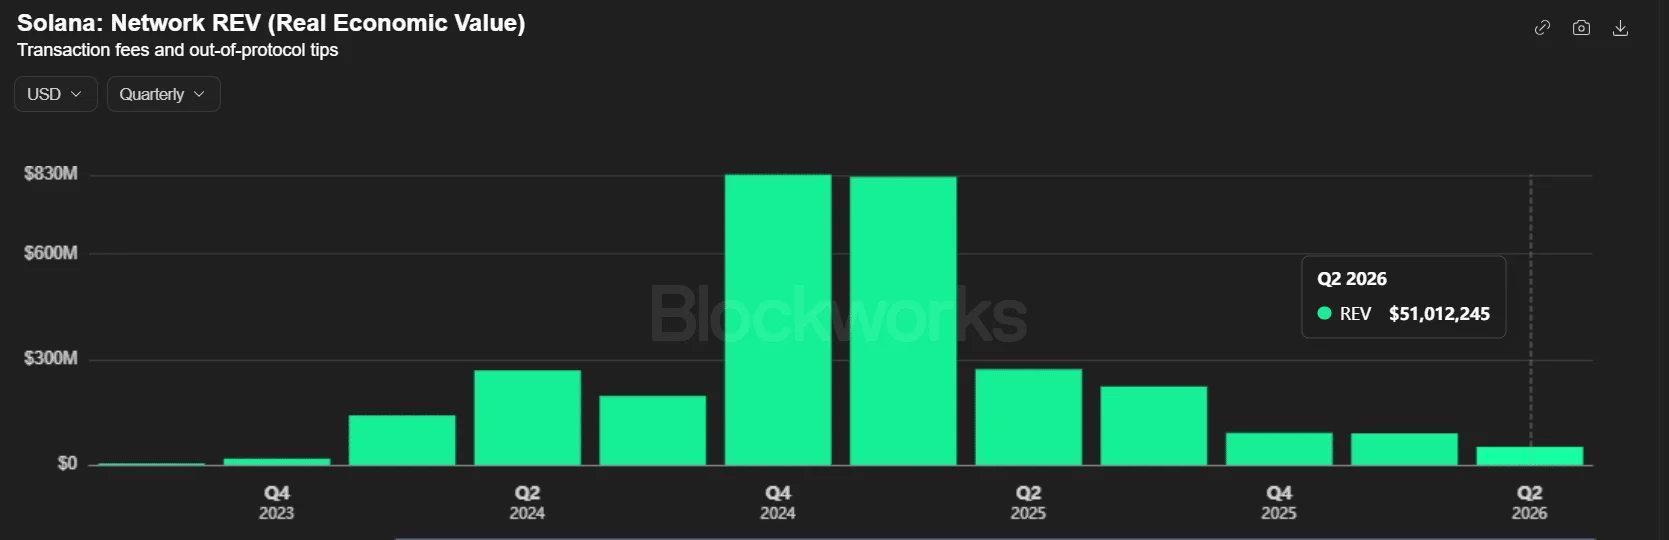
According to a recent DeFi Report, the Solana network did $51M in total fees in Q2 2026, marking a 43% drop from Q1 and 78% on a year-on-year (YoY) basis. Compared to past quarters, this was the lowest fees since Q4 2024.
Source: Blockworks
Since fees track the value paid by users transacting on the chain, it meant the network activity had dropped too. This was not surprising given the broader crypto market downturn since last October.
With the downturn, Solana’s traction as a ‘homebase for speculation’ also contracted over the period. But the report projected that the bear market bottom may have bottomed out in Q2, citing stablecoin growth, tokenization, and perpetual volume surge.
However, it looks like this may have bottomed in Q2. We’re now beginning to see some green shoots within the ‘trenches.’
Despite the said recovery in new narratives, capital inflows into the SOL token were still at a two-year low.
Solana: Assessing SOL’s price recovery
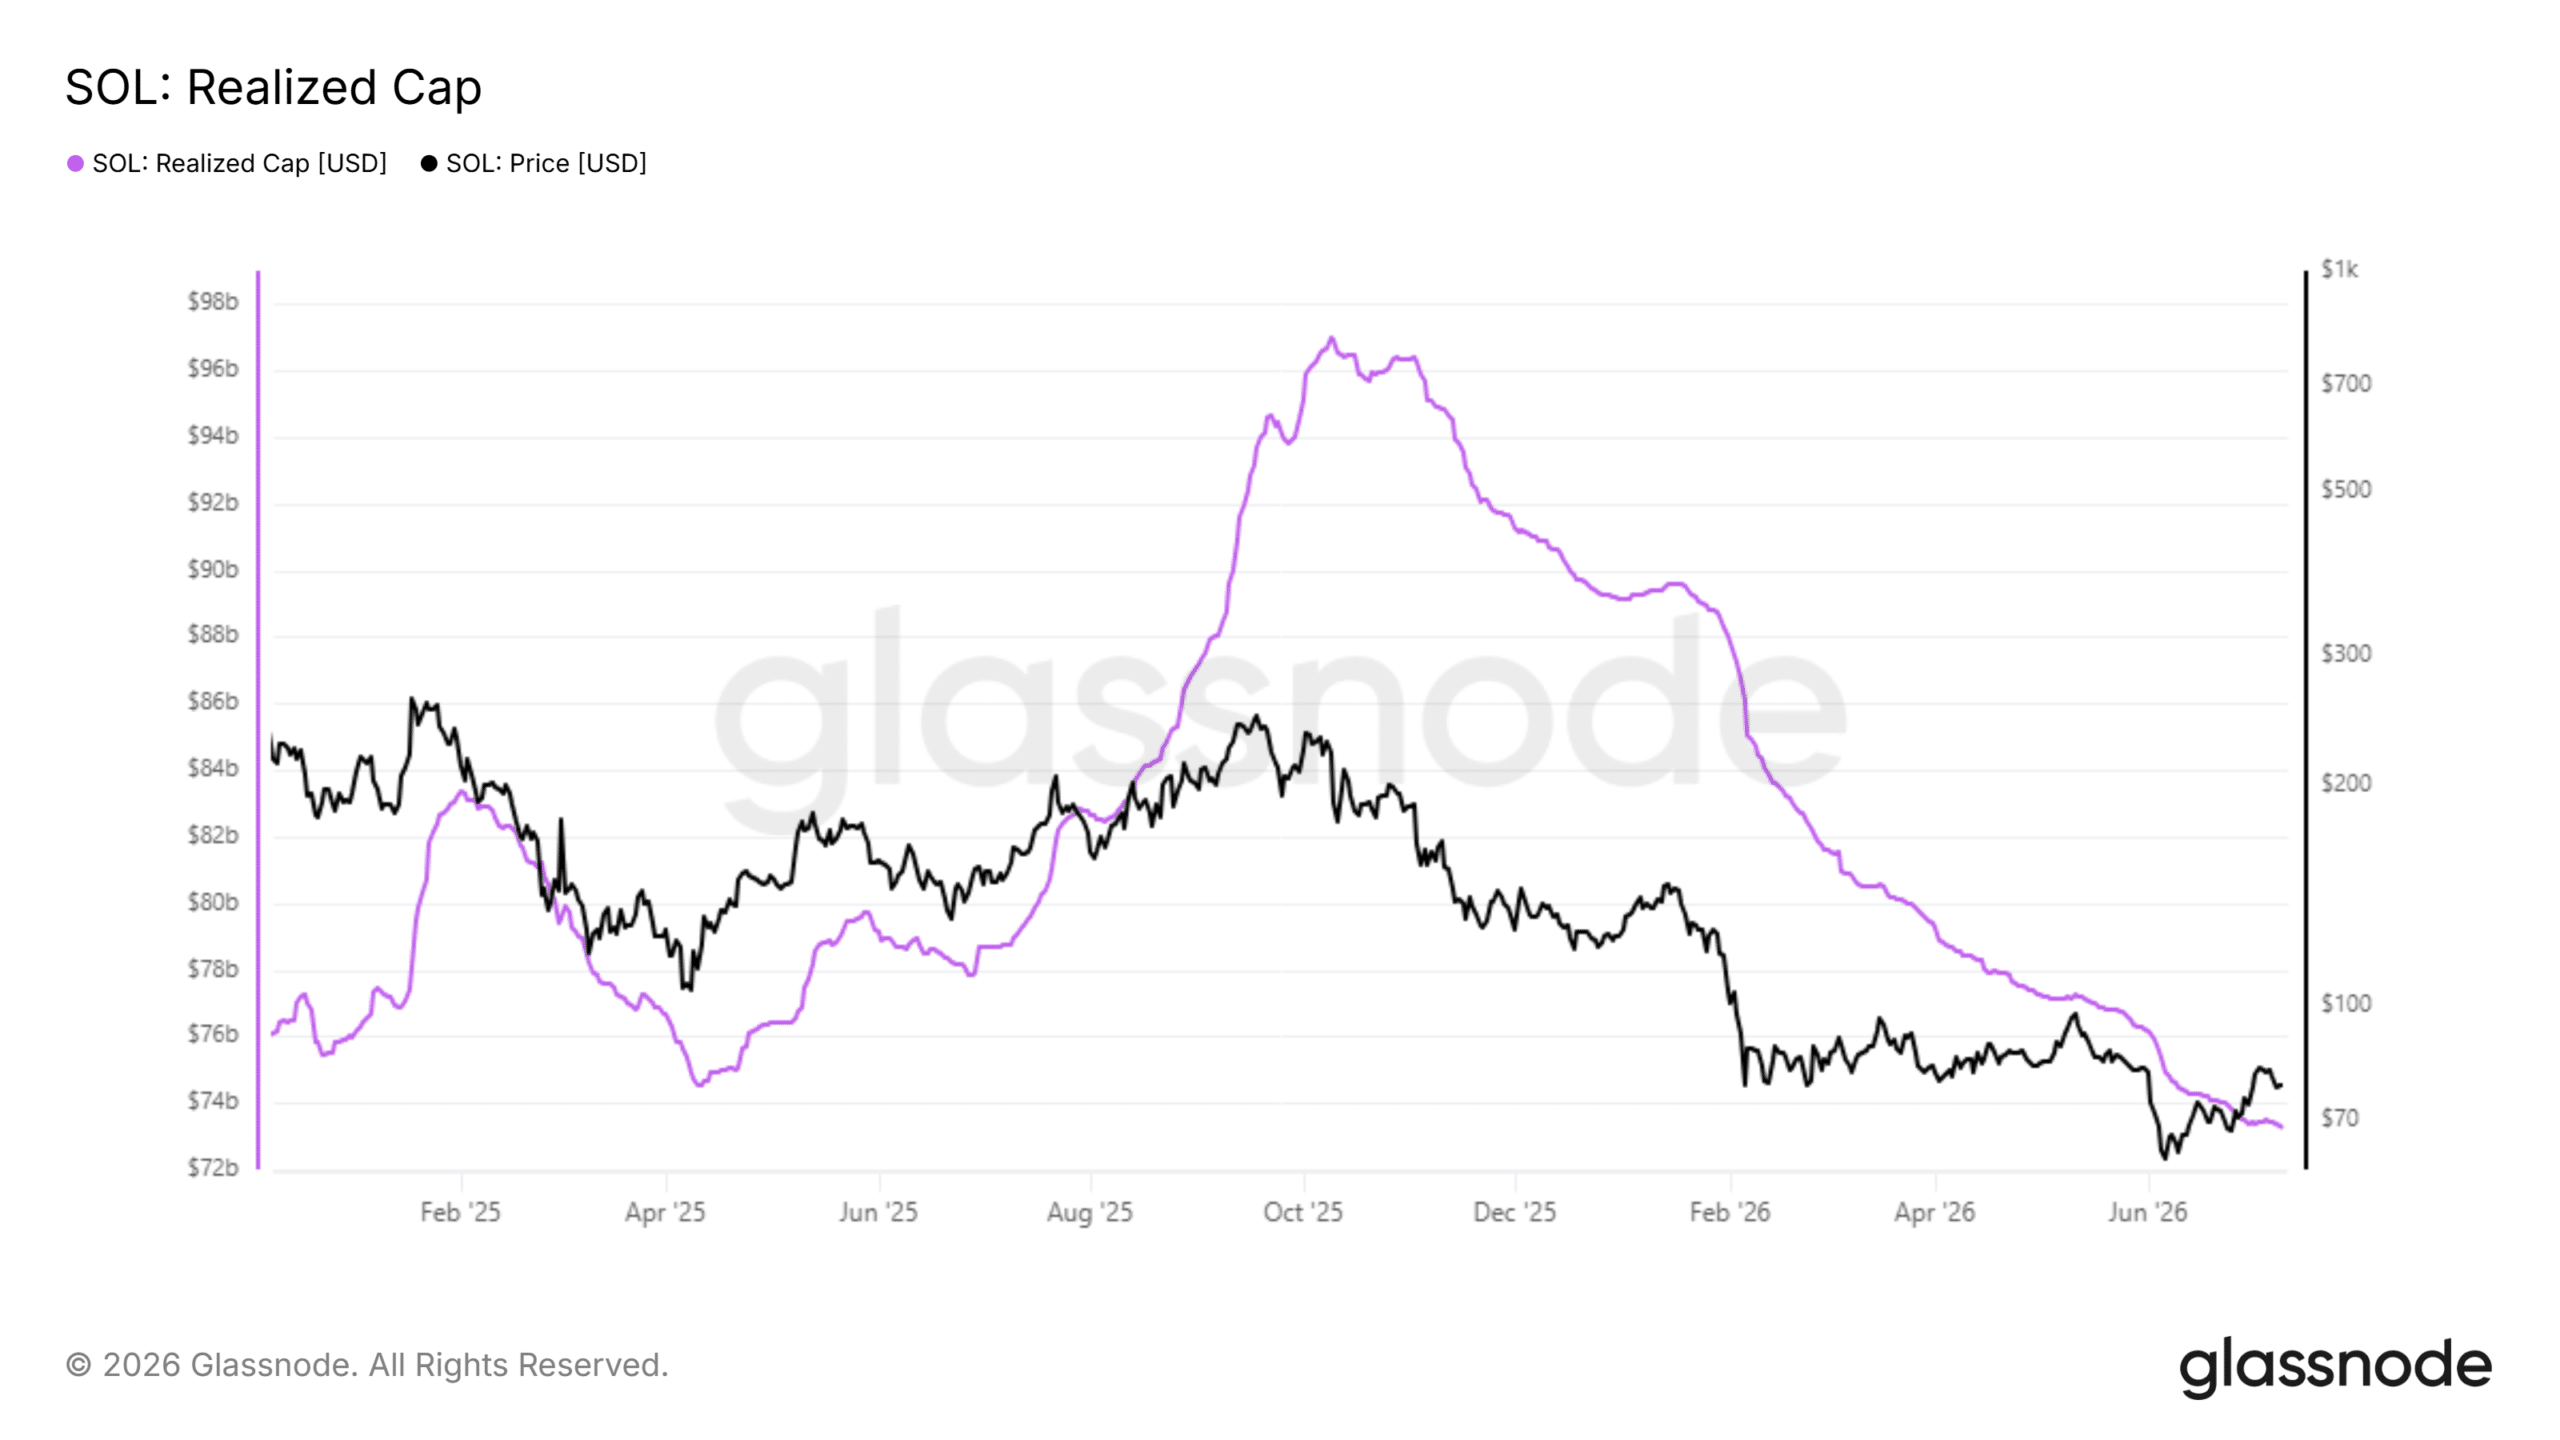
According to Glassnode, SOL’s Realized Cap, which tracks on-chain capital inflows into the SOL market, has dropped from a record $97B last year to $73B in 2026. This was the lowest level the metric has dropped since late 2024.
Source: Glassnode
In other words, SOL saw $24B in capital outflows in the past few months. The bearish trend is yet to reverse despite the recent 28% relief recovery.
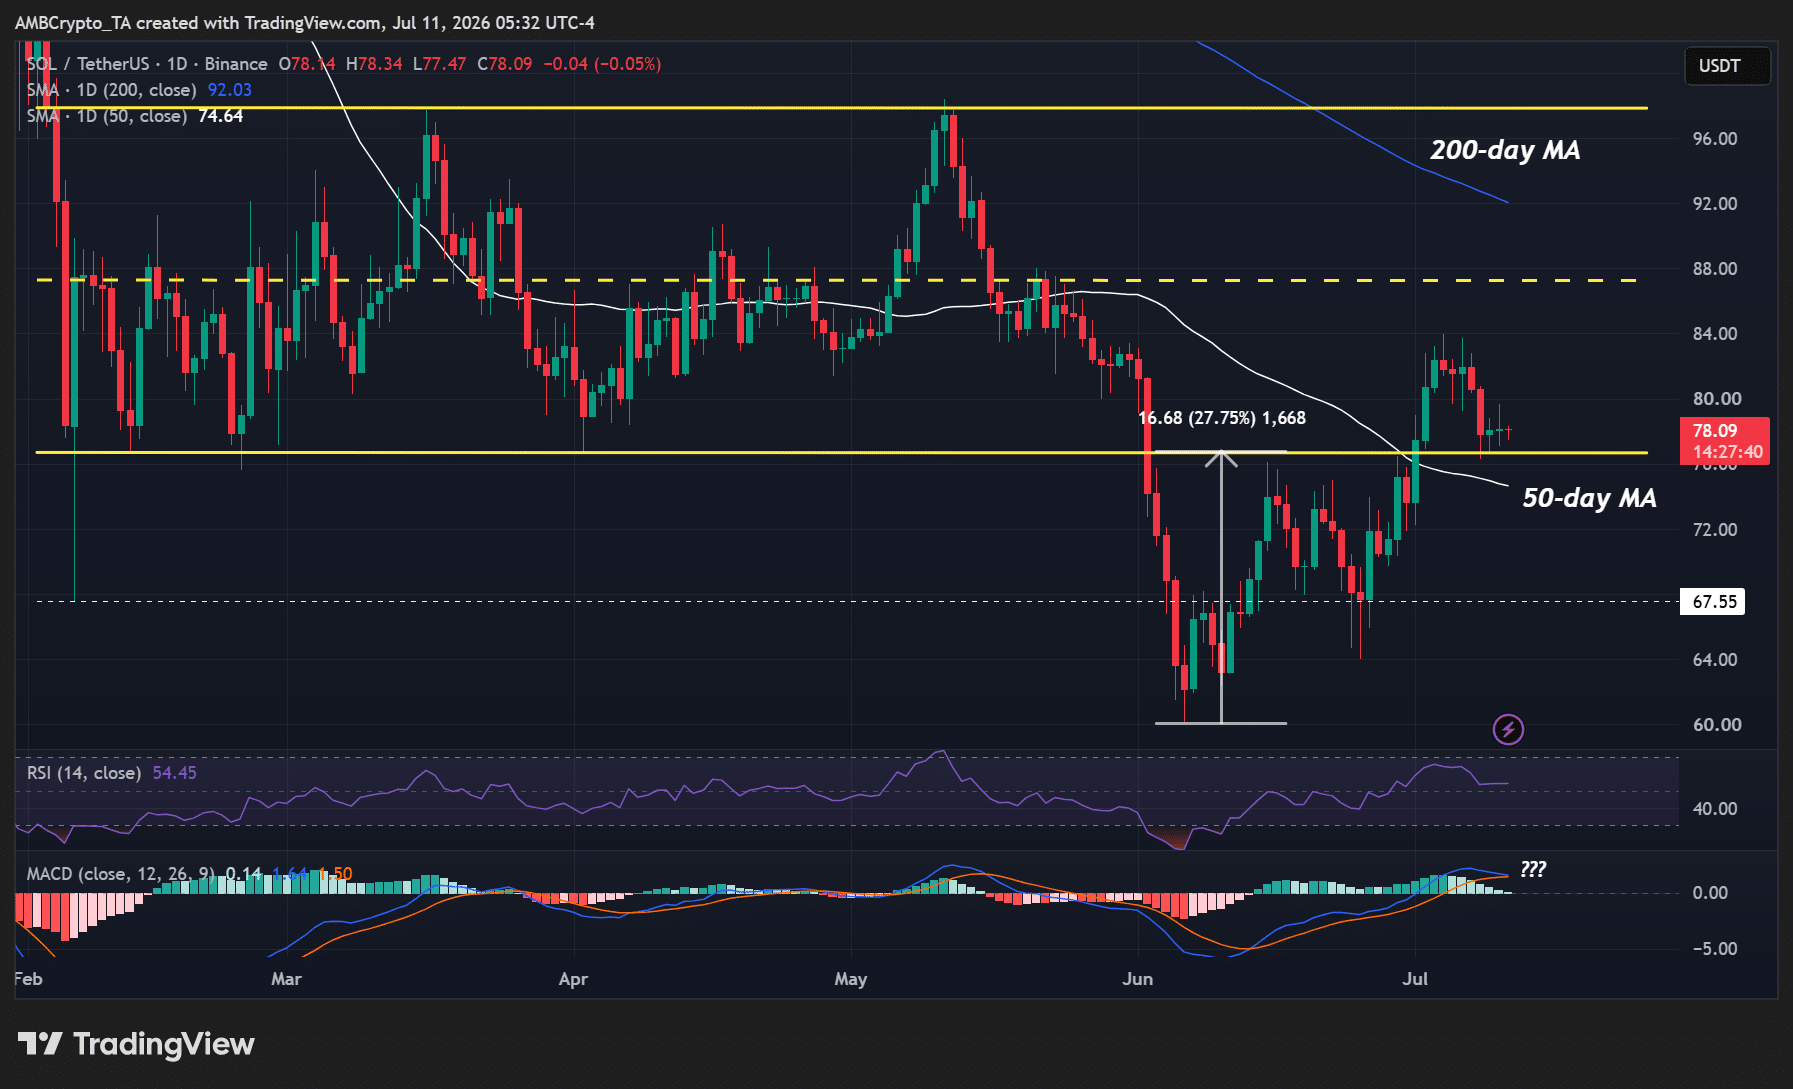
During the broader recovery in early June, SOL bounced from $60 to $84, effectively reclaiming its 2026 range-low of $75 (orange channel). Since February, SOL has been range-bound between $98 and $75.
Source: SOL/USDT, TradingView
It broke below the range after broader market risk-off triggered by Strategy’s BTC sale in early June. If the recent momentum holds, bulls could defend $75 and eye the mid-range level at $88 or the upside target at $92 (200-day Moving Average, blue line).
If so, that would imply a 13% to 20% upside potential assuming BTC does not post more losses in early Q3.
Separately, Web3 researcher Zach XBT reported that an early Solana whale has been exploited and 180.9K SOL ($14.2M) stolen. Should the hacker cash out the funds, it could trigger a short-term sell-off and test the $75 support.
Final Summary
Solana fees plunged 78% YoY to $51M, the worst since late 2023
SOL reclaimed the 2026 price range, but $75 support could be tested if $14M stolen funds hit the market
Despite these headwinds Lopez says regulatory clarity is no longer the primary obstacle for companies considering public listings.
“That’s less relevant than before. Companies went public before there was regulatory clarity,” he said. “For companies like Bullish, Circle or BitGo, it’s more about access to capital than regulation.”
Kraken’s reported plans to pursue a public listing illustrate how crypto firms are adapting, Lopez says. The exchange has sought to diversify beyond crypto trading, a strategy he believes better positions companies for public markets.
“The right thing to do is become more diversified rather than being just a crypto trading business,” he says.
Institutional adoption
Despite near-term weakness in crypto funding markets, Lopez says blockchain technology continues to gain traction across traditional finance. Major financial institutions, including Morgan Stanley (MS), Nasdaq (NDAQ) and the New York Stock Exchange (NYSE), are building blockchain-based infrastructure and preparing for tokenized settlement.
The industry is moving toward near-instant settlement, shifting from T+1 to T+0, while initiatives such as the OpenUSD network are bringing together more than 140 financial institutions and payments companies around stablecoin infrastructure, he says.
Lopez expects the long-term winners to be blockchain infrastructure providers rather than businesses built solely around individual cryptocurrencies.
“A lot of crypto companies trying to raise capital in the private markets are finding it difficult because of their singular focus on one product offering,” he says.
On June 30, 2026, NuScale Power Corporation (NYSE:SMR) Chief Financial Officer Robert Ramsey Hamady reported the sale of 20,000 Class A Common shares — immediately following option exercise — through a Rule 10b5-1 plan, as detailed in this SEC Form 4 filing.
Transaction summary
Transaction and post-transaction values based on SEC Form 4 weighted average sell price of $10.14 on July 1, 2026.
Key questions
What distinguishes this transaction from standard open-market sales? This sale was contingent on the exercise of 20,000 options, with all shares immediately sold as Class A Common Stock — demonstrating the transaction was not a discretionary open-market sale but a liquidity event tied to vesting and exercise mechanics.
How does the transaction affect Hamady’s direct and overall economic exposure to NuScale? While direct Class A share ownership declined by 17.07%, Hamady maintains a material economic stake through other equity instruments, which may be exercised for additional equity exposure in the future.
What is the context of this transaction within Hamady’s recent trading cadence? Since March 2025, Hamady has reduced his direct Class A holdings by 68.43%, with smaller trade sizes in 2026 reflecting diminished remaining share capacity rather than a discretionary moderation of sales.
Was this transaction discretionary or pre-scheduled? The sale was executed under a Rule 10b5-1 trading plan, indicating it was a pre-scheduled event rather than a response to contemporaneous market factors.
Company overview
* 1-year price change calculated as of July 1, 2026.
Company snapshot
NuScale Power Corporation develops and commercializes modular light water reactor nuclear power facilities, including the NuScale Power Module and scalable VOYGR power plant configurations.
The company generates revenue primarily through the design, sale, and licensing of its nuclear power modules and related engineering services for energy, heating, desalination, and industrial applications.
NuScale designs its modular nuclear power plants to serve utilities and industrial operators seeking reliable, carbon-free energy for applications such as electricity generation, heating, desalination, and industrial processes.
NuScale Power Corporation operates at the forefront of advanced nuclear energy technology, offering scalable reactor solutions designed for diverse energy needs. The company’s strategy centers on providing flexible, low-carbon power generation options through its proprietary modular reactor systems.
NuScale’s competitive advantage lies in its ability to deliver customizable nuclear solutions that address both grid-scale and distributed energy requirements.
What this transaction means for investors
The June 30 sale of NuScale Power stock by CFO Robert Hamady came at a time when shares were beaten down. The stock eventually hit a 52-week low of $8.55 on July 8, just days after Hamady’s disposition.
However, his sale is not a red flag for investors. The transaction was automatically executed as part of the CFO’s Rule 10b5-1 trading plan, which he adopted in March of 2026. Such plans are often implemented by insiders to avoid accusations of making trades based on non-public information.
In addition, Hamady retained over 97,000 directly-held shares post-transaction, as well as 165,625 stock options. This combination indicates he maintains a significant equity stake in the company.
NuScale’s stock fell due to disappointing business performance in the first quarter. The company reported revenue of just $565,000. This is an enormous plunge from the $13.4 million made in Q1 of 2025.
The drop in income was due to the completion of some of its projects. Despite the revenue decline, NuScale management insists the opportunity for the company’s nuclear energy solutions is large. Given the expansion of data centers to support artificial intelligence, and the resulting need for power, NuScale has a potentially large market for its offerings.
Should you buy stock in NuScale Power right now?
Before you buy stock in NuScale Power, consider this:
The Motley Fool Stock Advisor analyst team just identified what they believe are the 10 best stocks for investors to buy now… and NuScale Power wasn’t one of them. The 10 stocks that made the cut are built for long-term growth and could produce monster returns in the coming years.
Consider when Netflix made this list on December 17, 2004… if you invested $1,000 at the time of our recommendation, you’d have $395,679!* Or when Nvidia made this list on April 15, 2005… if you invested $1,000 at the time of our recommendation, you’d have $1,294,805!*
That performance is why people listen. With a track record of beating the S&P 500 by 4x, Stock Advisor offers a distinct advantage. Don’t miss the latest top 10 list, available with Stock Advisor, and join an investing community built for the long haul.
Bonzo Lend, a decentralized lending protocol on the Hedera network, suffered an estimated $9.05 million loss after an attacker exploited a verification flaw in a third-party Supra oracle contract, allowing them to borrow assets far exceeding the value of their collateral.
The attacker deposited 250 SAUCE tokens with little value, before submitting a manipulated price update that inflated the token’s HBAR-denominated value, according to a preliminary incident report from Bonzo.
The protocol said the account subsequently borrowed 6.63 million USDC and 34.52 million wrapped HBAR. At the report’s reference HBAR price of $0.06998, the two withdrawals were worth approximately $9.05 million.
A second wallet, the report adds, borrowed roughly $1 million of additional assets while the abnormal price remained active. The wallet later contacted Bonzo through Discord, identified itself as a white-hat responder to the incident and said it intended to return the funds.
Bonzo excluded those assets from its headline loss estimate, placing total principal borrowed during the incident at approximately $10.06 million before recovery.
Hedera, according to DeFLlama data, now has $25.7 million in total value locked (TVL). The figure dropped nearly 40% in the last 24 hours after the exploit. With Bonzo’s TVL
Opinions expressed by Entrepreneur contributors are their own.
Key Takeaways
SEO success depends less on the tools you use than on following the right sequence of research, optimization, content creation and measurement.
This article outlines a 10-step framework founders can use to build sustainable organic growth before hiring an SEO agency.
When founders ask me how to start with SEO, they usually expect a tool recommendation. The honest answer is that the tool isn’t the problem. The sequence is.
For the past few years, my agency has been refining the same end-to-end SEO process — the one I now use with every new client and break down across an eight-module curriculum we run for our team. The steps work because they’re ordered. Most founders fail at SEO not because they skip steps but because they do them in the wrong order: writing content before researching keywords, building links before fixing crawl errors and chasing traffic before defining what kind of traffic moves their business.
Here’s the 10-step sequence I follow, in the order I follow it. You can run all of it yourself for the cost of two free tools and a few weekends.
1. Start with niche research, not keyword research
Before you type a single seed keyword, define what your business actually has the right to win on. A skincare brand selling to dermatologists shouldn’t try to rank for best moisturizer. A SaaS for restaurant owners shouldn’t compete on small business software.
Write down the three or four sub-categories your business owns. Sanity-check each one against the competition in Google’s results. If the first page is dominated by Wikipedia, government sites and major publications, narrow further. Niche before keywords. Always.
Take 30 minutes and write down every phrase your customers actually use to describe their problem, in their own words. Look at your inbound emails, sales call transcripts and product reviews. The vocabulary your customers use rarely matches the vocabulary you use internally — and the customer vocabulary is what ranks.
Once you have a list of 30 to 50 seed terms, open Ahrefs or Google’s Keyword Planner. Tools are for expanding what you already know; they’re terrible at telling you what to know in the first place.
3. Layer in the specialty keyword types your competitors miss
There are at least nine specialty keyword formats most agencies ignore: geographic, seasonal, event-based, question-format, service-based, commercial, comparison, best-of and alternative-to. Each one maps to a different stage of the buying journey, and each one is usually less competitive than the obvious head terms.
In a recent niche project, layering comparison and alternative-to keywords on top of a head-keyword strategy roughly tripled the addressable search volume — without touching a single competitive primary term. The same pattern shows up in nearly every site I audit.
4. Tag every keyword by search intent before writing a word
Every keyword falls into one of four intent buckets: informational, navigational, transactional or commercial investigation. The same phrase can mean different things to different searchers, and the only way to know is to look at what’s currently ranking on page one. Google’s own guidance on understanding user intent comes down to the same principle: match your page to what the searcher actually wants.
If page one is full of blog posts, the intent is informational. If it’s full of product pages, the intent is transactional. Match your page type to the intent before you decide what to write. Mismatched intent is the single most common reason good content fails to rank.
5. Fix your technical foundation before publishing anything new
Before adding new pages, run your site through a free Screaming Frog crawl and Google’s PageSpeed Insights. Look for four things: crawl errors, broken internal links, slow Largest Contentful Paint on mobile and any redirect chains longer than one hop. Each one is silently capping the ceiling on every page you publish.
This is unglamorous work. It’s also the work that determines whether the next six months of effort compound or evaporate.
6. Standardize your on-page template across every new piece
Decide once, then never re-decide: how your title tags are written, how your H1 relates to your title tag, where your primary keyword appears, how internal links are formatted and what your URL structure looks like.
I keep a one-page template that goes on every content brief we send writers. It saves hours of editing per article and produces consistent results across writers who have never spoken to each other. Standardization is what lets you scale; ad-hoc decisions are what burn content teams out.
7. Build content in clusters, not in isolation
For every commercial keyword you target, plan a cluster: one pillar piece and three to five supporting pieces that link inward to it. Search engines reward sites that demonstrate topical depth, and clusters are the cleanest way to demonstrate it.
A single well-built cluster of six pages around one commercial topic will outperform 30 disconnected blog posts every time. Test that against your own analytics if you doubt it. The math is one-sided.
8. Earn links through original data, not cold outreach
Cold outreach link building has been the lowest-yield activity in SEO for at least three years. The replacement is original research: publish one piece per quarter that contains data nobody else has — even if your sample size is small. Journalists and bloggers cite primary sources because primary sources make their work easier.
Last year, one of our small-sample data pieces earned more high-authority backlinks in two months than a previous client’s six-month outreach campaign. The ratio wasn’t close.
9. Track three metrics monthly — and ignore the rest
The SEO industry has trained founders to obsess over dashboards. The truth is that three numbers tell you almost everything: how many of your targeted commercial keywords are ranking in positions 1 to 10, how much qualified organic traffic those rankings produce and how many of those visits assist a conversion.
Ranked positions tell you if your work is paying off. Traffic tells you if the rankings are valuable. Assisted conversions tell you if the traffic is worth the next month of investment. Everything else is noise until you’re operating at meaningful scale.
10. Audit, dedupe and prune every quarter
Most sites lose more SEO performance to keyword cannibalization, duplicate intent and stale content than they gain from new publishing. Every 90 days, audit your existing content: which pages are competing against each other for the same query, which are pulling impressions but no clicks and which are pulling neither?
Merge the cannibalizing pages. Refresh the impression-rich but click-poor pages with better titles and meta descriptions. Redirect the truly dead ones to their nearest healthy cousin. Pruning is unglamorous work that often produces the single biggest one-quarter SEO lift any site will ever see.
The system above isn’t proprietary. Every step is something a careful agency would do, in roughly the same order. What separates the founders who win at SEO from the ones who plateau isn’t access to a secret framework. It’s the discipline to do all 10 steps in sequence, on a quarterly cadence, for two to three years before judging the results.
By the time you do hire an agency, you’ll know exactly what to ask. The ones that can’t answer those questions will filter themselves out before they bill you.
Key Takeaways
SEO success depends less on the tools you use than on following the right sequence of research, optimization, content creation and measurement.
This article outlines a 10-step framework founders can use to build sustainable organic growth before hiring an SEO agency.
When founders ask me how to start with SEO, they usually expect a tool recommendation. The honest answer is that the tool isn’t the problem. The sequence is.
For the past few years, my agency has been refining the same end-to-end SEO process — the one I now use with every new client and break down across an eight-module curriculum we run for our team. The steps work because they’re ordered. Most founders fail at SEO not because they skip steps but because they do them in the wrong order: writing content before researching keywords, building links before fixing crawl errors and chasing traffic before defining what kind of traffic moves their business.
Here’s the 10-step sequence I follow, in the order I follow it. You can run all of it yourself for the cost of two free tools and a few weekends.
Consumers frequently claim that the American shopping mall is dying. Yet a 44-year-old nostalgic mall retailer recently proved that structural changes, including aggressive store optimization, are actually saving it.
As part of my recent retail tracking coverage for TheStreet, I’ve documented how several major mall staples are executing similar strategies to protect their profit margins:
These localized closures don’t signal a retail apocalypse, but rather an uneven landscape heavily dependent on mall layout and tier rankings.
In fact, according to the June 2026 Placer.ai Mall Index, foot traffic actually rose 5.7% year-over-year at open-air shopping centers and 1.9% at indoor malls. A report by Cushman & Wakefield citing Green Street data further underscores this divide, showing that top-tier malls maintain a healthy 95% occupancy rate, while lower C-rated properties languish at just 72%.
Ultimately, modern consumers are shifting toward shorter, mission-driven visits under 30 minutes, causing focused spending across fewer stores per visit.
Now, an iconic staple of youth culture and fashion has trimmed stores from its footprint, aiming to boost sales at its remaining locations.
Tilly’s closed 28 stores over the past two years
Mall staple Tilly’s is known for its cool, youthful vibe. The retailer’s vast offering for teens and young adults ranges from graphic tees to Vans sneakers to Santa Cruz skateboards and gear, embodying the unique skater culture that ruled ’90s and 2000s fashion.
Tilly’s recently reported its first quarter of fiscal 2026 results. Total net sales were $124.7 million, up 15.9% compared to the same period in 2025.
Tilly’s Q1 fiscal 2026 earnings highlights:
Net sales from physical stores were $96.3 million, an increase of 12.1%.
Net sales from e-commerce were $28.4 million, an increase of 30.9%. E-com net sales represented 22.8% of total net sales this year, compared to 20.2% of total net sales last year.
Gross profit was $36.1 million, or 28.9% of net sales, compared to $21.3 million, or 19.8% of net sales, last year.
Net loss improved to $8.0 million, or $(0.26) per share, compared to a net loss of $22.2 million, or $(0.74) net loss per share, last year. Source: Tilly’s Q1 Fiscal 2026 Earnings Document on SEC.gov
In the report, the company confirmed it has closed a total of 18 stores, cutting its traditional mall footprint by more than 7.6% in 12 months.
After analyzing Tilly’s previous reports, I discovered that Tilly’s has closed 28 stores in two years, reducing its footprint by 11%. Based on its latest earnings report, the brand has 220 operational stores remaining, down from the 248 it had at the end of the first quarter of fiscal 2024.
Tilly’s has closed more than two dozen stores over the past two years.Wolterk / Getty Images
Why has Tilly’s been closing stores?
Analyzing Tilly’s latest earnings report, it becomes clear that the company’s performance improved after its quiet downsizing.
Net sales from physical stores grew 12.1% year over year, even though the company operated 18 fewer stores than in the comparable quarter.
“Net sales from physical stores represented 77.2% of total net sales this year compared to 79.8% of total net sales last year,” the report added.
Tilly’s management explained that margins also improved because of improved full-price selling and lower buying, distribution, and occupancy costs “due to decreased occupancy costs associated with reduced store count.
“Fiscal 2025 was a year of significant store optimization, resulting in 21 total store closures,” Tilly’s CEO Nate Smith said during Tilly’s fourth quarter and full year 2025 earnings conference call, as reported by MarketBeat. “We are proud of the fact that we were able to deliver sales growth in the fourth quarter with 17 fewer net stores.”
Smith emphasized that downsizing was a difficult but necessary decision to get back to historical sales levels.
“It requires discipline, focus, and a willingness to make difficult decisions day after day,” the CEO said, adding that “returning to historical levels of store sales, productivity, and the operating performance this business is capable of is the goal we’re driving toward, and we know there is meaningful work still ahead of us to get to that point.”
“There have certainly been some high-profile failures this year, but a lot of space that’s come on the market has been quickly released,” according to Neil Saunders, a retail analyst and managing director of analytics firm GlobalData.
“Vacancy rates remain relatively low. In general, there is too much headline grabbing [a]round store closures. People like to make a thing about physical retail is dead or dying, which is completely untrue.”
Tilly’s is powerhouse behind fashion brands RSQ, West of Melrose
Tilly’s was founded back in 1982 by former Israel Navy officer Hezy Shaked and his wife Tilly Levine. The couple divorced in 1989, but Levine continued to work for the company as director of vendor relations.
Originally known as World of Jeans and Tops, over the years the retailer grew to a national scale. The company went public in May 2012, raising $124 million through its initial public offering of stock.
The Irvine, California-headquartered retailer sells branded apparel, accessories, shoes, and more, including some company-owned brands.
Tilly’s-owned brand names:
RSQ
Full Tilt
West of Melrose
Tilly’s
Additionally, Tilly’s features about 200 different brands, from Asics and Nike to Levis and Von Dutch. You can track its full list of brands here.
What’s next for Tilly’s
It’s evident from the earnings results and the company management’s comments that Tilly’s is not backing down; rather, it is optimizing its operations to improve margins.
Downsizing appears to be working for Tilly’s, which plans not only to close more stores but also to open new ones.
During the first quarter, Tilly’s opened one store and closed four. For the rest of the year, it plans to “open 2 new stores in late July, and 1 more in late October, and to close 1 existing store in mid July and another at the end of the fiscal year,” Smith said.
The CEO added that management is optimistic about the possibility of expanding its net store footprint.
These moves align with the recent mall data, suggesting that top-tier malls are seeing more foot traffic, pushing many brands to close underperforming stores in malls that don’t see enough traffic.
Based on Tilly’s Form 10-K filing with the SEC, the company’s store count spread across Regional Malls, off-mall locations, and outlets as of Jan. 31, 2026, was:
Regional mall: 128
Off-mall: 79
Outlet: 16
“Visits to indoor malls, open-air shopping centers, and outlet malls all remained in positive YoY territory in June 2026, with indoor mall visits up 1.2%, open-air shopping center visits up 5.1%, and outlet mall visits up 1.0% compared to June 2025,” according to Placer.ai.
Additionally, the company plans to invest and launch an “AI-driven merchandise allocation tool before the holiday season to help us improve initial allocation accuracy across our stores and online.”
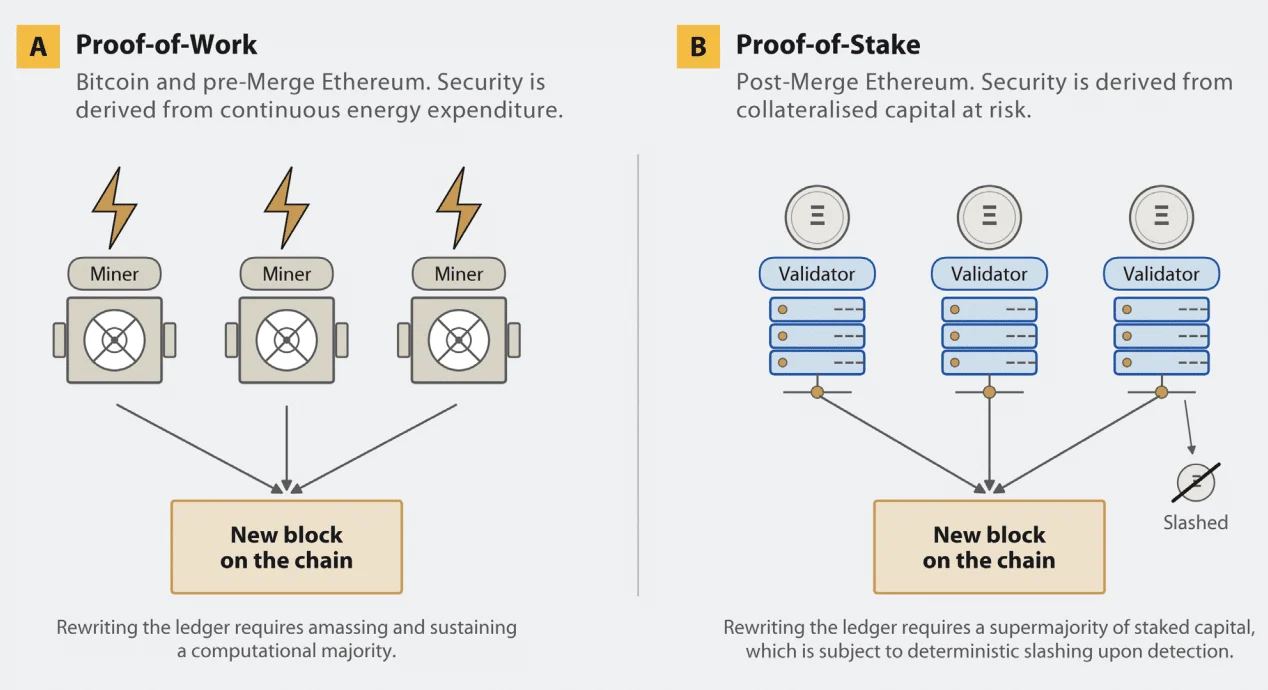
Ethereum has undergone significant change over time, particularly since The Merge.The upgrade replaced the energy-intensive Proof-of-Work (PoW) system with Proof-of-Stake (PoS).
With this change, Ethereum currently uses about 8,522 physical nodes, many of which house multiple validators, and nearly 894,000 validators.
Source: CCAF Report
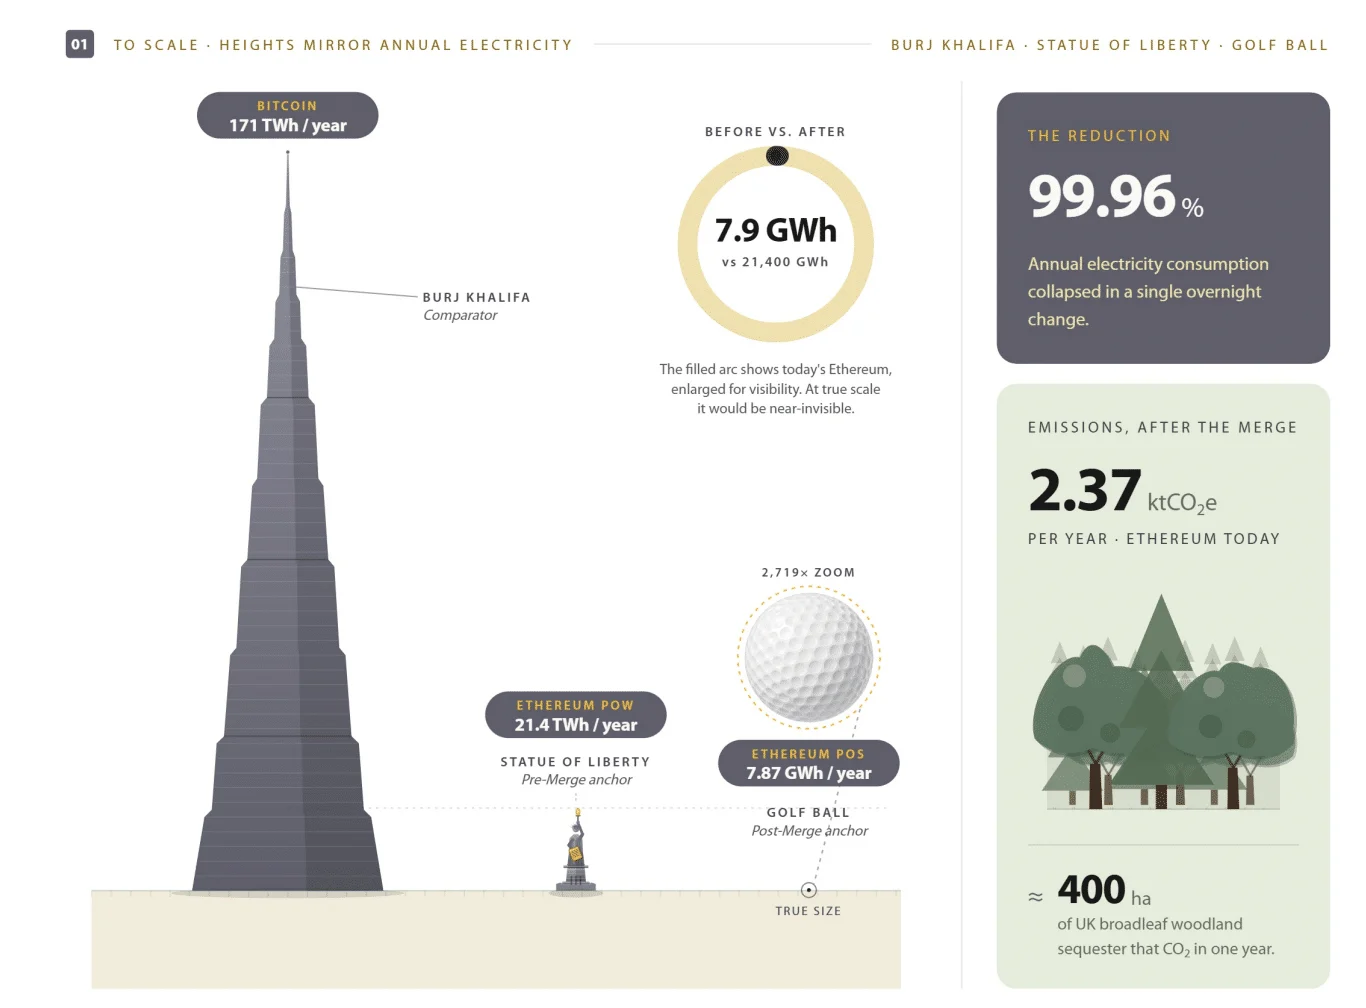
As a result, Ethereum now consumes only 7.87 GWh of electricity annually, or about 0.90 MW of continuous power. That is less than half the British Museum’s annual electricity consumption.
Before The Merge, the network required roughly 2.4 GW of continuous power.
Since then, Ethereum’s electricity consumption has fallen by more than 99.9%, marking one of the largest energy reductions by a major blockchain.
Is Ethereum truly decentralized?
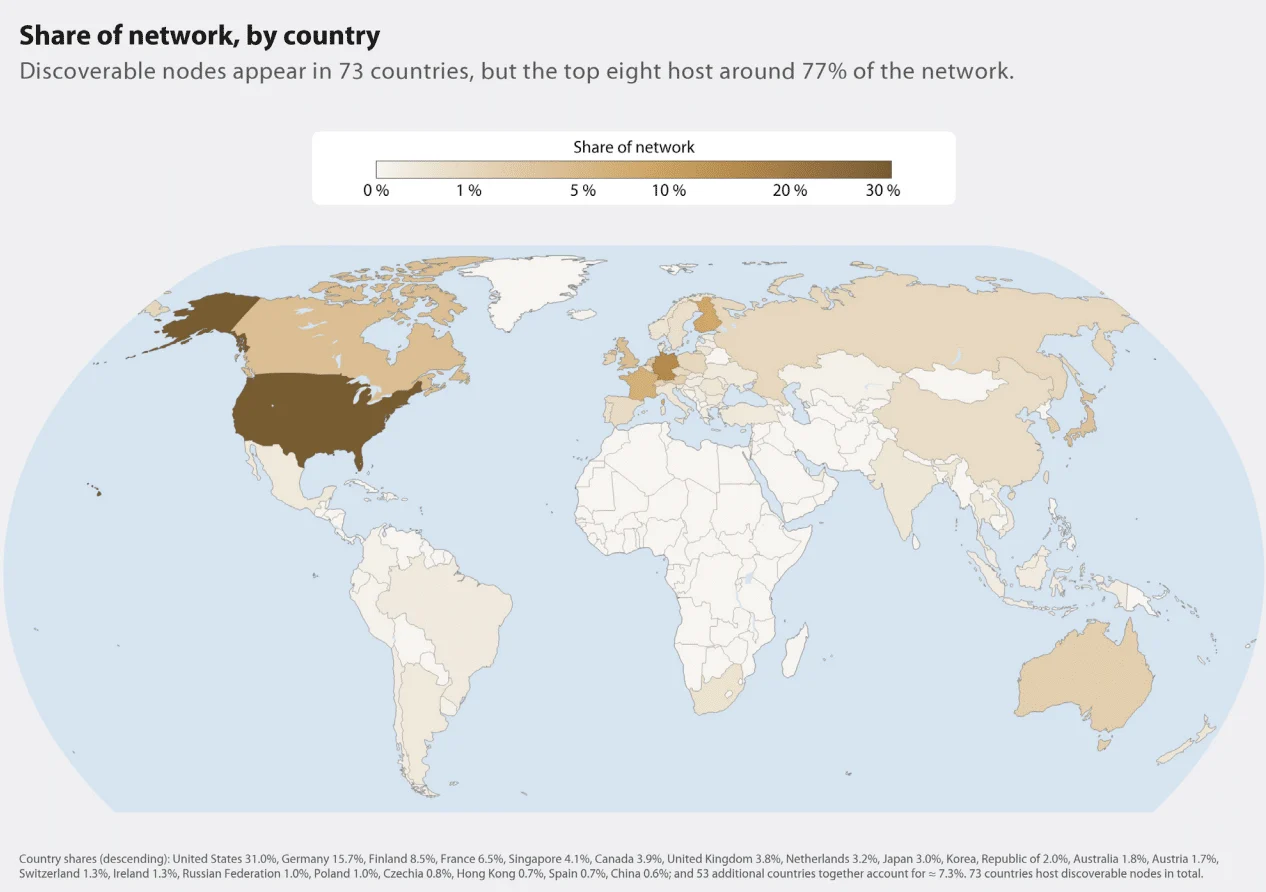
Additionally, the Cambridge Centre for Alternative Finance (CCAF) report highlighted that Ethereum’s infrastructure is decentralized despite being geographically concentrated. Of all nodes, roughly 62% are hosted by the United States (31%), Germany (16%), Finland (8%), and France (6%).
Source: CCAF Report
Another significant discovery is that 56.4% of the electricity used to power Ethereum originates from sustainable sources, such as 17% nuclear energy and 39.4% renewable energy.
Given the electricity mix of the main host nations, natural gas continues to be the largest fossil fuel source at 27.7%. The fact that Ethereum’s sustainable energy share is higher overall than the global average of about 43% shows how much the network depends on cleaner electrical grids.
What does Ethereum’s carbon footprint mean for the network?
At the same time, Ethereum’s carbon footprint has dramatically decreased in tandem with its dramatic decrease in electricity consumption. As per the report, the network has reduced its emissions by 99.98% from its final Proof-of-Work era to an estimated 2.37 kilotonnes of CO₂ equivalent (ktCO₂e) per year.
Source: CCAF Report
To put this into perspective, Ethereum’s yearly emissions are equivalent to the carbon footprint of roughly 900 households in the UK.
Interestingly, future developments, like stateless verification, may further minimize the need for energy and hardware, reducing Ethereum’s carbon footprint while maintaining its decentralization and security.
What’s ahead?
This further coincided with Ethereum’s development that has entered a new phase as researchers unveiled “Lean Ethereum,” a multi-year overhaul aimed at the network’s long-term evolution. The plan intends to replace the Ethereum protocol’s cores over a period of roughly three to four years, as opposed to a single upgrade.
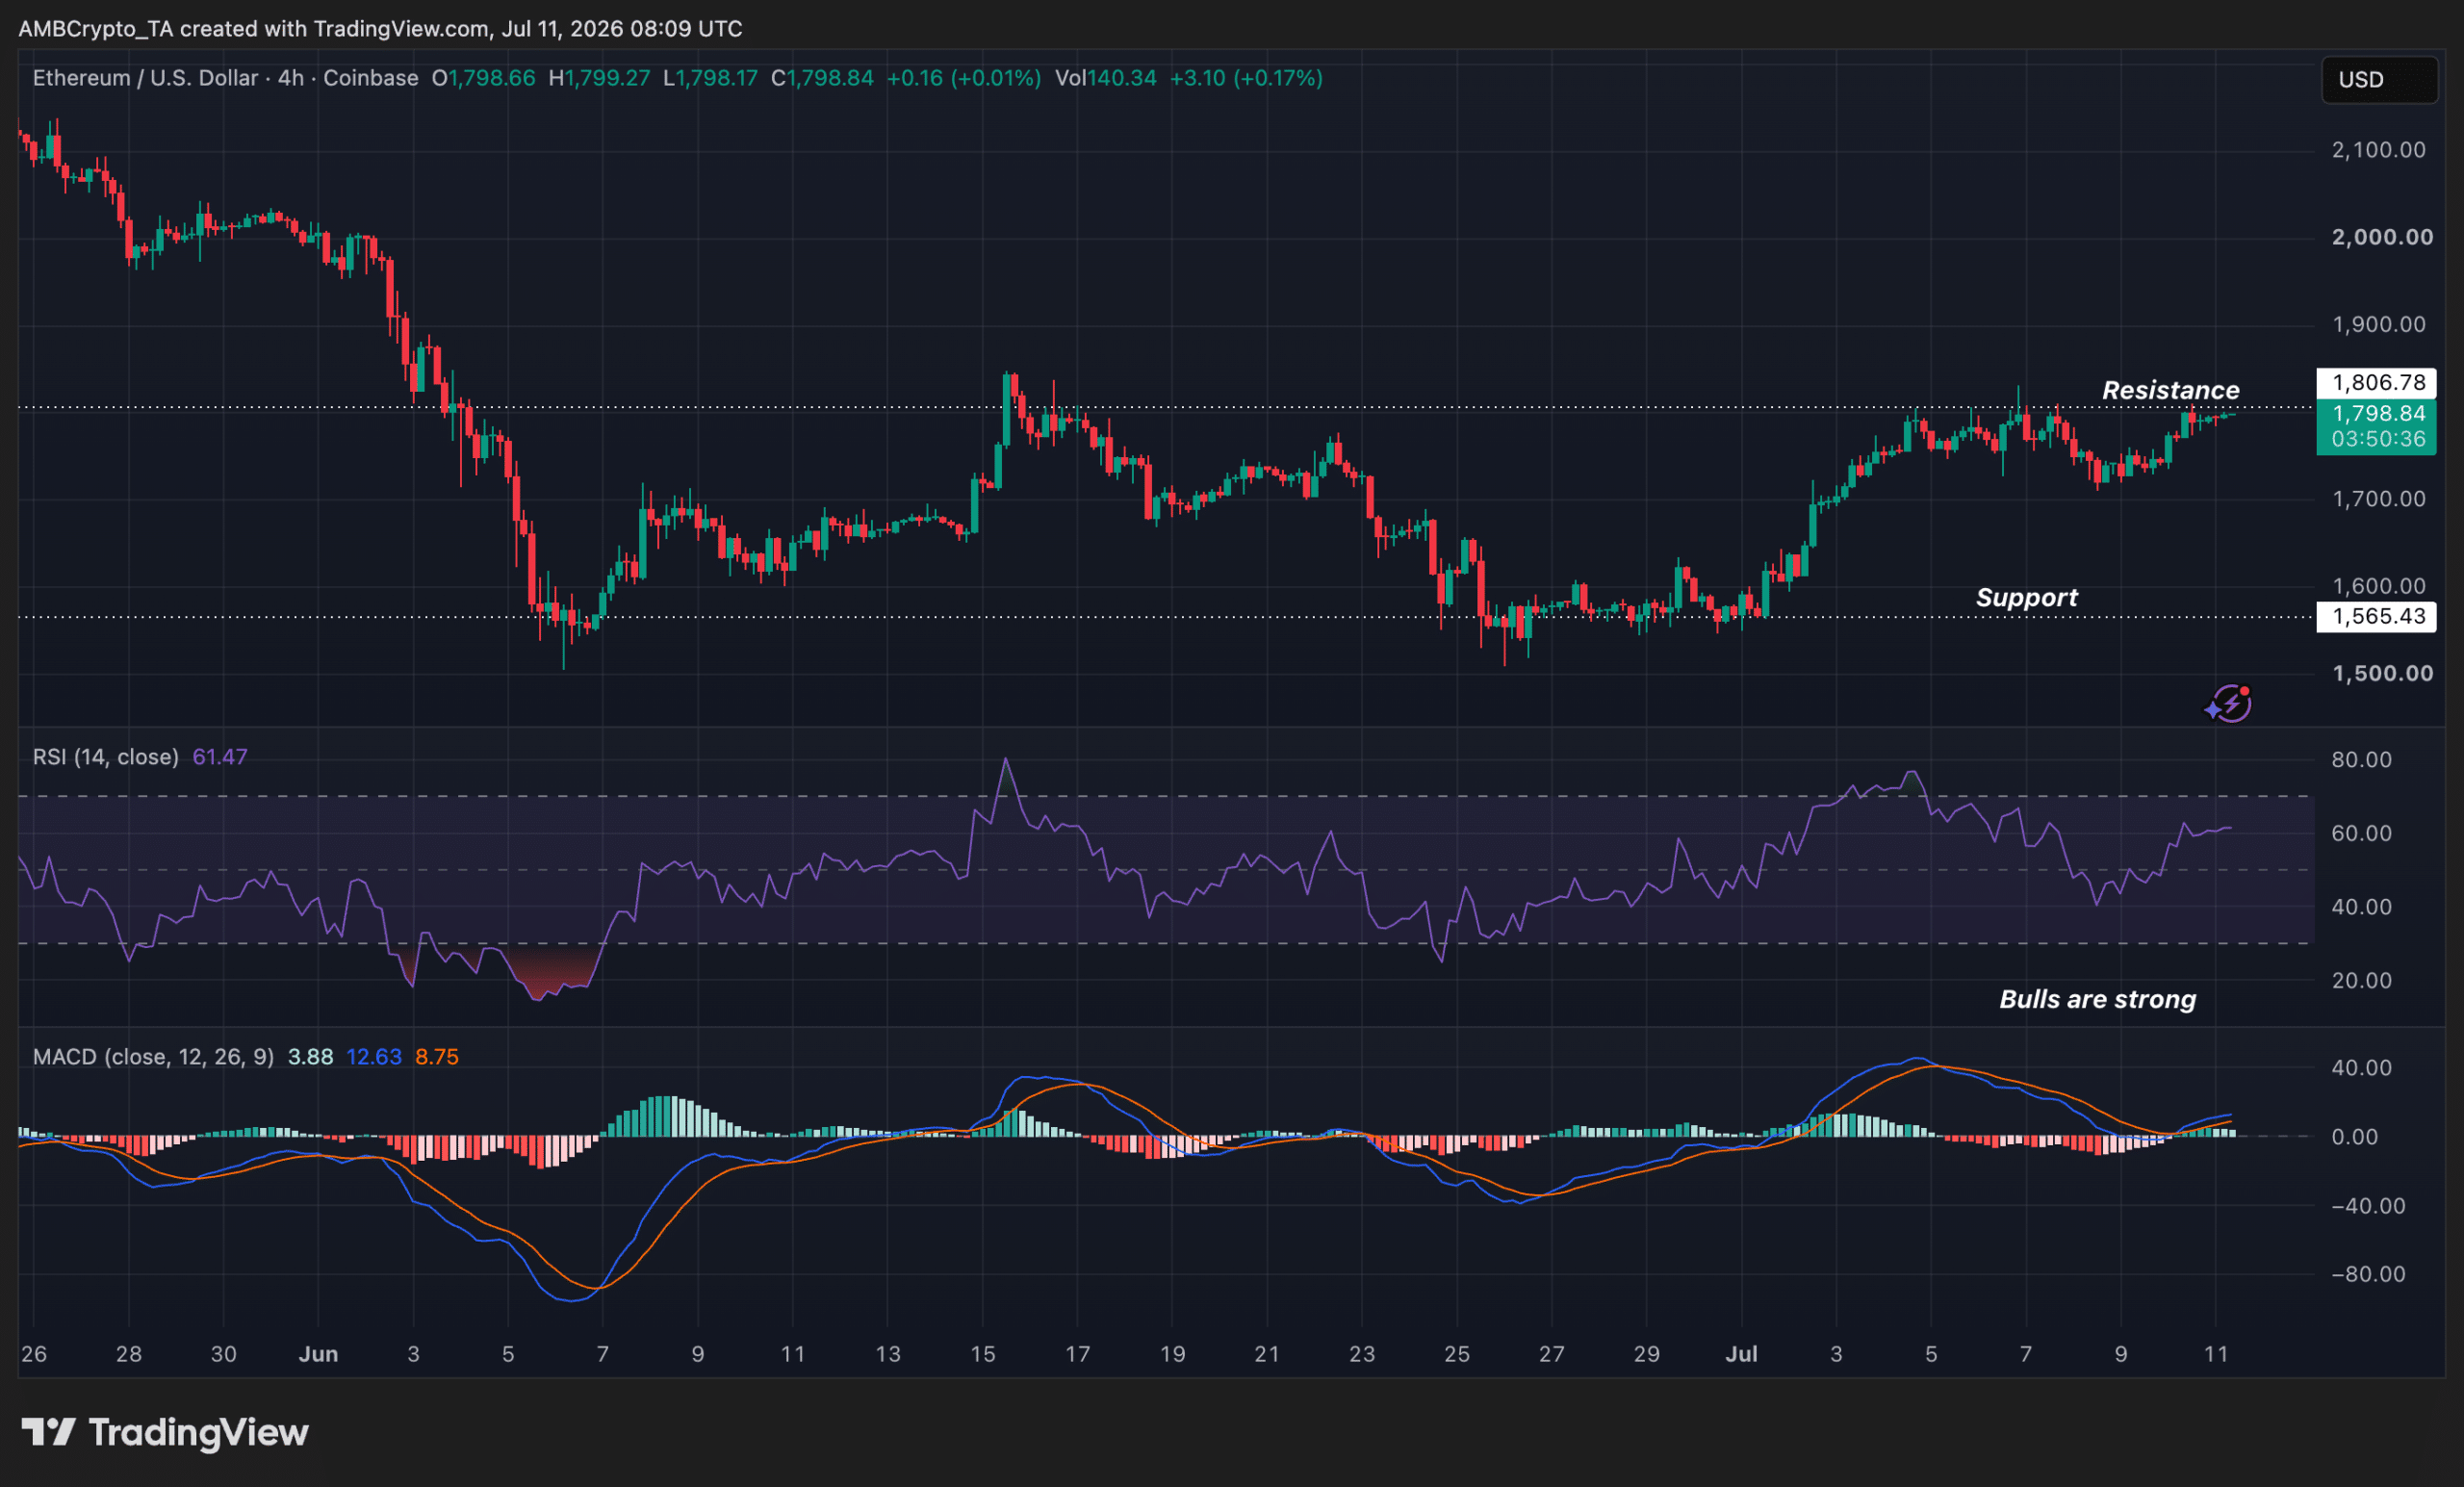
While these developments were happening, Ethereum’s price surged by 1.42% in the previous day and was now trading at $1,798.71 at press time. The MACD and RSI indicators also showed that bulls are more aggressive than they were previously. However, ETH needs to surpass the $1.8k mark in order for the bulls to continue.
Source: Trading View
Final Summary
Ethereum roughly has 62% of all nodes hosted by the United States, followed by Germany, Finland, and France.
The network has reduced its emissions to an estimated 2.37 kilotonnes of CO₂ equivalent (ktCO₂e) per year.