Consumers frequently claim that the American shopping mall is dying. Yet a 44-year-old nostalgic mall retailer recently proved that structural changes, including aggressive store optimization, are actually saving it.
As part of my recent retail tracking coverage for TheStreet, I’ve documented how several major mall staples are executing similar strategies to protect their profit margins:
These localized closures don’t signal a retail apocalypse, but rather an uneven landscape heavily dependent on mall layout and tier rankings.
In fact, according to the June 2026 Placer.ai Mall Index, foot traffic actually rose 5.7% year-over-year at open-air shopping centers and 1.9% at indoor malls. A report by Cushman & Wakefield citing Green Street data further underscores this divide, showing that top-tier malls maintain a healthy 95% occupancy rate, while lower C-rated properties languish at just 72%.
Ultimately, modern consumers are shifting toward shorter, mission-driven visits under 30 minutes, causing focused spending across fewer stores per visit.
Now, an iconic staple of youth culture and fashion has trimmed stores from its footprint, aiming to boost sales at its remaining locations.
Tilly’s closed 28 stores over the past two years
Mall staple Tilly’s is known for its cool, youthful vibe. The retailer’s vast offering for teens and young adults ranges from graphic tees to Vans sneakers to Santa Cruz skateboards and gear, embodying the unique skater culture that ruled ’90s and 2000s fashion.
Tilly’s recently reported its first quarter of fiscal 2026 results. Total net sales were $124.7 million, up 15.9% compared to the same period in 2025.
Tilly’s Q1 fiscal 2026 earnings highlights:
Net sales from physical stores were $96.3 million, an increase of 12.1%.
Net sales from e-commerce were $28.4 million, an increase of 30.9%. E-com net sales represented 22.8% of total net sales this year, compared to 20.2% of total net sales last year.
Gross profit was $36.1 million, or 28.9% of net sales, compared to $21.3 million, or 19.8% of net sales, last year.
Net loss improved to $8.0 million, or $(0.26) per share, compared to a net loss of $22.2 million, or $(0.74) net loss per share, last year. Source: Tilly’s Q1 Fiscal 2026 Earnings Document on SEC.gov
In the report, the company confirmed it has closed a total of 18 stores, cutting its traditional mall footprint by more than 7.6% in 12 months.
After analyzing Tilly’s previous reports, I discovered that Tilly’s has closed 28 stores in two years, reducing its footprint by 11%. Based on its latest earnings report, the brand has 220 operational stores remaining, down from the 248 it had at the end of the first quarter of fiscal 2024.
Tilly’s has closed more than two dozen stores over the past two years.Wolterk / Getty Images
Why has Tilly’s been closing stores?
Analyzing Tilly’s latest earnings report, it becomes clear that the company’s performance improved after its quiet downsizing.
Net sales from physical stores grew 12.1% year over year, even though the company operated 18 fewer stores than in the comparable quarter.
“Net sales from physical stores represented 77.2% of total net sales this year compared to 79.8% of total net sales last year,” the report added.
Tilly’s management explained that margins also improved because of improved full-price selling and lower buying, distribution, and occupancy costs “due to decreased occupancy costs associated with reduced store count.
“Fiscal 2025 was a year of significant store optimization, resulting in 21 total store closures,” Tilly’s CEO Nate Smith said during Tilly’s fourth quarter and full year 2025 earnings conference call, as reported by MarketBeat. “We are proud of the fact that we were able to deliver sales growth in the fourth quarter with 17 fewer net stores.”
Smith emphasized that downsizing was a difficult but necessary decision to get back to historical sales levels.
“It requires discipline, focus, and a willingness to make difficult decisions day after day,” the CEO said, adding that “returning to historical levels of store sales, productivity, and the operating performance this business is capable of is the goal we’re driving toward, and we know there is meaningful work still ahead of us to get to that point.”
“There have certainly been some high-profile failures this year, but a lot of space that’s come on the market has been quickly released,” according to Neil Saunders, a retail analyst and managing director of analytics firm GlobalData.
“Vacancy rates remain relatively low. In general, there is too much headline grabbing [a]round store closures. People like to make a thing about physical retail is dead or dying, which is completely untrue.”
Tilly’s is powerhouse behind fashion brands RSQ, West of Melrose
Tilly’s was founded back in 1982 by former Israel Navy officer Hezy Shaked and his wife Tilly Levine. The couple divorced in 1989, but Levine continued to work for the company as director of vendor relations.
Originally known as World of Jeans and Tops, over the years the retailer grew to a national scale. The company went public in May 2012, raising $124 million through its initial public offering of stock.
The Irvine, California-headquartered retailer sells branded apparel, accessories, shoes, and more, including some company-owned brands.
Tilly’s-owned brand names:
RSQ
Full Tilt
West of Melrose
Tilly’s
Additionally, Tilly’s features about 200 different brands, from Asics and Nike to Levis and Von Dutch. You can track its full list of brands here.
What’s next for Tilly’s
It’s evident from the earnings results and the company management’s comments that Tilly’s is not backing down; rather, it is optimizing its operations to improve margins.
Downsizing appears to be working for Tilly’s, which plans not only to close more stores but also to open new ones.
During the first quarter, Tilly’s opened one store and closed four. For the rest of the year, it plans to “open 2 new stores in late July, and 1 more in late October, and to close 1 existing store in mid July and another at the end of the fiscal year,” Smith said.
The CEO added that management is optimistic about the possibility of expanding its net store footprint.
These moves align with the recent mall data, suggesting that top-tier malls are seeing more foot traffic, pushing many brands to close underperforming stores in malls that don’t see enough traffic.
Based on Tilly’s Form 10-K filing with the SEC, the company’s store count spread across Regional Malls, off-mall locations, and outlets as of Jan. 31, 2026, was:
Regional mall: 128
Off-mall: 79
Outlet: 16
“Visits to indoor malls, open-air shopping centers, and outlet malls all remained in positive YoY territory in June 2026, with indoor mall visits up 1.2%, open-air shopping center visits up 5.1%, and outlet mall visits up 1.0% compared to June 2025,” according to Placer.ai.
Additionally, the company plans to invest and launch an “AI-driven merchandise allocation tool before the holiday season to help us improve initial allocation accuracy across our stores and online.”
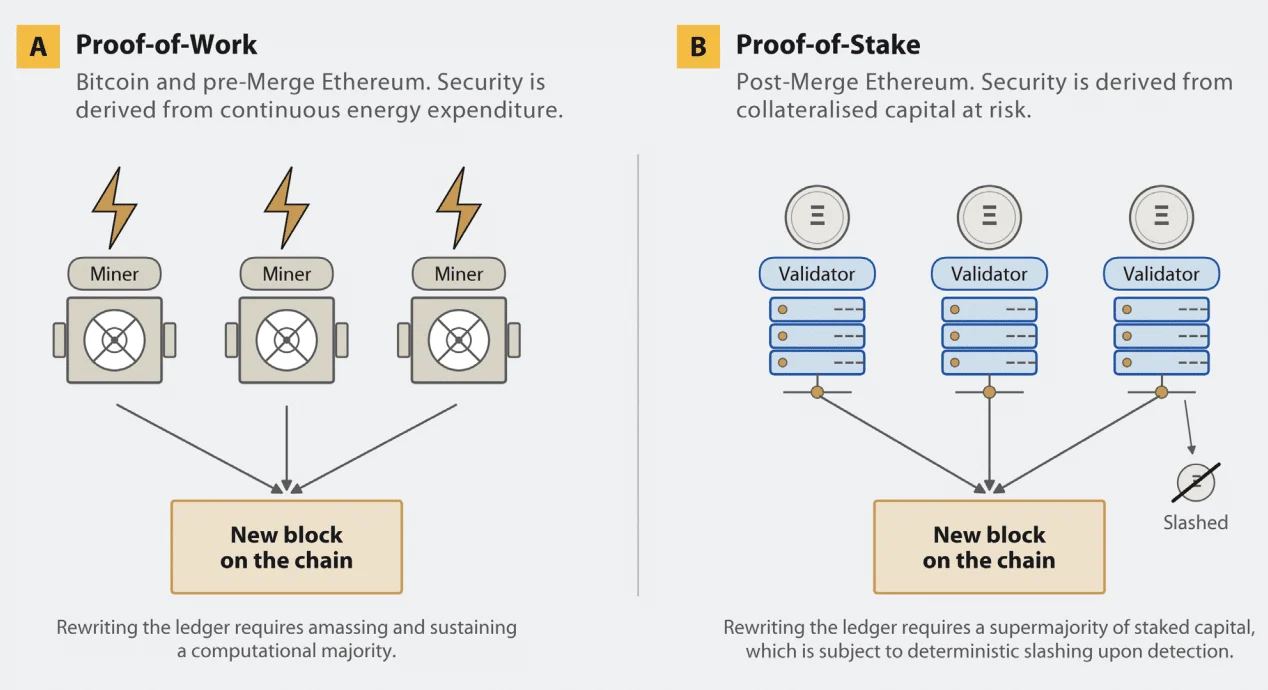
Ethereum has undergone significant change over time, particularly since The Merge.The upgrade replaced the energy-intensive Proof-of-Work (PoW) system with Proof-of-Stake (PoS).
With this change, Ethereum currently uses about 8,522 physical nodes, many of which house multiple validators, and nearly 894,000 validators.
Source: CCAF Report
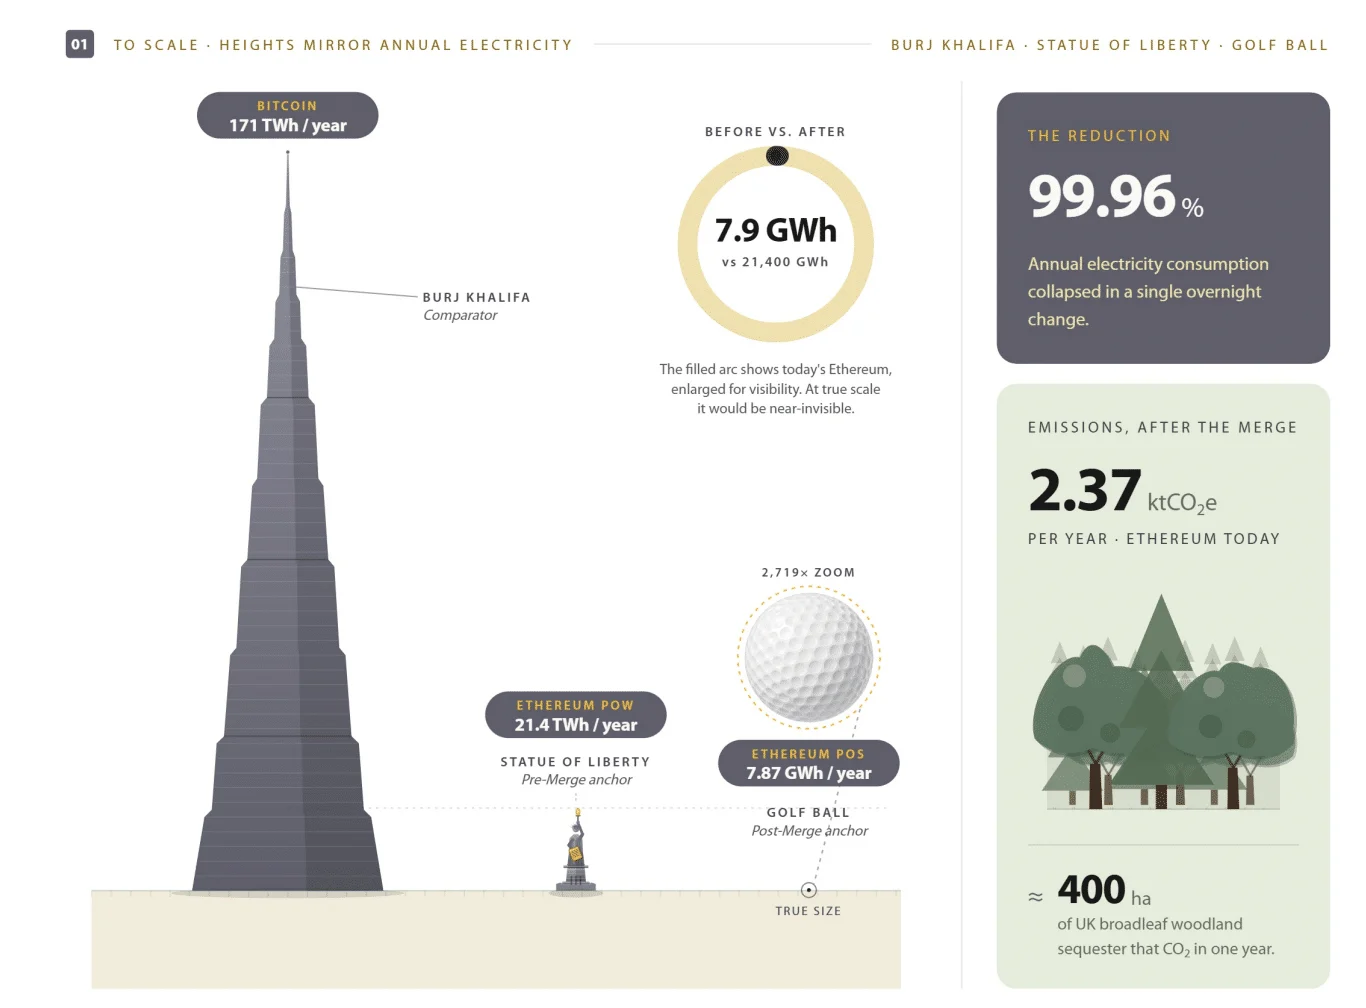
As a result, Ethereum now consumes only 7.87 GWh of electricity annually, or about 0.90 MW of continuous power. That is less than half the British Museum’s annual electricity consumption.
Before The Merge, the network required roughly 2.4 GW of continuous power.
Since then, Ethereum’s electricity consumption has fallen by more than 99.9%, marking one of the largest energy reductions by a major blockchain.
Is Ethereum truly decentralized?
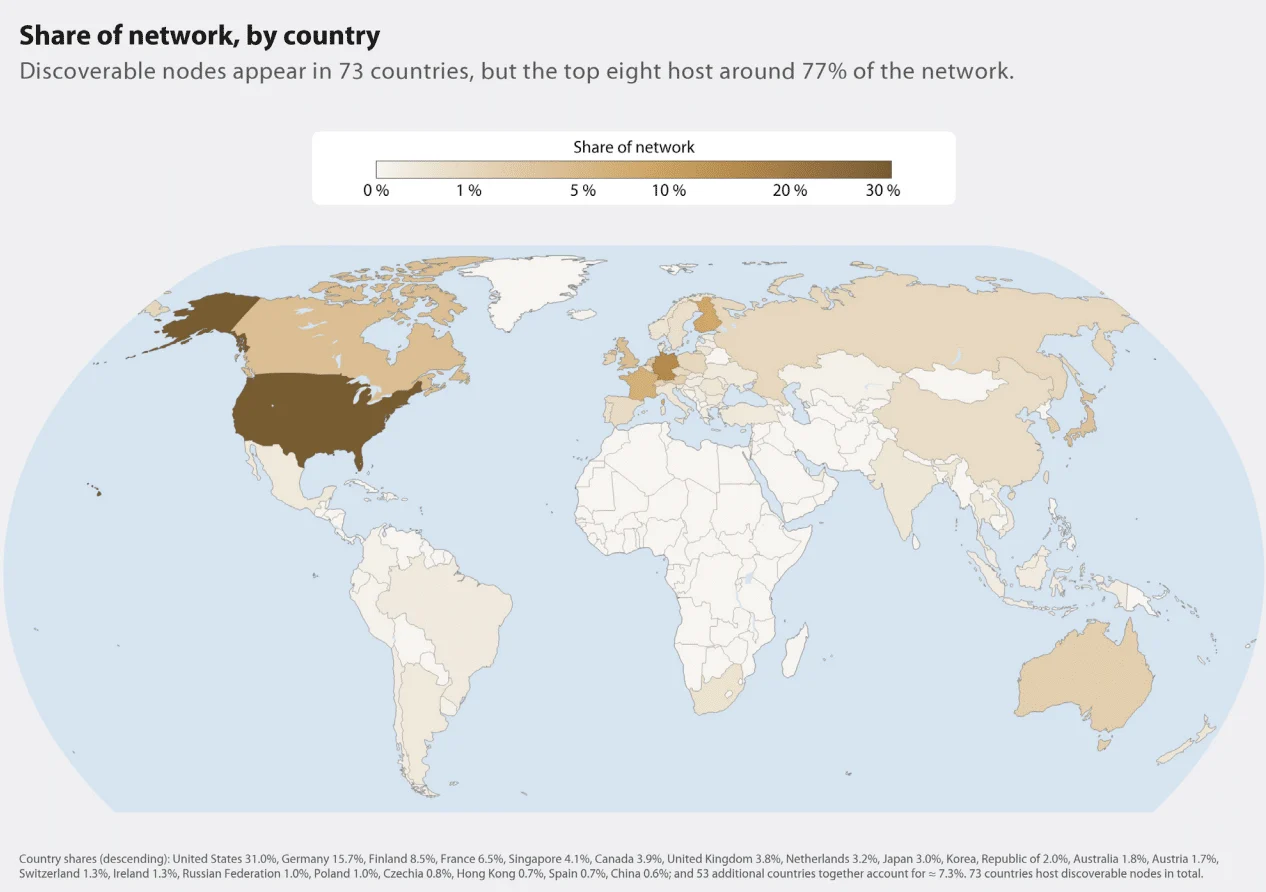
Additionally, the Cambridge Centre for Alternative Finance (CCAF) report highlighted that Ethereum’s infrastructure is decentralized despite being geographically concentrated. Of all nodes, roughly 62% are hosted by the United States (31%), Germany (16%), Finland (8%), and France (6%).
Source: CCAF Report
Another significant discovery is that 56.4% of the electricity used to power Ethereum originates from sustainable sources, such as 17% nuclear energy and 39.4% renewable energy.
Given the electricity mix of the main host nations, natural gas continues to be the largest fossil fuel source at 27.7%. The fact that Ethereum’s sustainable energy share is higher overall than the global average of about 43% shows how much the network depends on cleaner electrical grids.
What does Ethereum’s carbon footprint mean for the network?
At the same time, Ethereum’s carbon footprint has dramatically decreased in tandem with its dramatic decrease in electricity consumption. As per the report, the network has reduced its emissions by 99.98% from its final Proof-of-Work era to an estimated 2.37 kilotonnes of CO₂ equivalent (ktCO₂e) per year.
Source: CCAF Report
To put this into perspective, Ethereum’s yearly emissions are equivalent to the carbon footprint of roughly 900 households in the UK.
Interestingly, future developments, like stateless verification, may further minimize the need for energy and hardware, reducing Ethereum’s carbon footprint while maintaining its decentralization and security.
What’s ahead?
This further coincided with Ethereum’s development that has entered a new phase as researchers unveiled “Lean Ethereum,” a multi-year overhaul aimed at the network’s long-term evolution. The plan intends to replace the Ethereum protocol’s cores over a period of roughly three to four years, as opposed to a single upgrade.
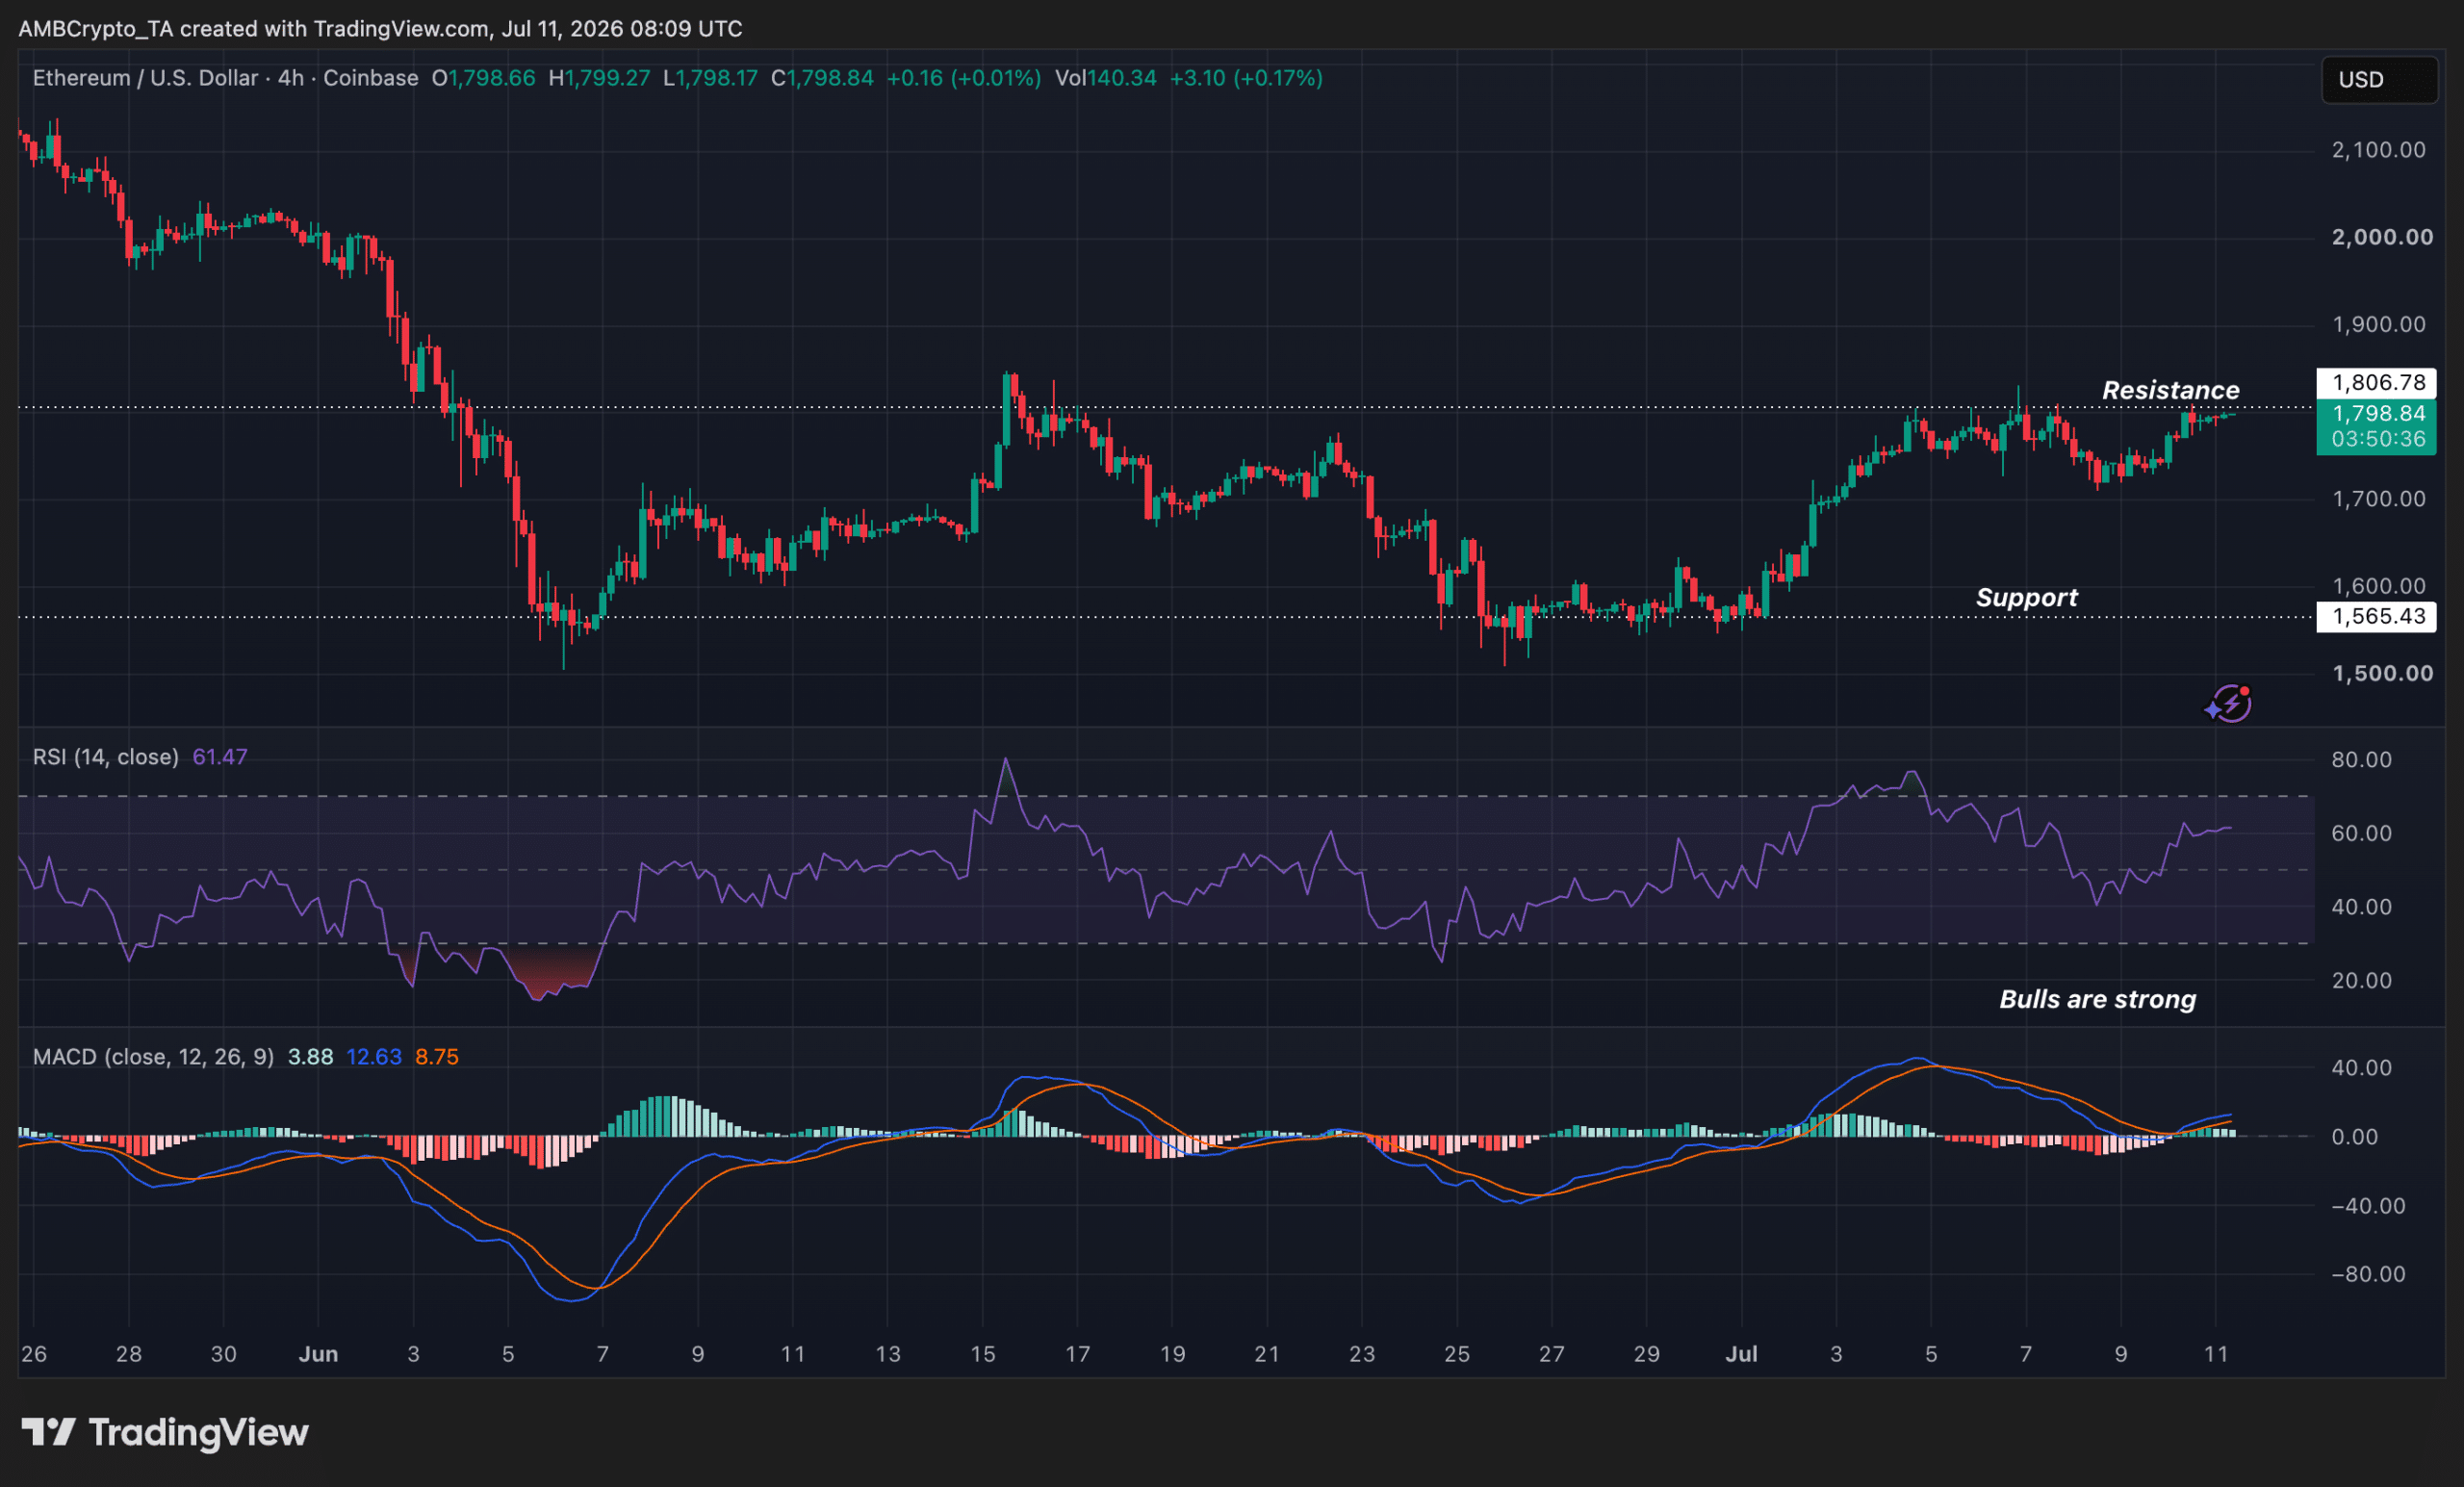
While these developments were happening, Ethereum’s price surged by 1.42% in the previous day and was now trading at $1,798.71 at press time. The MACD and RSI indicators also showed that bulls are more aggressive than they were previously. However, ETH needs to surpass the $1.8k mark in order for the bulls to continue.
Source: Trading View
Final Summary
Ethereum roughly has 62% of all nodes hosted by the United States, followed by Germany, Finland, and France.
The network has reduced its emissions to an estimated 2.37 kilotonnes of CO₂ equivalent (ktCO₂e) per year.
Then-Prime Minister Rishi Sunak announced the UK’s ambitions to be a “global cryptoasset hub” all the way back in 2022. Since then, that goal has seemed more like a distant aspiration rather than actuality. But several recent announcements suggest the gap between fantasy and reality might finally be narrowing.
Within days of each other, the Financial Conduct Authority (FCA) and Bank of England have taken major regulatory steps toward proving that the UK is serious about that goal, setting out rules designed to create a workable climate for both consumer and institutional crypto adoption.
The FCA finalized their crypto rules last month, offering guidance for crypto firms’ capital requirements, admissions and disclosures, and the wider conduct framework. Separately, the Bank of England has scrapped the previously proposed limits imposed on holdings of fiat-pegged stablecoins, as well as lowering the reserve requirement issuers must hold at the central bank from 40% to 30%.
Together, they are the clearest signal yet that the UK intends to build a leading crypto regime rather than simply talking about it.
Chet Shah is the CEO of Wirex Limited, a FCA-regulated fintech firm based in London.
A reputation earned the hard way
It’s no secret that the UK’s crypto industry has lagged behind on the global stage for the past few years. The Bank of England’s earlier stablecoin proposals, set out in November 2025, faced strong industry backlash for being too restrictive to support growth. Those plans included restricting individuals to holding no more than £20,000 of systemic sterling stablecoins, while businesses were capped at £10 million. Many argued that this was too conservative to allow stablecoins to be utilized at scale, and would fundamentally hold back the UK’s competitiveness.
As soon as Bitcoin (CRYPTO: BTC) dipped below the $60,000 price level in June, alarm bells went off. Bitcoin hasn’t been this low since October 2024. It’s now down nearly 50% since hitting an all-time high of $126,000 in October 2025.
If history is any guide, though, Bitcoin may have already bottomed out. It’s certainly a risky move, but buying Bitcoin now may turn out to be one of the smartest investments you make this year. Here’s why.
Missed Nvidia in 2009? This Rare Signal Is Flashing Again. In 2009, a “Double Down” signal flashed for a little-known chipmaker called Nvidia. For the first time in years, that same “Total Conviction” signal is flashing for a company 1/100th the size of Nvidia. Continue »
Bitcoin’s famous four-year cycle
Let’s start with the obvious: Bitcoin is highly cyclical, trading in four-year cycles of boom and bust. The timing is not Swiss-clock accurate, but Bitcoin typically has three very good years before having one very bad year.
Just look at the historical data. Bitcoin had good years in 2019, 2020, and 2021 before collapsing entirely in 2022. Bitcoin had good years in 2015, 2016, and 2017, before collapsing entirely in 2018. The same pattern played out from 2011 to 2014.
Image source: Getty Images.
That’s why the current period of significant price decline doesn’t worry me as much as it does other crypto investors. In simple terms, Bitcoin was “due” for a year-long collapse, and now we’re seeing it play out in real time.
That’s the bad news. The good news is that market sentiment can turn on a dime when it comes to Bitcoin. Just think back to the doom and gloom of 2022, during the so-called crypto winter. Everyone, it seemed, was convinced that Bitcoin was going to zero. The crypto bears were out in force, trying to convince everyone that Bitcoin was worthless.
But Bitcoin delivered triple-digit returns in 2023 and 2024, before soaring to a new all-time high of $126,000 in 2025. At that point, plenty of hyper-bullish crypto investors started to claim that the Bitcoin four-year cycle was a relic of the past. They were convinced that it was “up only” from here on out. But long-term Bitcoin investors knew better.
Get ready for a near-term Bitcoin recovery
Still not convinced? Consider that a number of high-profile analysts, including Cathie Wood of Ark Invest, are already starting to call a “bottom” on Bitcoin. Some are going one step further and setting out bullish price targets for 2026.
Standard Chartered, for example, is now convinced that Bitcoin will hit $100,000 by year-end. Investment firm Bernstein thinks Bitcoin could hit $150,000. Tom Lee of Fundstrat thinks Bitcoin might hit $250,000.
OK, you can ignore that last price target. It’s truly outlandish. But I’m on the side of crypto analysts predicting a strong year-end rally for Bitcoin. The historical data is just too convincing to ignore.
Should you buy stock in Bitcoin right now?
Before you buy stock in Bitcoin, consider this:
The Motley Fool Stock Advisor analyst team just identified what they believe are the 10 best stocks for investors to buy now… and Bitcoin wasn’t one of them. The 10 stocks that made the cut are built for long-term growth and could produce monster returns in the coming years.
Consider when Netflix made this list on December 17, 2004… if you invested $1,000 at the time of our recommendation, you’d have $395,679!* Or when Nvidia made this list on April 15, 2005… if you invested $1,000 at the time of our recommendation, you’d have $1,294,805!*
That performance is why people listen. With a track record of beating the S&P 500 by 4x, Stock Advisor offers a distinct advantage. Don’t miss the latest top 10 list, available with Stock Advisor, and join an investing community built for the long haul.
Dominic Basulto has positions in Bitcoin. The Motley Fool has positions in and recommends Bitcoin. The Motley Fool recommends Standard Chartered Plc. The Motley Fool has a disclosure policy.
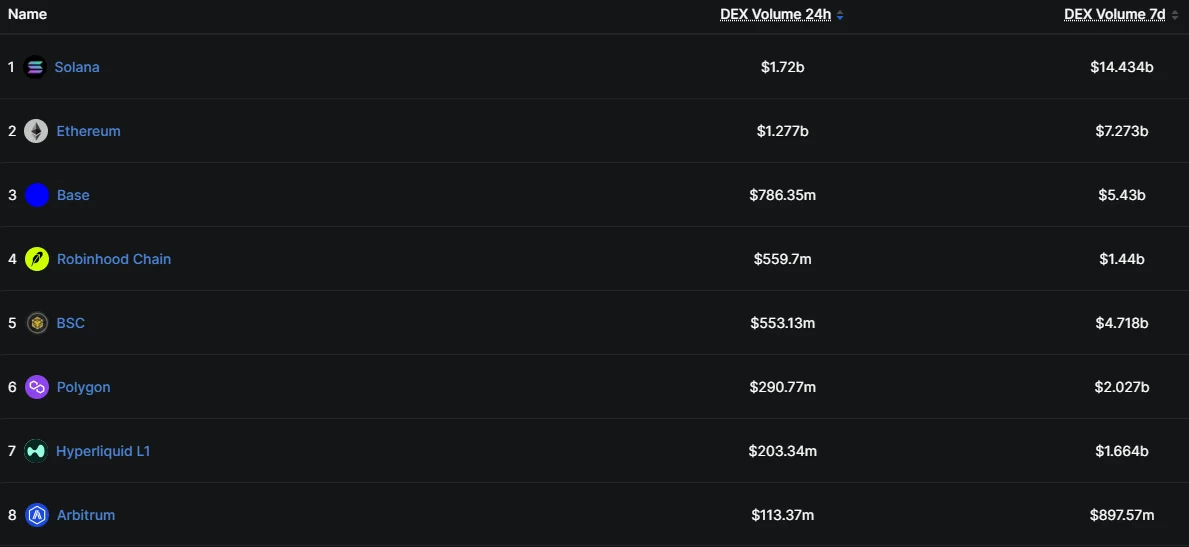
The new Ethereum Layer 2 (L2) Robinhood Chain has surpassed Hyperliquid and BNB Chain in speculative interest.
A week ago, Robinhood’s DEX volume (which tracks trading volume and broader speculative interest) was less than $10M.
As of writing, the daily DEX volume has hit a record level of $600M, making it the fourth dominant chain in speculative activity.
In the past two days, it has effectively surpassed BNB Chain and Hyperliquid on this front thanks to Robinhood’s CEO’s memecoin bet.
Source: DeFiLlama
As Robinhood Chain-based memecoins like CashCat [CASHCAT] went viral and posted massive gains, the FOMO attracted users and capital inflows.
Robinhood’s memecoin frenzy sparks L2 debate
If the memecoin mania persists, it could surpass Base in DEX volume to become the third-largest place for speculative trading.
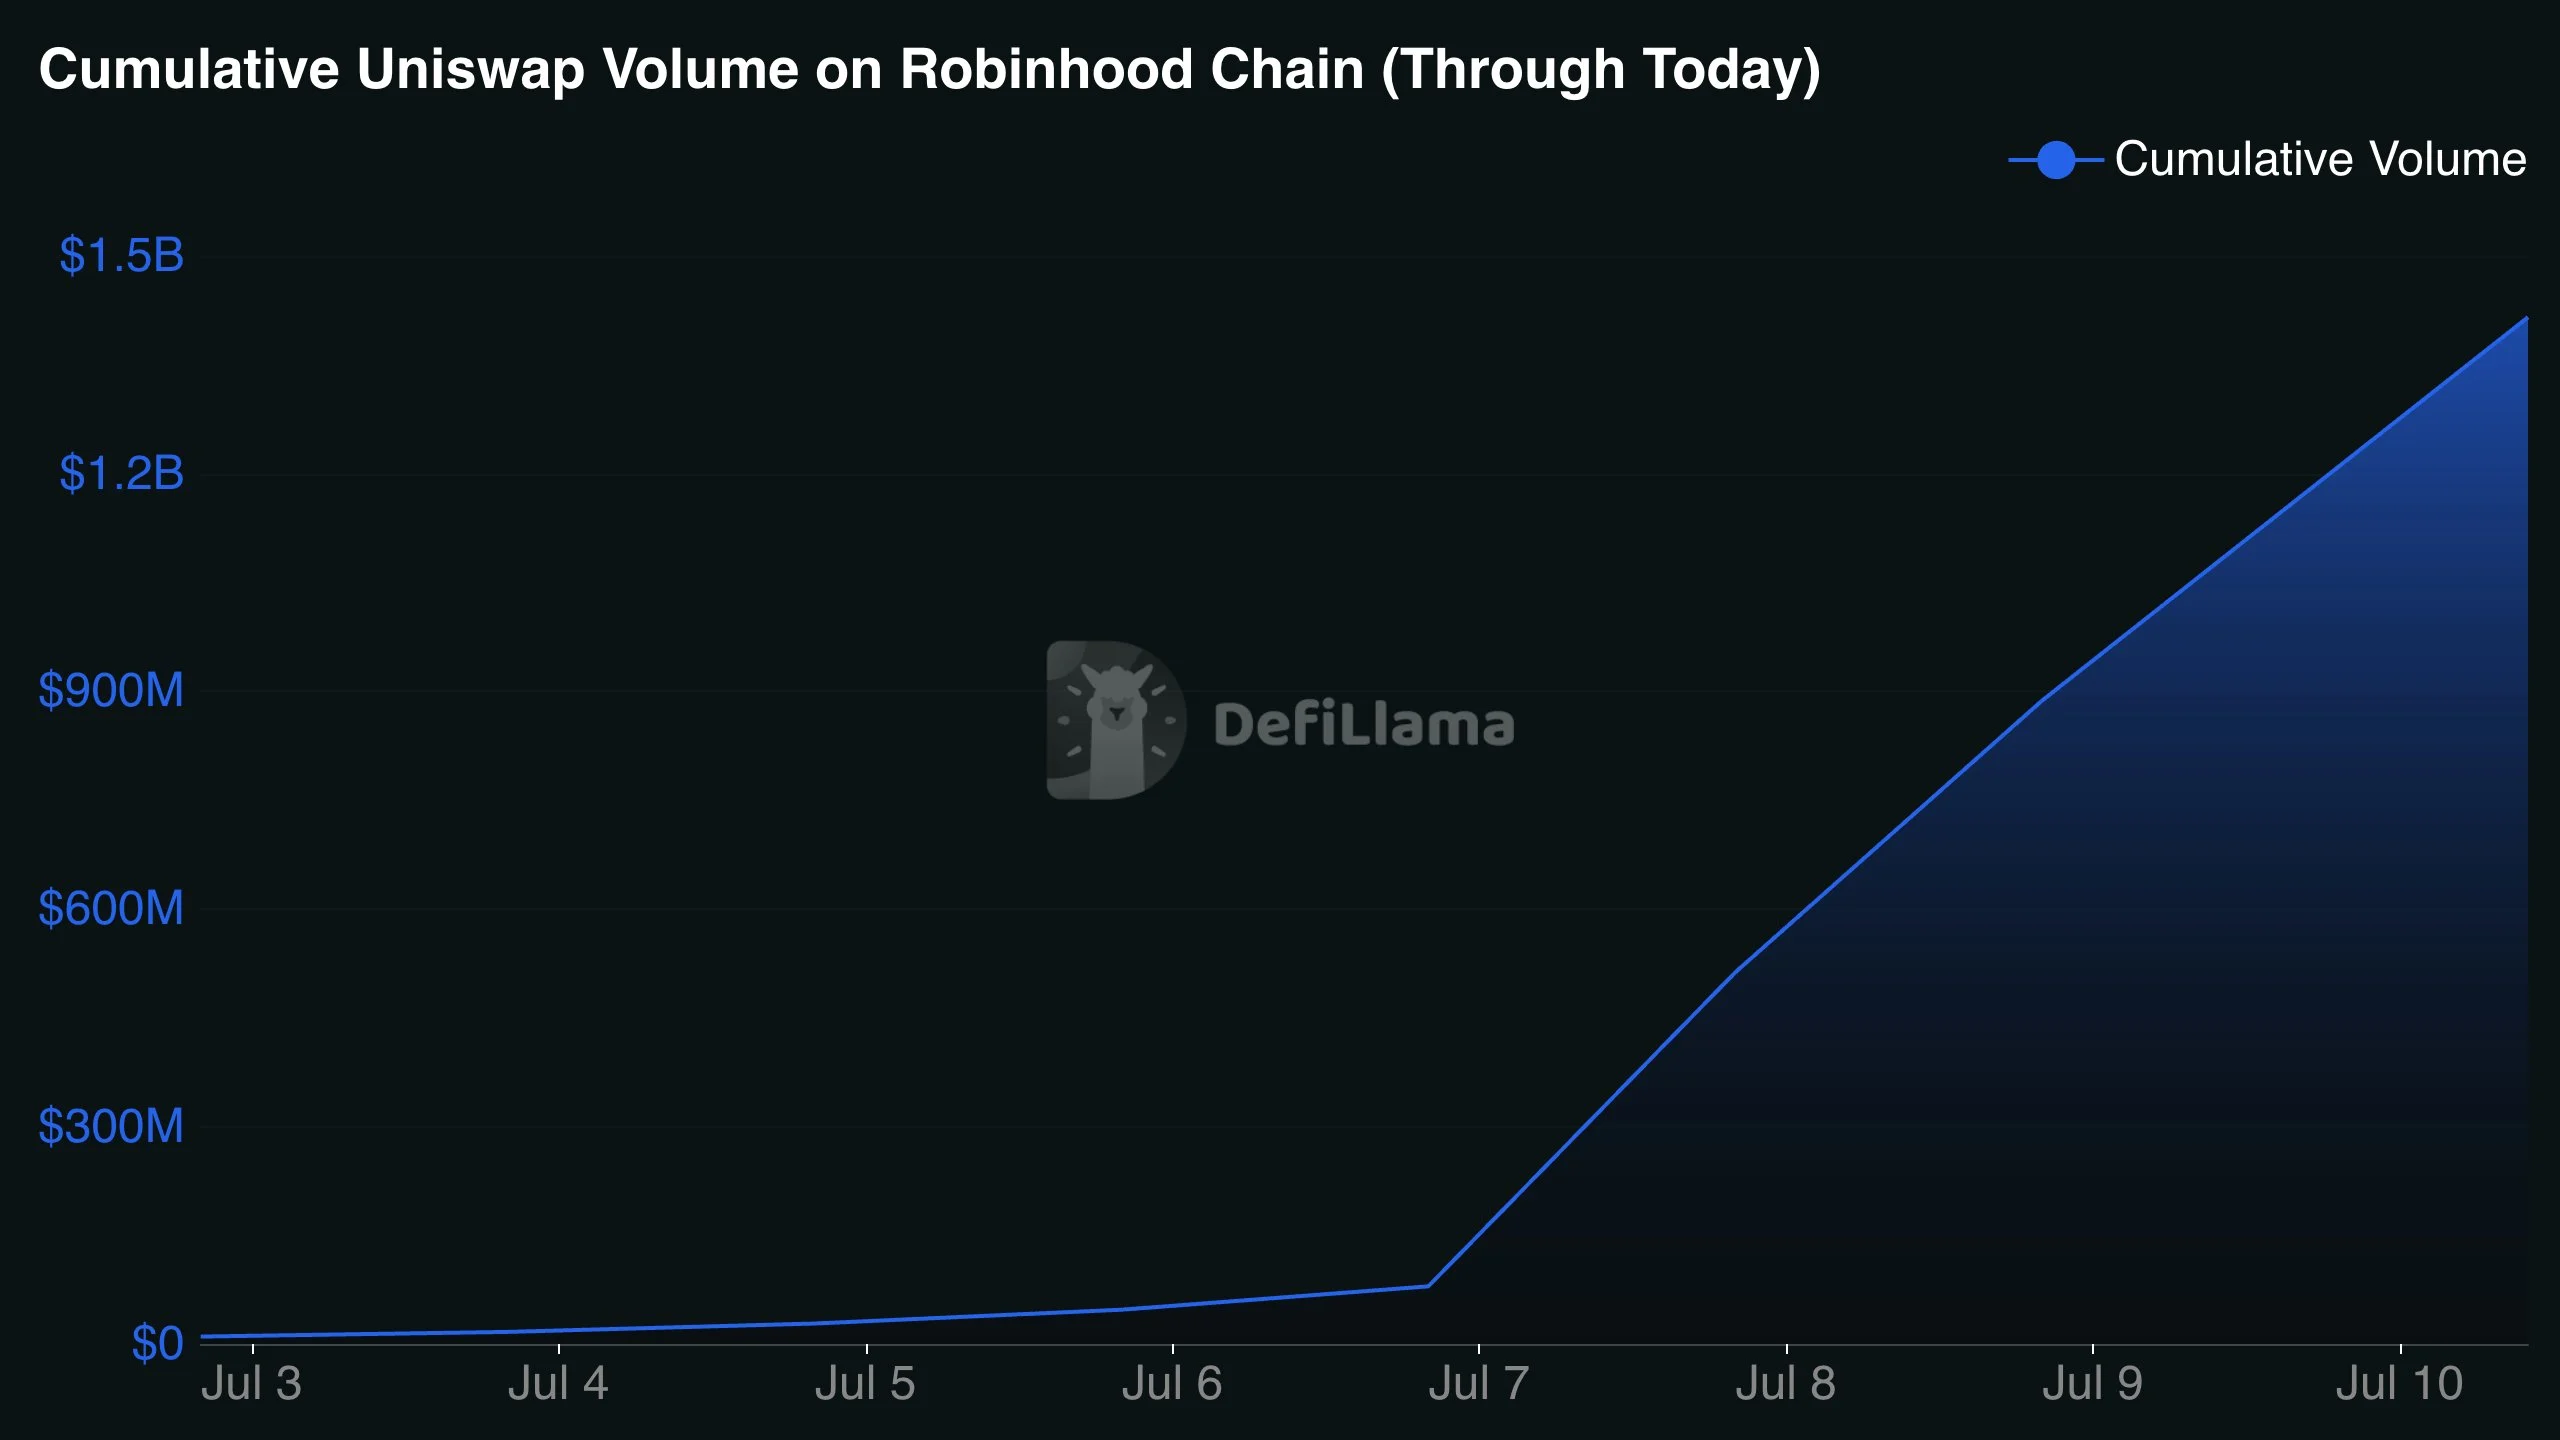
Worth pointing out that Uniswap crossed $1B in volume on Robinhood Chain since launch, further underscoring how crazy the memecoin mania is on the new L2.
Source: DeFiLlama
But critics have been opposing the memecoin push. Most questioned the need for another Ethereum Layer 2 (L2) if its use case is risky memecoin speculation. The debate has since evolved to whether L2 growth benefits ETH’s value.
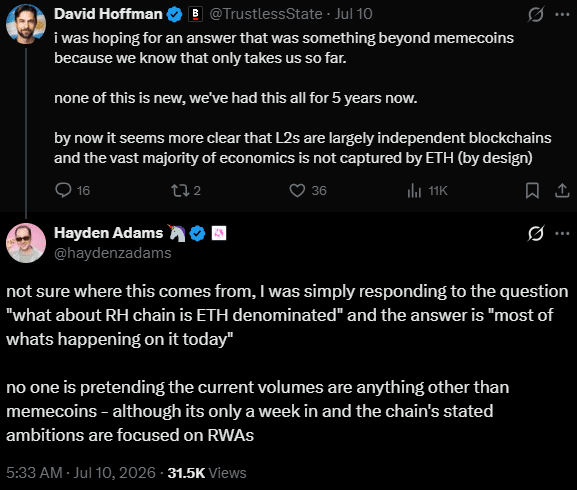
For Bankless’ David Hoffman, L2s aren’t helpful to ETH.
By now it seems more clear that L2s are largely independent blockchains and the vast majority of economics is not captured by ETH (by design).
Uniswap CEO Hayden Adam countered that most of the pairs on the chain are denominated in ETH and will eventually help burn more ETH, especially if the RWA narrative picks up momentum.
Source: X
Do Layer 2s actually help Ethereum?
The L2 roadmap has been under heavy criticism. With corporate chains such as Stripe’s Tempo, SWIFT, and more, the criticism has deepened.
For lawyer Gabriel Shapiro, the entire roadmap was ‘poorly executed’ to benefit ETH value.
The roadmap was just very poorly executed so that it’s mostly negative to ETH & leaves the L2s with too much optionality to become L1s, no real lock-in.
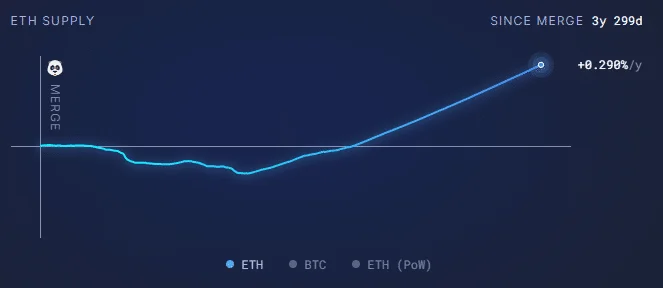
Ethereum’s best shot at scaling was through L2s, and recent upgrades have made them cheaper and attracted more traffic.
But this has also reduced the number of ETH burned, making the asset inflationary and denting its ‘store of value’ narrative.
Source: Ultrasoundmoney
Whether the renewed L2 debate will drag ETH’s market sentiment and price remains to be seen. As of writing, Ethereum [ETH] traded at $1.8K, a key inflection point that could trigger the next leg of price recovery or another pullback.
Final Summary
Robinhood L2 has become the fourth largest on-chain place for speculative trading, flipping BNB Chain and Hyperliquid
Amid the hype, Ethereum L2s are under scrutiny again for being non-beneficial to ETH’s value
This was quickly fixed and disclosed as ‘CVE-2026-34219′ with credit to the team. The broader concern, however, was separating the agents’ real bugs from the ones that were confidently masquerading as such.
“The surprise was how little of the work went into finding them, and how much went into telling the real bugs from the ones that just looked real,” wrote Nikos Baxevanis, who authored the post.
The difficulty started with what an agent produces. A fuzzer, the standard tool that hurls malformed data at software until something breaks, returned a crash and a record of where it happened, which an engineer can confirm in minutes.
An agent, however, returns a created narrative. It traces how the flaw could be reached, argues why it matters, proposes a severity rating and supplies working code that demonstrates the attack. All of it arrives in fluent prose, reading the same whether the bug is real or invented.
Three kinds of false positive kept recurring, according to the Foundation.
The first was a crash that only occurs in a test build, where the compiler switches on safety checks that the shipped software does not carry, so nothing breaks for real users.
The second was an attack that only works if the dangerous value is planted inside the program by hand, because every route an outsider could take to deliver it rejects the value first. The third came from formal verification, the practice of proving mathematically that code behaves correctly, where a proof passed by demonstrating something trivially true and told the reviewers nothing about the software.
AVGO generated $10.8 billion in AI silicon revenue, up 143% year over year, while MRVL converted 76% of its $2.4 billion quarter from data centers.
Broadcom’s 46% free cash flow margin funds buybacks and dividends; Marvell’s acquisition spree cut GAAP net income by 81% last quarter.
Act now: the analyst who called NVIDIA in 2010 just named his top 10 AI stocks — and Broadcom didn’t make the cut. Grab the names FREE today.
Broadcom (NASDAQ: AVGO) and Marvell Technology (NASDAQ: MRVL) both just delivered AI-fueled quarters, but the businesses behind the tickers look nothing alike.
Quality Stock Arts / Shutterstock.com
Broadcom is a $1.76 trillion platform pairing custom silicon with VMware software. Marvell is a focused data center specialist leaning into optics and interconnects. Both reported AI acceleration. Only one has scale to match the hype.
Custom XPUs Carry Broadcom. Optics Carry Marvell.
Broadcom’s Q2 FY2026 landed with $22.19 billion in revenue, up 47.87% year over year, with non-GAAP EPS of $2.44. The real story sits inside semiconductors.
AI silicon revenue reached $10.8 billion, growing 143%, driven by custom AI accelerators (XPUs) and Ethernet networking silicon sold to a small group of hyperscalers. CEO Hock Tan told investors “the momentum continues and in Q3 we expect semiconductor revenue from AI to grow over 200% year-over-year to $16.0 billion.” That is a bold call for one quarter.
Marvell’s Q1 FY2027 came in at $2.418 billion, up 27.57%, with the data center segment now 76% of revenue at $1.83 billion.
CEO Matt Murphy pointed to “exceptional AI-related bookings” across 800G and 1.6T scale-out optics, 51.2T Ethernet scale-out switches, scale-up optical solutions for NPO and CPO applications, scale-across datacenter interconnect modules, and custom XPU and XPU-attach solutions. Translation: Marvell wants to own the wiring between accelerators.
Act now: the analyst who called NVIDIA in 2010 just named his top 10 AI stocks — and Broadcom didn’t make the cut. Grab the names FREE today.
Scale vs. Specialization
Business Driver
Broadcom
Marvell
Main growth engine
Custom AI XPUs and Ethernet
800G/1.6T optics, DCI, XPU-attach
AI mix of revenue
$10.8B AI semis
$1.83B data center
Software leg
VMware, $7.18B
None
Next quarter guide
$29.4B, +84% YoY
$2.7B, ~35% YoY
Broadcom’s 46% free cash flow margin and 69% adjusted EBITDA margin let it fund a growing dividend and a $10 billion buyback authorization.
Marvell is spending differently: it closed acquisitions of Celestial AI and XConn Technologies in February 2026, and raised $2 billion in convertible preferred. The tradeoff showed up in GAAP net income, which fell 80.61% on a $331.8 million contingent consideration charge. Growth by M&A is not free.
What I’m Watching Next
Broadcom needs to actually hit that $16 billion AI number in Q3. Since the June 3 report, AVGO has fallen 22.5% to $370.78, suggesting investors are pricing in real execution risk.
Marvell, by contrast, is up 16.1% since its May 27 earnings report, helped by S&P 500 inclusion. I want to see whether Murphy can convert 800G optics bookings into sustained gross margin inside the guided 58.25% to 59.25% range.
Why I Lean Broadcom for Quality, Marvell for Torque
If you want durable AI exposure with a software cushion and a real dividend, Broadcom is the cleaner story to me. The cash flow is enormous, and analyst targets sit at $523.73 versus today’s price, with 44 buy ratings. I stay skeptical of the 200%+ AI guide until we see it.
If you want higher variance and can stomach dilution, Marvell fits a turnaround-plus-growth profile better, especially with a P/E near 85 that only works if optics scale as promised. The two stocks suit different risk appetites rather than a combined position.
Act now: the analyst who called NVIDIA in 2010 just named his top 10 AI stocks — and Broadcom didn’t make the cut. Grab the names FREE today.