TotalEnergies SE (NYSE:TTE) is one of the Best Low Cost Stocks to Buy According to Hedge Funds. On May 28, TotalEnergies SE (NYSE:TTE) reported that the company has officially filed for authorization to build a 1.5 GW offshore wind farm off the coast of Normandy, France. This update comes eight months after the French State awarded the project to the company’s subsidiary, Centre Manche Énergies.
Management noted that the filing includes technical and environmental surveys, a preliminary design, and an installation program. Moreover, management also highlighted that the environmental impact assessment was shaped by stakeholder consultations and ongoing discussions with government departments. As a result of this submission, the project has now entered a formal review phase, where authorities will examine the submitted dossier.
The company highlighted that once operational, the wind farm is expected to generate around 6 TWh of electricity annually, enough to power over one million French homes. The project is located almost 40 km offshore and is recognized as one of the largest renewables projects ever built in France. Lastly, management noted that the total investment for the project is around €4.5 billion and is expected to employ up to 2,500 workers during the three-year construction phase.
TotalEnergies SE (NYSE:TTE) is a global multi-energy company that produces and markets oil, biofuels, natural gas, renewables, and electricity.
While we acknowledge the potential of TTE as an investment, we believe certain AI stocks offer greater upside potential and carry less downside risk. If you’re looking for an extremely undervalued AI stock that also stands to benefit significantly from Trump-era tariffs and the onshoring trend, see our free report on thebest short-term AI stock.
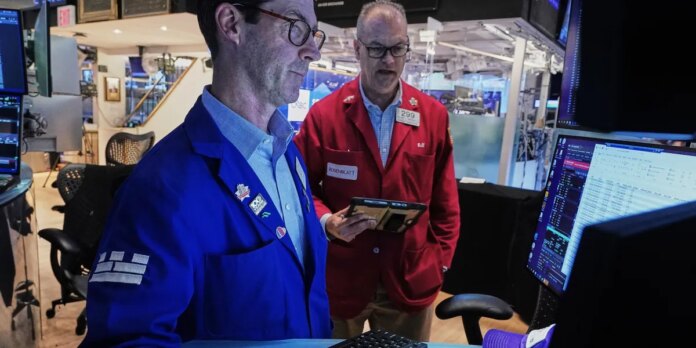
The U.S. stock market had its worst day since October Friday as a sell-off in big technology companies weighed down the broader market and a strong jobs report boosted expectations that the Federal Reserve will be forced to hike interest rates at some point this year.
The S&P 500 sank 2.6%, its biggest one-day drop since October 10, when the Trump administration threatened to impose a 100% tariff on imported goods from China. The losses helped push the benchmark index to its first losing week in the last 10.
The Dow Jones Industrial Average fell 1.4%, while the Nasdaq composite slumped 4.2%.
Tech stocks dragged the broader market lower as companies that had powered the S&P 500 to a series of records the past two months saw losses. Nvidia fell 6.2%, Broadcom dropped 7.9% and Micron Technology slid 13.3% for the biggest loss among stocks in the S&P 500.
Shares in Meta fell 5.5% following a published report that the social media giant may seek to do a new stock offering to raise funds for spending on AI infrastructure.
Stocks within the S&P 500 were not far from being evenly split between gainers and losers. But, many of the bigger tech stocks have pricey values that tend to give them outsized influence on the broader market.
Meanwhile, bond yields jumped after a report showed the U.S. added a surprising 172,000 jobs in May, according to the Labor Department. It is the latest report showing that employment remains solid, despite the squeeze inflation is putting on businesses and consumers.
The latest reading on employment comes two weeks before Kevin Warsh heads his first policy meeting as chair of the Fed. Policymakers are widely expected to keep rates steady at the June 16-17 meeting despite pressure from President Donald Trump to lower borrowing costs. Longer-term, the market sees a better than 60% chance the Fed will push rates higher by the end of the year, according to CME FedWatch, and little to no chance of a cut.
“Any hopes of a Fed rate cut have effectively been eliminated with this morning’s strong jobs report,” said Ronald Temple, chief market strategist at Lazard, in a research note.
The yield on the 10-year Treasury rose to 4.54% from 4.50% just before the report was released. The yield on the 2-year Treasury, which more closely tracks the Fed’s actions, jumped to 4.16% from 4.04% just prior to the report.
The Fed has been holding interest rates steady as it tries to gauge the ongoing impact from rising inflation. Prices were already ticking higher from the impact of tariffs. The U.S. war with Iran has essentially blocked crude oil shipments from moving through the Strait of Hormuz.
The price of Brent crude, the international standard, fell 2% to settle at $93.09. It was about $70 per barrel before the war. The surge in oil prices prompted a jump in fuel prices. That has fueled a broader rise in inflation as prices for anything being shipped move higher and threaten to slow economic growth.
A measure of inflation preferred by the Fed showed that prices rose 3.8% overall in April. That marked the biggest increase in two years.
Wall Street has been anticipating that negotiations to end the war will eventually be successful. American and Iranian negotiators reached a tentative deal last week to extend their ceasefire, but the agreement has not been finalized.
The latest round of corporate earnings is coming to a close. Lululemon slumped 8.6% after trimming its revenue and profit forecasts.
Most reports from companies have been surprisingly good and helped Wall Street on its record run. Encouraging profits and forecasts helped overshadow lingering worries about the direction of the economy amid tariffs and high energy costs because of the U.S. war with Iran.
With earnings now in the background, analysts have been warning that the tech companies benefiting from interest in artificial intelligence may have become too expensive. That could result in a slowdown for a market that has posted a solid gain in 2026, with the S&P 500 up 7.9% for the year.
All told, the S&P 500 fell 200.57 points to 7,383.74 on Friday. The Dow dropped 695.15 points to 50,866.78, and the Nasdaq lost 1,121.53 points to close at 25,709.43.
Markets were mixed in Europe after markets in Asia fell.
___
AP Business Writers Chan Ho-him and Matt Ott contributed to this report.
Bitcoin [BTC] has gotten June off to a remarkable start. Within five days, the price has dropped by 14.4%. The first three days of the month saw a cumulative $1.399 billion in outflows from Spot exchange-traded funds (ETFs).
Source: Ali Martinez on X
In a post on X, Ali Martinez used Glassnode data to demonstrate that Bitcoin had lost control of the $72.4k level. This level was one of the pricing bands derived from the MVRV ratio. Specifically, it was the -0.5σ, or half a standard deviation below the mean at $94.1k.
The next major support zones lie around $54k and $50k, which agrees with the $51k forecast AMBCrypto had made recently.
The sustained pressure on Bitcoin has led to massive liquidations. The $60k support, based on the February crash’s lows, was about to be tested and could lead to a capitulation event.
The Bitcoin Rainbow Chart shows gloom at its peak
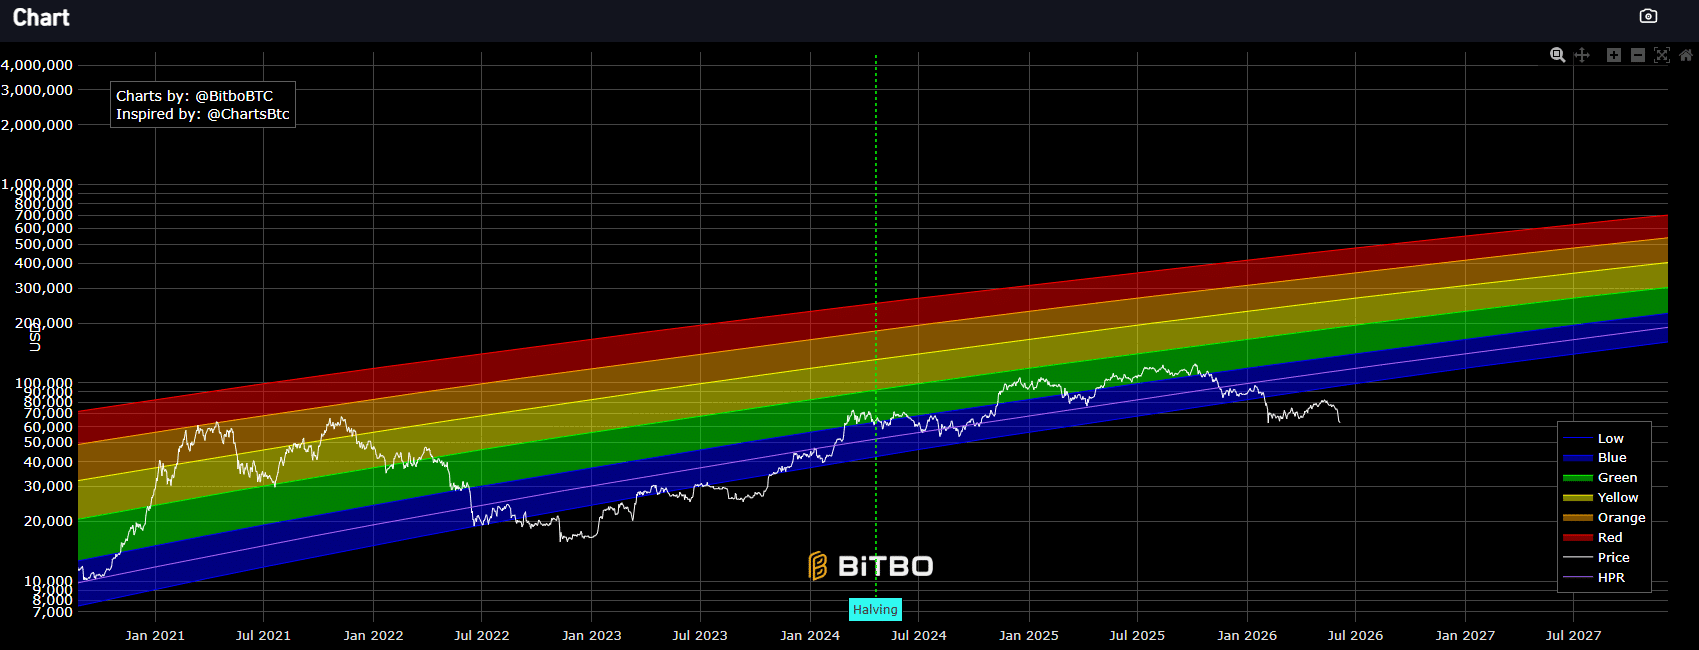
Popular crypto commentary account Altcoin Daily observed that the price of Bitcoin has fallen below the Rainbow Chart once again.
This tool is more of a fun chart that uses logarithmic regression to plot price trends, rather than a metric with which to make serious financial decisions.
Source: Bitbo Charts
In September 2022, Bitcoin dived below the lower confines of the Rainbow Chart. It stayed there for just over a year before the bull run resumed. More recently, according to the chart above, BTC lost the rainbow in February 2026.
It should be noted that the Rainbow Chart was not made to take evolving cycles into account. As crypto and Bitcoin matured as a market, the volatility in their nascency has been falling.
Each cycle’s peak has extended not further, in terms of percentage, than the one that came before it.
This is to be expected as an asset’s market cap grows. BTC has also had many developments, such as spot ETFs and institutional holdings. Saylor’s long-term bet involved raising debt to buy BTC, effectively making MSTR a leveraged Bitcoin ETF.
Investors must remain nimble in their analysis and appreciate the Bitcoin Rainbow Chart for what it is—a projection, not an accurate forecasting model.
Final Summary
Bitcoin has fallen below the lower bands of the Rainbow Chart, like it did during the 2022 bear market.
The on-chain metrics and market sentiment suggested a drop toward $51k is possible later in 2026.
Memecoins are usually where traders go looking for risk. This week they’re where risk is getting cut first. Dogecoin and Shiba Inu both shed roughly 9% as bitcoin drifted toward the $60,000 level, with the sharpest selling concentrated in the most speculative corners of the market.
News Background
• Broader crypto sentiment deteriorated as bitcoin slipped toward the psychologically important $60,000 level, triggering liquidations across altcoins and memecoins.
• Derivatives traders moved into defensive positioning, with DOGE futures open interest falling and SHIB open interest hovering near cycle lows.
• Despite the selloff, both tokens continue to show conflicting signals underneath the surface, with DOGE and SHIB seeing sizeable exchange outflows that would normally be associated with accumulation.
Price Action Summary
• Dogecoin fell from $0.0891 to $0.0830, breaking the ascending channel that had guided price action since February.
• Shiba Inu dropped from $0.000004997 to $0.000004630, slicing through support near $0.000004780 on heavy selling pressure.
• Both tokens saw their biggest volume spikes during breakdowns rather than recoveries, a sign sellers remained in control throughout the session.
Technical Analysis
• DOGE’s breakdown below channel support is the more important development than the percentage decline itself. The ascending structure had held for four months, and losing it shifts attention toward lower support levels near $0.067.
• SHIB’s chart looks weaker still. The token remains below every major moving average and continues printing lower highs and lower lows despite aggressive token burns and ecosystem growth.
• In both cases, exchange outflows failed to support price. That usually means traders are paying more attention to macro conditions and momentum than longer-term accumulation signals.
• Oversold readings are beginning to appear across momentum indicators, but neither DOGE nor SHIB has shown convincing evidence of a durable reversal.
What traders should watch
• For DOGE, the key level is $0.0819. A clean break below it would strengthen the case for a move toward $0.067.
• For SHIB, support sits near $0.000004575. Losing that area exposes the next downside zone around $0.000004500.
• Recovery attempts face immediate resistance at $0.0883 for DOGE and $0.000004780 for SHIB, both former support levels that have now turned into overhead supply.
• Until buyers start reclaiming broken support rather than merely bouncing from oversold conditions, the path of least resistance remains lower.
WASHINGTON, June 4 (Reuters) – The nation’s top bank regulators plan to tell Congress on Thursday that their efforts to trim bank rules and oversight will bolster economic activity and innovation without injecting undue risk into the financial system.
The regulatory chiefs of the Federal Reserve, Federal Deposit Insurance Corporation and Office of the Comptroller of the Currency are set to testify before the House Financial Services Committee, where they will update lawmakers on a comprehensive effort to reconsider and soften numerous bank rules put in place following the 2008 financial crisis.
“By tailoring requirements to actual risk, focusing supervision on what truly matters, and integrating innovation into the regulatory framework, the Federal Reserve is creating conditions for banks to thrive while maintaining the robust safeguards,” said Fed Vice Chair for Supervision Michelle Bowman in prepared remarks posted Wednesday.
Bowman and her fellow regulators have been busy re-examining tougher standards put in place in recent years, arguing that overly punitive oversight has hindered banks’ ability to support the economy. For example, Bowman said the Fed has found that examiners have reported numerous bank deficiencies that were procedural or documentation gaps, not actual financial risk.
“For over a year, we have been reforming supervision to focus on material financial risks rather than on process-oriented, check-the-box requirements,” said FDIC Chairman Travis Hill in his prepared remarks.
At the same time, regulators plan to tell lawmakers they want to encourage innovation in the financial sector, both by banks through utilization of blockchain technologies and artificial intelligence, as well as nonbanks.
“Our job is to facilitate, not stymie, responsible innovation,” said Comptroller Jonathan Gould in prepared testimony.
However, they also warned new technologies pose risks to banks. Bowman noted that new AI models have “dramatically accelerated” the identification of vulnerabilities in the banking system.
(Reporting by Pete Schroeder; Editing by Cynthia Osterman)
Ethena [ENA] fell 14.28% to $0.0907 as Multicoin Capital moved 56.1 million ENA worth $5.28 million through Galaxy Digital and BitGo. Multicoin Capital’s latest transaction has drawn fresh attention to Ethena’s market structure.
According to Onchain Lens, the firm deposited 56.116 million ENA valued at approximately $5.28 million into Galaxy Digital through BitGo.
The transfer arrived during a period of heightened weakness for ENA, which had already lost over 14% in the previous 24 hours.
Large institutional transfers often attract scrutiny because they can precede custody changes, OTC deals, or exchange-related activity. However, the transaction alone did not confirm immediate selling intentions.
Instead, it introduced uncertainty around institutional positioning as traders attempted to determine whether the move reflected strategic portfolio management or preparations for further market activity.
While institutional transfers dominated headlines, Spot flow data showed a different trend beneath the surface.
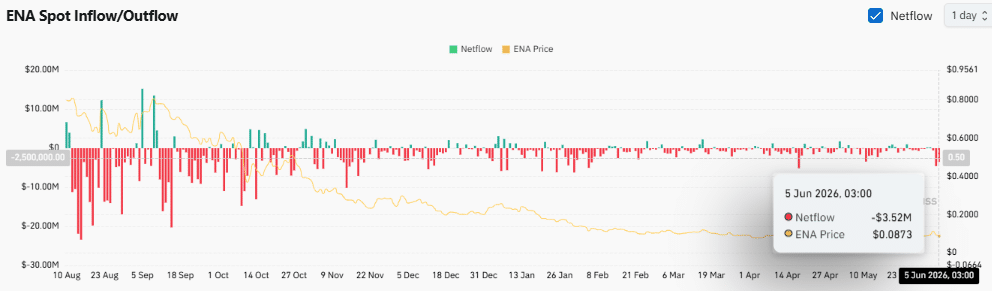
ENA recorded a net outflow of approximately $3.52 million on the 5th of June, extending a pattern of tokens leaving exchanges.
Persistent negative netflows typically indicate that more assets have exited trading venues than have entered them.
As a result, immediately available exchange supply has continued shrinking. The outflow trend remained visible throughout much of the recent period despite broader market weakness.
Such behavior often suggests that some participants preferred holding rather than positioning for immediate liquidation.
Source: CoinGlass
Can ENA hold its crucial floor?
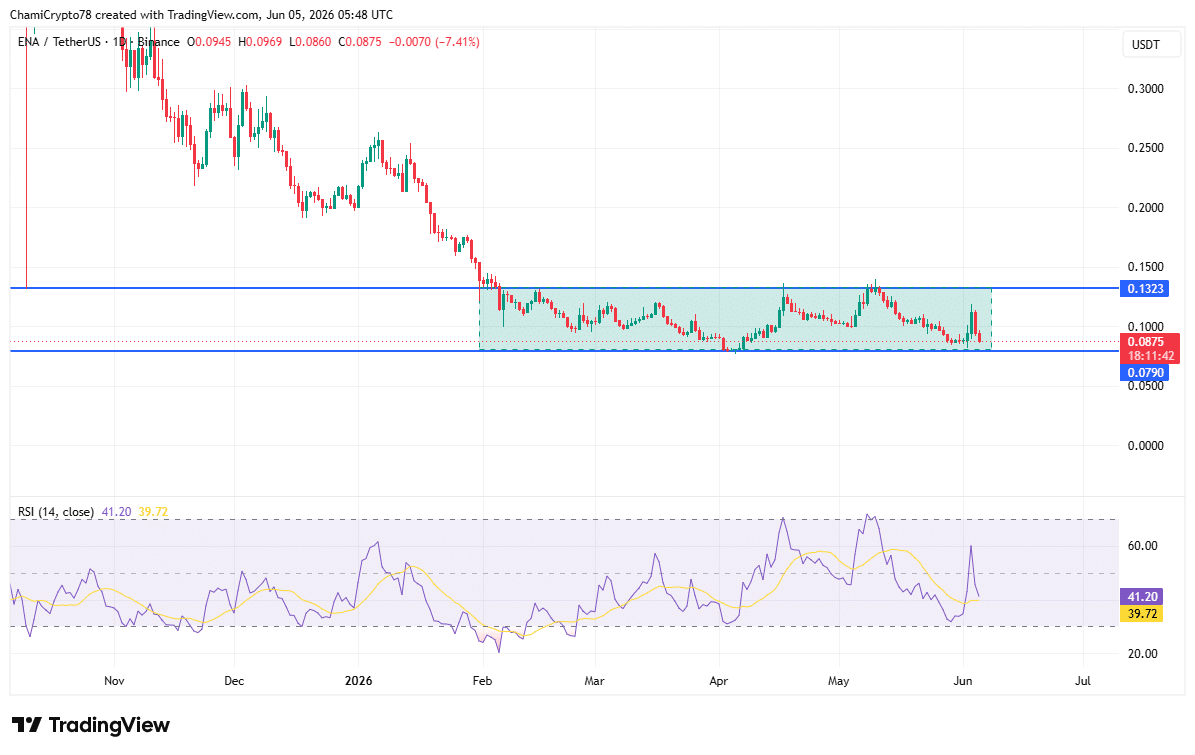
Price action remained confined within a range that has defined trading behavior since February. ENA revisited the lower boundary near $0.079 after another wave of selling pressure pushed the asset lower.
The daily chart showed repeated reactions around this zone, reinforcing its importance as a major support area. Meanwhile, resistance remained established around $0.132, creating a wide trading corridor that has contained price movements for several months.
Recent attempts to rally toward the upper boundary lost strength before reaching resistance. As a result, sellers regained control and forced another retreat toward support.
The Relative Strength Index recovered to 41.20 after previously approaching oversold territory during the recent decline.
Its moving average stood near 39.72, indicating that buying interest had started returning after the sharp sell-off.
The current structure suggests that market participants continued treating the range as the dominant framework until a decisive breakout emerged.
Source: TradingView
Why are Binance traders still bullish?
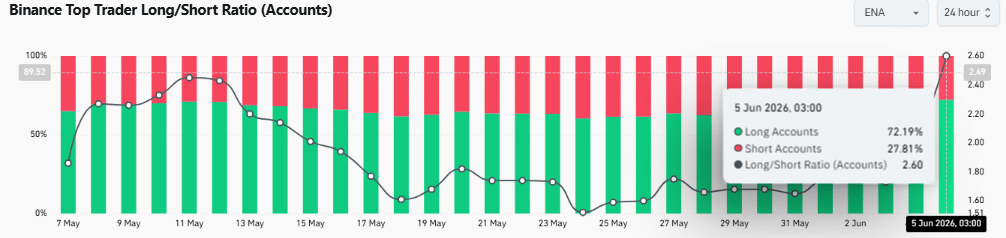
Derivatives positioning presented a striking contrast to recent price performance. Binance top trader data showed that 72.19% of accounts remained long, while only 27.81% held short positions.
This pushed the Long/Short Ratio to 2.60, one of the strongest bullish readings in recent weeks. Such positioning indicated that professional traders largely anticipated recovery despite the correction.
However, concentrated bullish exposure can create additional volatility whenever price moves against consensus expectations.
Recent declines have not significantly altered trader conviction, suggesting that many participants still viewed current levels as attractive.
Source: CoinGlass
Can ENA reclaim $0.132?
ENA’s setup currently favors a recovery over a deeper decline. Spot outflows of $3.52 million continued reducing exchange supply, while Binance top traders remained heavily bullish with 72.19% long positions.
Although the price retested the $0.079 support, the RSI recovered from oversold conditions, suggesting selling pressure had eased. If buyers continue defending support, ENA would be more likely to revisit the $0.132 resistance than break lower.
Final Summary
ENA outflows continue reducing exchange supply despite recent price weakness.
Binance traders remain strongly bullish as ENA defends long-term support.
Hardcore bitcoin purists haven’t lost faith in the world’s largest digital currency, despite it losing nearly 17% of its value, marking the worst weekly performance since July 2024 and wiping out about $200 billion in market cap in the last seven days.
The prominent bitcoin advocates or maximalists (short for maxis) — a group that believes bitcoin is the only cryptocurrency likely to achieve lasting global adoption and monetary relevance — argue that capital is being sucked out of crypto and into artificial intelligence, creating what they see as a temporary liquidity crunch rather than a fundamental bitcoin problem.
This narrative comes as the world’s largest cryptocurrency is currently hovering below $60,000, down about 27% over the past month and down by more than 50% from its Oct. 6 all-time high, according to CoinDesk data.
The capital flight coincided with a record-breaking streak for U.S. spot bitcoin ETFs, which suffered $3.45 billion in outflows across 11 consecutive sessions. While crypto bleeds, Wall Street’s tech appetite remains aggressive. Even after the recent pullback, AI-related equities remain among the market’s strongest performers. The Nasdaq rose 34%, and the S&P 500 climbed nearly 24% in the last year, raising anxiety among crypto investors seeking answers about bitcoin’s underperformance.
While some market observers view the drop as a loss of structural confidence, bitcoin maxis argue the slump is merely a reflection of speculative capital rotating heavily into AI.
According to Mati Greenspan, a market analyst, bitcoin maximalist and founder of Quantum Economics, the price of bitcoin is in a downward trend, not because investors have lost faith in it, but because AI has become the dominant destination for speculative capital.
“Bitcoin is not facing a bitcoin problem. It’s facing a liquidity problem,” Greenspan told CoinDesk in an interview Friday. “AI has become the market’s new obsession, but obsessions fade.”
Another prominent bitcoin maxi and subject of recent debate if his bitcoin selling has caused the recent crash, Strategy (MSTR) Chairman Michael Saylor echoed Greenspan’s sentiment on X.
“Capital markets are funding the AI buildout at historic scale: ~$400B over six months,” Saylor said. Bitcoin ETFs have seen ~$4B of outflows since May 14, pressuring BTC. This is a capital rotation, not a bitcoin impairment. Volatility creates opportunity.”
‘The root cause’
Greenspan pointed to the Anthropic $50 billion IPO, targeting a nearly $1 trillion valuation, as the clearest indication of where market liquidity might have gone.
While bitcoin advocates point to the asset’s historical long-term returns, traditional liquidity pools are currently chasing AI infrastructure, data centers, and multi-billion-dollar private capital rounds, Greenspan added.
In fact, the anticipated IPOs of OpenAI, Anthropic and SpaceX, which together could raise more than $200 billion, may be drawing investor attention and capital toward AI and technology opportunities at the expense of other speculative assets, including crypto.
Bitcoin core developer and maximalist Jameson Lopp argued that investor frustration during market downturns often fuels the search for simple explanations. “I suspect the root cause is the bear market, combined with TradFi markets experiencing an AI boom,” Lopp said on X.
However, not everyone is blaming AI as the primary driver behind bitcoin’s weakness.
Market data suggests the pressure on crypto is multifaceted, and critics argue that blaming AI entirely oversimplifies a fragile macroeconomic environment. Jason Fernandes, a bitcoin maxi, market analyst and AdLunam co-founder, told CoinDesk that the asset is facing pressure from multiple fronts.
“BTC is under siege from every angle right now,” Fernandes said. “ETF outflows, high interest rates, creeping inflation, money rotating back into hot tech stocks, macro uncertainty, and now the psychological shock of Michael Saylor’s Strategy selling BTC after years of preaching ‘never sell.’”
Strategy, the largest publicly traded corporate holder of bitcoin, drew heavy criticism on social media after selling 32 bitcoin for $2.5 million in late May—its first sale in four years—to fund dividend payments on STRC, its perpetual preferred stock known as Stretch.
Though critics claimed the move “damaged confidence,” Greenspan, like many other analysts, dismissed the panic. “Selling 32 BTC against a balance sheet of more than 843,000 BTC is not even a rounding error,” Greenspan said.
Time to buy?
Despite the outflows, some of the maxis argue it might be time to dip into the underperforming asset as bitcoin’s longer-term fundamentals remain intact.
Greenspan argued that the recent record-breaking outflows from bitcoin funds are likely part of a rotation back toward monetary assets. He added that bitcoin’s current consolidation phase could serve as an accumulation zone if underlying network fundamentals hold. Despite the price dip, institutional adoption, regulatory frameworks, and discussions around bitcoin as a strategic reserve asset have continued to mature over the last few years.
Meanwhile, other bitcoin advocates, such as Strike CEO Jack Mallers, are bypassing broader market debates and encouraging investors to buy the dip on social media.
However, a rotation back into crypto is not guaranteed to be smooth. Even if bitcoin’s weakness stems partly from capital flowing into AI, Greenspan argues that a reversal may not immediately benefit crypto and might act as a double whammy.
“If AI sentiment cracks, bitcoin could get hit twice: first from liquidity leaving crypto, and then again from a broader risk-off move across markets,” Greenspan said.
“As for what comes next, I would be careful assuming the bottom is already in,” Greenspan noted.