A significant transformation is currently underway across the established cryptocurrency market. The top crypto exchanges are morphing into multi-asset financial platforms, breaking down the traditional barriers that once kept crypto and Wall Street completely apart.
Crypto exchange OKX rolled out 13 new “X-Perp” markets for European traders on Tuesday, giving retail users direct access to “Magnificent 7” tech stock futures, alongside major commodity indices like gold, silver, and crude oil. The platform also added perpetual markets for major index funds like the SPY and QQQ, enabling users to trade exposure to the largest U.S. equities outside standard market hours.
Exchanges like OKX are deliberately expanding their services to stop cash from leaving their platforms, while catering to everyday traders who now want to bet on more than just crypto.
Centralized exchange trading volumes recently dropped more than 11% to $4.61 trillion, hitting their lowest performance level since late 2024, according to CoinDesk Data’s April 2026 market reviews. “Retail participation across crypto has moderated, but the demand for trading has not disappeared,” said Behrin Naidoo, founder of Neutral DeFi Protocol. Naidoo, an alumnus of London Business School who previously managed global market strategies and fintech investments at J.P. Morgan, PwC, and RMH, told CoinDesk that the problem isn’t a lack of interest, but rather an infrastructure gap.
Bitcoin stabilized around the $60,000–$63,000 range after a sharp selloff earlier this month, while persistent ETF outflows and broader risk-off sentiment continued to weigh on market activity.
However, capital continued rotating toward AI and technology stocks. Despite the weak backdrop, some AI-related tokens outperformed, showing that traders remain willing to chase strong narratives even as the broader market remains cautious.
Weekly winners
Audiera [BEAT] – AI crypto project delivered strong relative performance
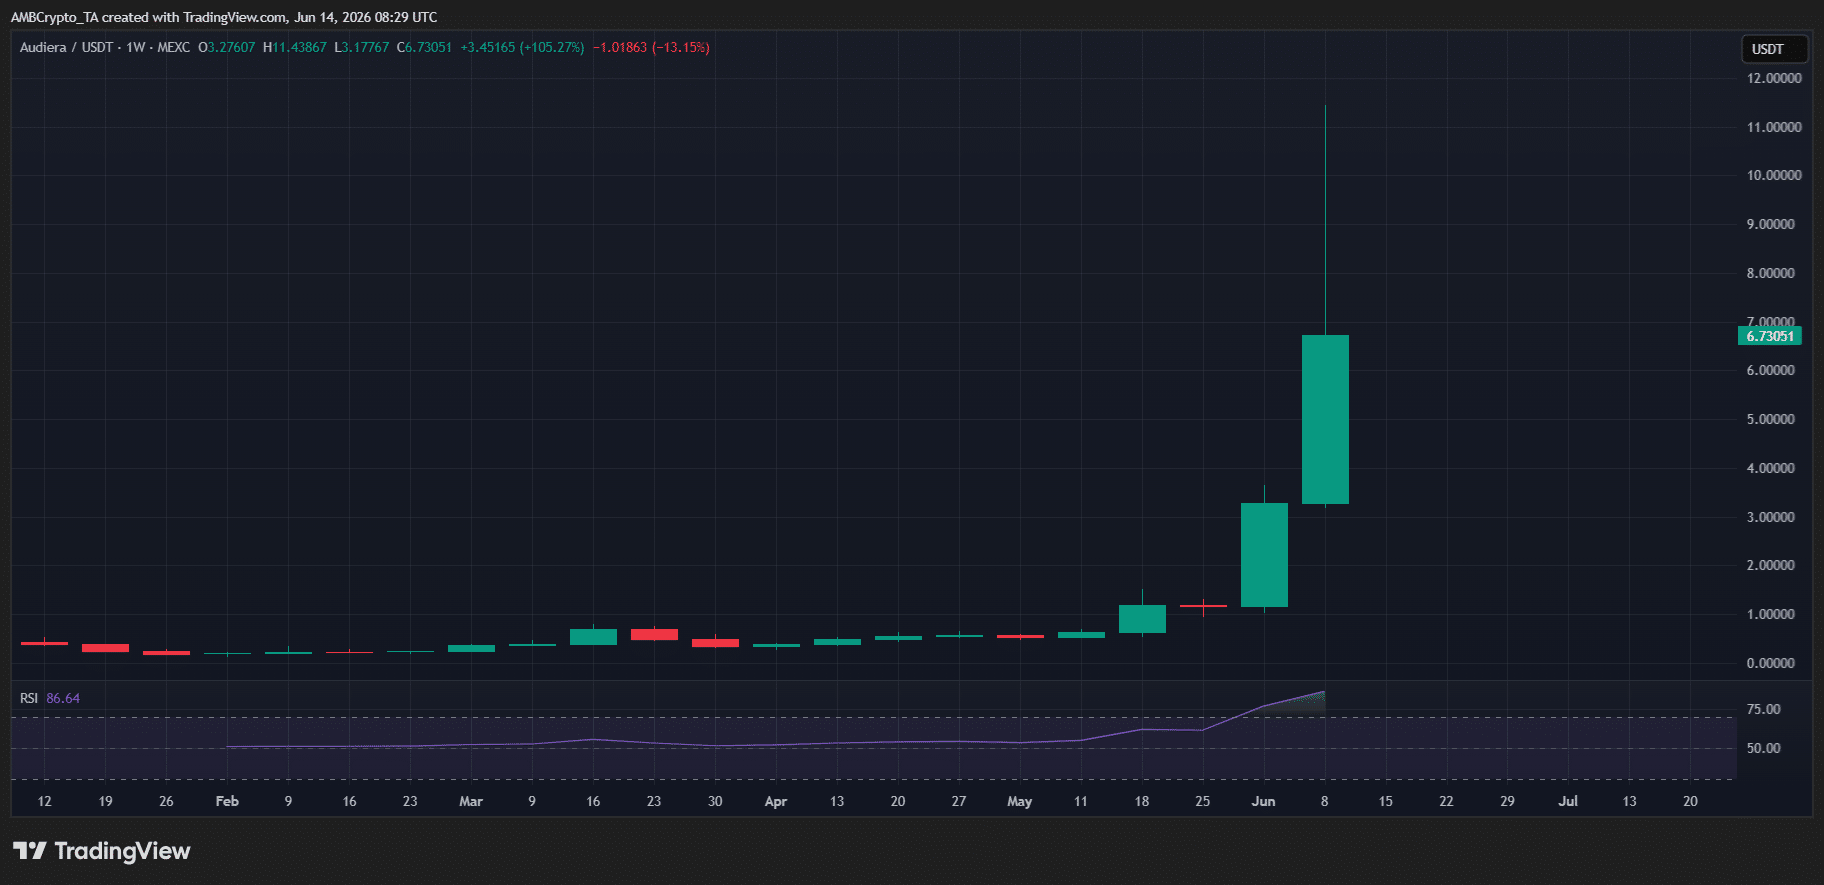
Audiera [BEAT] topped this week with a 106% rally, extending the token’s gains after surging 185% last week. The move was driven by continued buying pressure and strong demand for AI-related tokens.
However, the rally has pushed the RSI above 80, signaling that BEAT is now in overbought territory. While this reflects strong bullish momentum, it also raises the risk of profit-taking in the near term.
Still, as long as BEAT holds above the $6 support level, the broader uptrend remains intact, with the $15 level emerging as the next major target.
Source: TradingView (BEAT/USDT)
From a technical standpoint, BEAT remains in a strong position after breaking into price discovery.
The token continues to hold above key breakout levels, signaling sustained buying pressure despite broader market uncertainty.
As long as bulls defend these levels, the current structure favors further upside. If this momentum persists, BEAT could remain in price discovery mode and extend its rally in the coming week.
Bittensor [TAO] – Decentralized network rose this week but needs to break resistance
Bittensor [TAO] emerged as the second-biggest winner this week, rallying 30%. However, the move appears to be more of a recovery bounce than a confirmed bullish breakout despite TAO reclaiming the $270 level.
Technically, TAO remains below its major resistance zone after trending lower since its March peak near $370.
While buyers have managed to push prices higher this week, the token has yet to break the series of lower highs that has defined the broader downtrend.
As a result, the $290-$350 region remains a key area to watch. A rejection from this zone could see sellers regain control and put lower support levels back under pressure.
Therefore, TAO needs a decisive break above resistance before the recent rally can be viewed as a sustained bullish reversal.
SKYAI [SKYAI] – AI project moved higher this week and is approaching resistance
SKYAI [SKYAI] took the third spot this week with a 25% rally, extending last week’s gains of 30%. The move reflects sustained bid pressure, with bulls continuing to reclaim ground lost during the late-May dip.
Technically, SKYAI remains in a healthy position as momentum indicators are yet to enter overbought territory. This suggests that, despite the recent rally, buyers may still have room to push prices higher before the market becomes overheated.
With the token holding its upward trajectory and momentum remaining constructive, SKYAI appears well-positioned to challenge the next major resistance level. If buying pressure persists, a breakout into the $0.40 zone could be the next step in the ongoing recovery.
Other notable winners
Outside the majors, altcoin movers also stood out this week.
MCOIN (MCOIN) led the action with a 173% surge, followed by SHOW (SHOW), which climbed 149%, while Velvet (VELVET) gained 138%, rounding out the week’s strongest movers.
Weekly losers
Humanity Protocol [H] – Digital identity project staged more than a cooldown rally
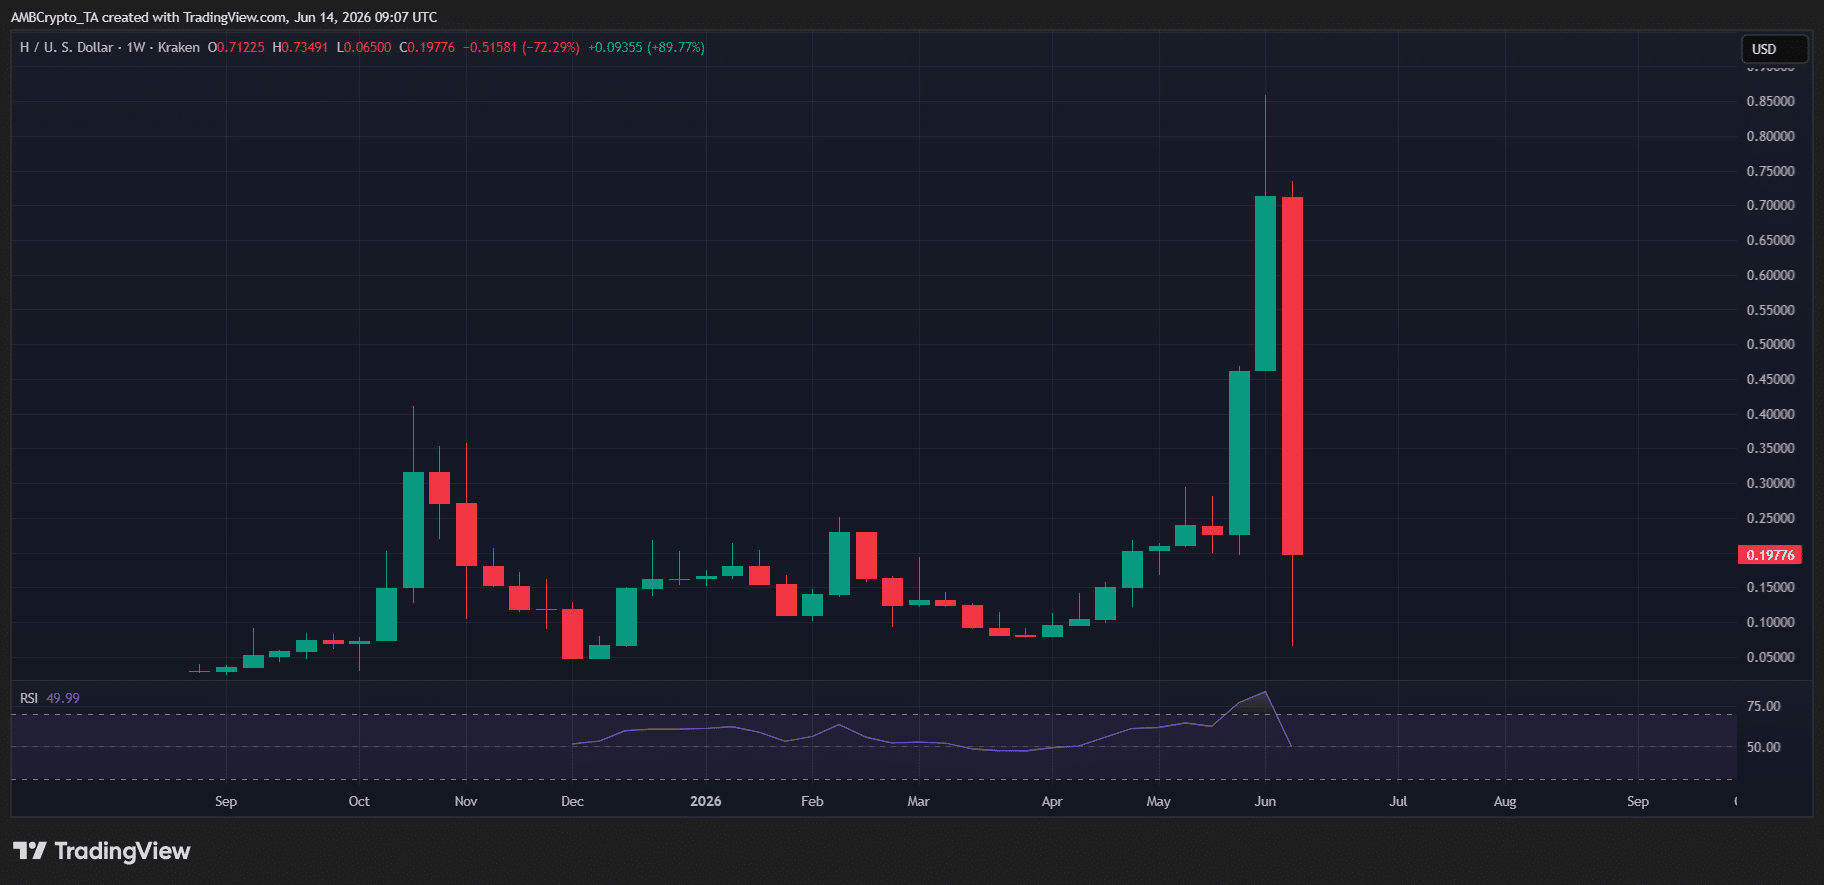
Humanity Protocol [H] led this week’s losers with a 72% decline. Technically, the sharp pullback came after a massive 150% rally over the previous two weeks, which pushed the token to a record high near $0.85. Such steep corrections are often seen after parabolic rallies as traders rush to lock in profits.
However, the scale of the decline suggests more than just a routine cooldown. The selloff pushed H back toward its early-April support zone around $0.19, effectively erasing much of the recent breakout and signaling that sellers have regained control of the market.
As a result, H has lost its bullish structure in the near term. Unless buyers can reclaim key resistance levels and stabilize price action, the token could remain under pressure in the sessions ahead.
Source: TradingView (H/USDT)
This makes H’s decline look like more than a typical post-rally cooldown.
The breakdown back to the $0.19 support zone suggests sellers have taken control, weakening the recovery that had driven the token to new highs just weeks ago.
If buyers fail to defend this level, the current downtrend could trigger a deeper correction. With broader market sentiment still leaning risk-off, H remains vulnerable to further downside in the coming week.
Steller [XLM] – Payments network saw weakening conviction and extended its losses
Stellar [XLM] came in second among this week’s losers with a 10% pullback, extending last week’s 20% decline. The continued losses suggest buyers are gradually losing control, with the token now drifting closer to the $0.14 support zone.
From a technical standpoint, the recent weakness stands out because XLM never showed particularly strong buying momentum during its earlier rally.
While the token surged in May, momentum indicators failed to reach overbought levels, signaling that demand was not strong enough to support a sustained breakout.
As a result, the current pullback appears to be a continuation of fading momentum rather than a temporary correction. If sellers remain active, XLM could continue lower and retest $0.14 in the near term.
DeXe [DEXE] – Governance protocol is repeating a strong rebound rally this week
DeXe [DEXE] took the third spot among this week’s losers with a 9.8% pullback. However, unlike H and XLM, DEXE’s decline looks more like a healthy correction than a bearish reversal.
Technically, the token has seen a similar setup before.
After a sharp pullback in April, buyers returned and pushed DEXE to fresh highs. The current decline appears to be following the same pattern, with profit-taking cooling the rally rather than reversing it.
If buyers continue to hold key support levels, DEXE could use this pullback to build momentum for another move higher. In that case, a rebound toward the $25 level could be the next target.
Siren [SIREN] led the losers with an 84% decline, followed by Sahara AI [SAHARA], which fell 53.4%, while Octra [OCT] dropped 44% as market momentum cooled.
Conclusion
This week was a rollercoaster. Big pumps, sharp dips, and nonstop action. As always, stay sharp, do your own research, and trade smart.
Final Summary
Audiera [BEAT], Bittensor [TAO], SKYAI [SKYAI] led the week in gains.
Elon Musk says SpaceX revenue could reach roughly $1 trillion a year by 2030, and likely more in 2031. That projection sits far above the forecasts of the bankers who just took his company public.
Musk made the claim on X (Twitter) over the weekend, days after SpaceX completed the largest stock market debut in history. His own underwriters model only a fraction of that number.
SpaceX Revenue Math Faces a Steep Climb
SpaceX reported $18.7 billion in revenue for 2025, according to its IPO filing. Revenue climbed from $14 billion in 2024, growth of about 33%.
Revenue stood near $10 billion in 2023, so the trajectory is steep but not vertical.
Even so, hitting $1 trillion by 2030 would demand a 53-fold jump in five years. No company near this size has ever grown that fast.
Musk framed the goal directly on the platform he owns.
I think SpaceX might be able to reach approximately $1T revenue in 2030,” he said in a post.
Follow us on X to get the latest news as it happens
He added that he would be surprised if revenue fell below $1 trillion in 2031.
Wall Street Forecasts Sit Far Below
Morgan Stanley, a lead underwriter, estimates SpaceX revenue near $330 billion in 2030. The bank models $160 billion as early as 2028.
Goldman Sachs leans harder on artificial intelligence yet still lands well short of Musk. Both banks assume years of flawless execution.
The optimism arrived alongside the company’s historic IPO debut, which pushed its valuation past $2 trillion. That session produced a string of surprising IPO facts, including Musk keeping 82.4% of voting power.
The AI Bet Carries the Forecast
Both forecasts rest on AI infrastructure rather than rockets. Morgan Stanley sees AI delivering roughly $190 billion of its 2030 total.
However, that unit earned just $3.2 billion in 2025 while losing $6.4 billion. It would need to outgrow the world’s leading AI labs to deliver.
For now, the Starlink satellite network carries the business, generating $11.4 billion last year. Subscribers reached 10.3 million by March 2026, up from 8.9 million a year earlier.
Bitcoin BTC$64,355.86 has a unique pattern, and it has held across every major bullish cycle since the cryptocurrency began trading near zero 16 years ago. This pattern suggests that prices could crash to at least $48,000.
The pattern works like this. Draw Fibonacci retracements from near zero – BTC began trading at $0.003 in February 2010 – to bull market peaks reached in June 2011, November 2013, December 2017, and November 2021.
The bear markets that followed these peaks saw prices crash well below the 61.8% retracement of the entire move from near zero to the bull peaks. This has happened every time, as seen in the charts below.
BTC’s Fibonacci retracements over the years. (CoinDesk)
Four peaks, four subsequent bear markets and four breaks below the 61.8% level. No exceptions.
Now comes the current cycle. Bitcoin peaked above $126,000 earlier this year. The 61.8% retracement from near zero in early 2010 to that peak sits at $48,215. Bitcoin is trading around $64,000 today, still well above that level.
The pattern hasn’t triggered. But if it does, a crash to at least $48,215 is where the charts point.
What’s your plan for retirement? Every investor should have a solid plan in place for what happens when the work ends, which includes taking the time to study their expenses, estimate how much income they’ll need in retirement, and, importantly, figure out how they’ll get that income.
But as the Scottish poet Robert Burns noted in a poem, “The best laid schemes o’ Mice an’ Men, / Gang aft agley” — that is, our plans often go awry.
Missed Nvidia in 2009? This Rare Signal Is Flashing Again.In 2009, a “Double Down” signal flashed for a little-known chipmaker called Nvidia. For the first time in years, that same “Total Conviction” signal is flashing for a company 1/100th the size of Nvidia. Continue »
Indeed, according to the 2026 Annual Retirement Study from the folks at Allianz Life, “42% of Americans retire earlier than expected — often due to circumstances beyond their control.”
Image source: Getty Images.
Retiring earlier than planned is a recipe for trouble
Retiring before you plan to is obviously a big problem, and it’s apparently affecting 2-in-5 Americans. That’s millions and millions of people. Imagine planning to retire at 70. (You might be doing so in part to maximize your Social Security benefits, as multiple studies have found that most people will get the most out of Social Security by delaying claiming their benefits until age 70.) If you suddenly find yourself retiring at 63 instead, and not by choice, here are some problems you’ll face:
You’ll lose out on seven years of saving and investing for retirement.
Some of the money that you’ve amassed in your retirement accounts will have seven fewer years in which to grow for you, because you’ll have to withdraw it early to support yourself.
You won’t be able to sign up for Medicare for another two years, so you may have to pay for health insurance on your own for a while — and it costs a lot.
Your retirement nest egg will now have to help support you for longer. If you end up living to 90, for example, retiring at 70 would have given you a 20-year retirement. But retiring at 63 means your nest egg will need to help support you for 27 years — a much taller order.
You may have to start collecting Social Security at 63. (You can do so as early as age 62, but the earlier you claim your benefits, the smaller the checks will be.)
Why are people retiring earlier than planned?
So why are people retiring earlier than planned? You can probably guess at the answers. The Allianz Life study offered these as common reasons:
Health issues that prevent performing their job — 30%
Unexpected job loss — 21%
Financially ready earlier than expected — 21%
What to do
What should you do with this information? Well, go ahead and hope for the best. Many people do retire according to plan. But also remember that many do not. So plan for the worst, just in case. Perhaps save more aggressively now, to make up for money you may not have time to earn and invest in the future.
Also, think about how you might avoid retiring early, and how you might manage if you do. For example, getting healthy and staying healthy might delay health issues, or prevent them from interfering with work. And setting up a side gig or reining in your spending can also keep you financially healthy for longer.
The $23,760 Social Security bonus most retirees completely overlook
If you’re like most Americans, you’re a few years (or more) behind on your retirement savings. But a handful of little-known “Social Security secrets” could help ensure a boost in your retirement income. For example: one easy trick could pay you as much as $23,760 more… each year! Once you learn how to maximize your Social Security benefits, we think you could retire confidently with the peace of mind we’re all after.
Many Americans leave money on the table in retirement. Learn more about these retirement strategies and more, available when you join Stock Advisor.
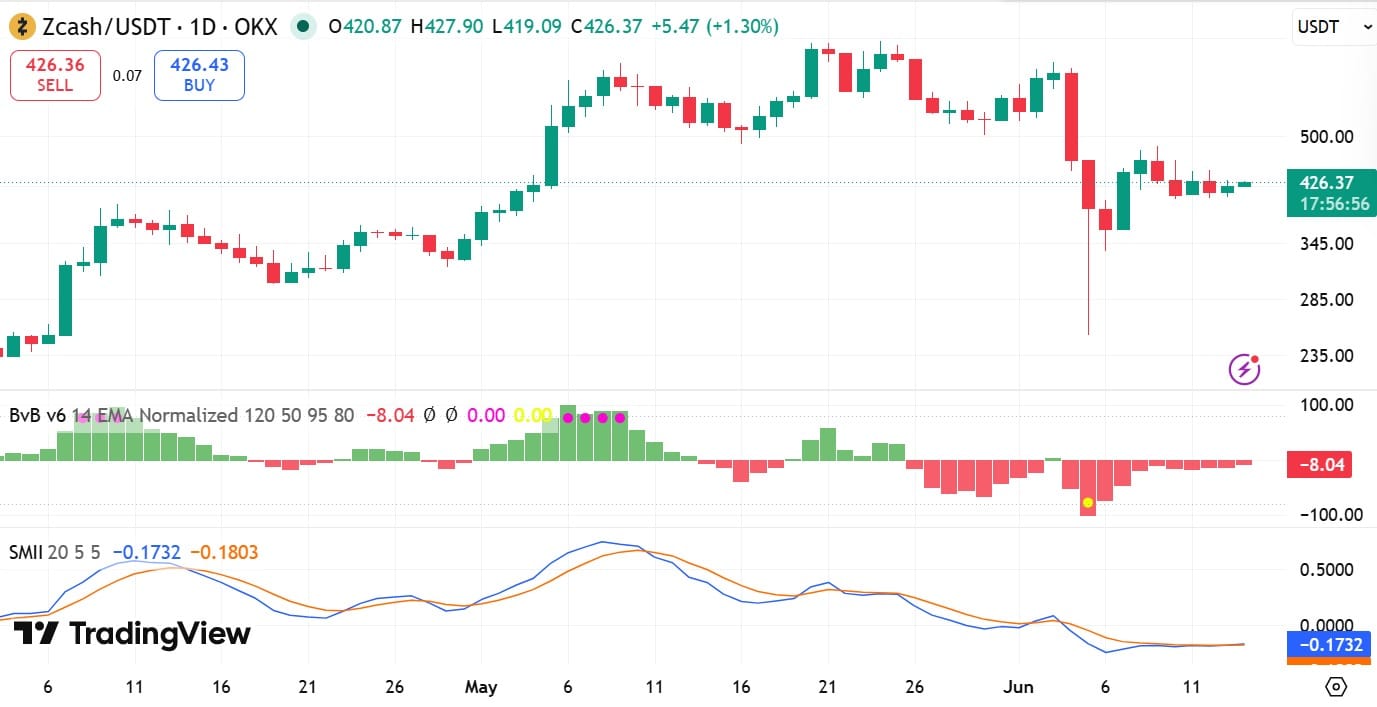
Zcash [ZEC] traded within a tight range between $400 and $430 over the past four days. At press time, ZEC traded at $427, up 2.6% over the day and 8% over the week.
The privacy-focused altcoin recovered from recent vulnerability concerns but struggled to build sustained momentum. Even so, some large investors appeared increasingly optimistic.
Why did a whale open a $21 million long position?
As ZEC stabilized above $400, trader Garret Jin increased his bullish exposure.
According to Hypurrscan data, Jin expanded his 2x leveraged long position to 50,100 ZEC, worth roughly $21.3 million.
Price volatility has already pressured the position. The whale was down approximately $654,000 and had paid more than $57,000 in funding fees.
That move suggested confidence that ZEC could eventually break out of its current consolidation range.
Why are most traders still betting against ZEC?
While Jin turned bullish, broader market sentiment remained cautious.
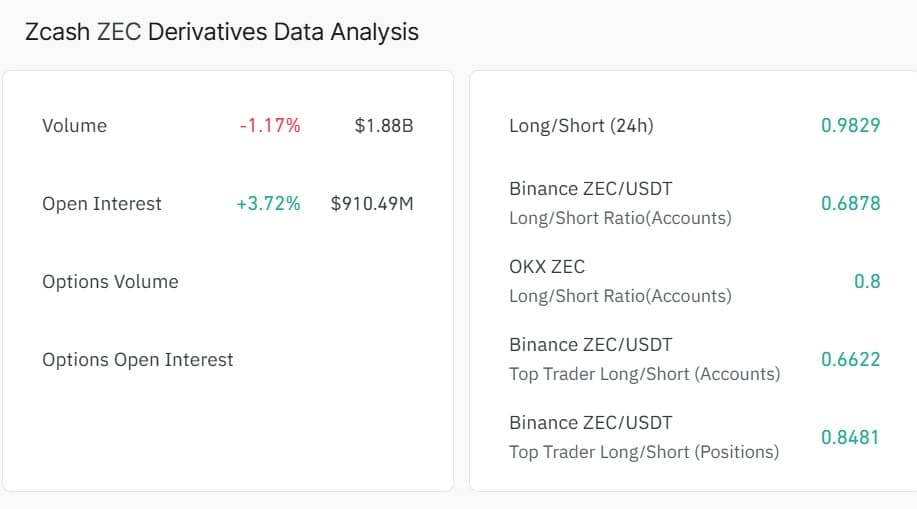
In fact, the Long/Short Ratio fell below 1 across major exchanges. The aggregate ratio stood near 0.98, while Binance and OKX posted readings around 0.6.
Source: CoinGlass
A Long/Short Ratio below 1 typically indicated that short positions outnumbered long positions. That suggested many traders expected another downside move.
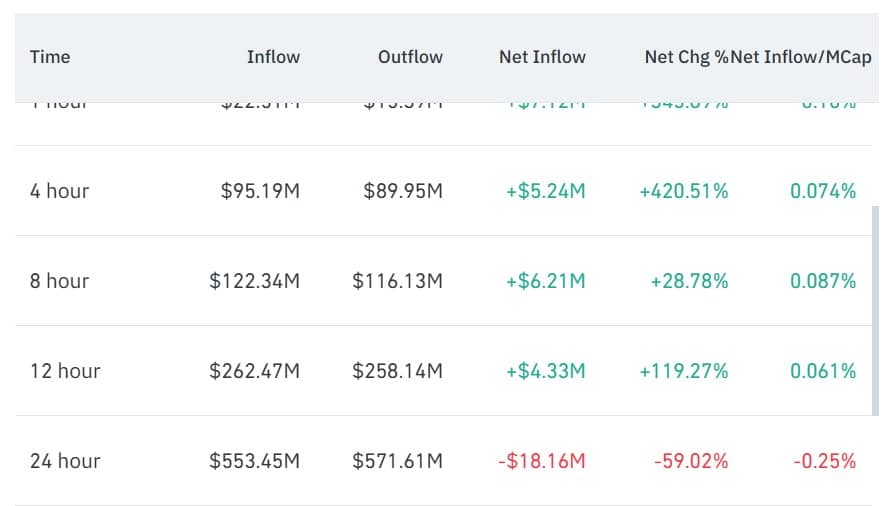
At the same time, Futures Open Interest increased as fresh capital entered the derivatives market.
More than $122 million flowed into futures markets over the past eight hours. Before that, ZEC recorded roughly $571 million in outflows over a 24-hour period.
Source: CoinGlass
That shift suggested new positions entered the market. However, current positioning implied a large share of that capital may have supported shorts.
Will ZEC break above $430 or fall below $400?
ZEC remained trapped inside a consolidation range as bulls and bears battled for control.
On top of that, several momentum indicators continued to favor sellers.
The Bulls vs Bears indicator printed a reading of -8.04 at press time. Negative readings typically suggest sellers retain the upper hand. Likewise, the SMI Ergodic Indicator remained below zero, reinforcing the bearish trend.
Source: TradingView
Together, these indicators suggested downside pressure remained present.
If sellers maintain control, ZEC could revisit the $400 support zone before attempting another recovery.
However, rising Futures Open Interest leaves room for volatility. A wave of short liquidations could help ZEC break above $430. If that occurs, the next major target sits near $500.
Final Summary
ZEC traded between $400 and $430 for four days despite recovering from recent market concerns.
A whale increased a leveraged long position to over $21 million, signaling confidence in higher prices.
Regardless of a ceasefire deal that reopens the Strait of Hormuz, Iran’s demonstrated ability to shut it down will continue to hang over the global economy, rendering the narrow waterway a contested space.
But while the U.S. has failed to restore freedom of navigation in the strait, a steady drumbeat of messaging recently suggests an effort to dilute Tehran’s new leverage.
Starting late last month, U.S. officials began revealing that more ships had been quietly crossing the strait with U.S. assistance through a route along the Omani coast. Subsequent reports pointed to a more robust U.S. role as “naval overwatch” offered protection from Iranian attacks.
The traffic uptick still represented just a fraction of pre-war levels, but it gave oil markets more breathing room before inventories reach critical levels while providing the U.S. additional leeway in negotiations with Iran.
On Tuesday, Energy Secretary Chris Wright admitted in congressional testimony that traffic in the strait was rising “very meaningfully” in a military operation that wasn’t being disclosed openly.
Then on Wednesday, President Donald Trump described a “secret mission” that he claimed had put more than 100 million barrels of oil on the market, or about five day’s worth of shipments before the war started.
“I can say it now. Something you didn’t know,” he said. “Do you know we’ve been taking out millions of barrels of oil? Nobody knows it. You know who doesn’t know about it? Iran — until right now.”
On Thursday, U.S. Central Command posted a message saying the Strait of Hormuz is open for transit, touting routes for safe passage, the hundreds of ships that have already crossed, and forces in place to defend against attacks.
“Iran does not control the Strait of Hormuz,” it added.
Interior Secretary Doug Burgum added to the chorus on Friday, when he said more than 20 ships exit the Persian Gulf on some nights under the cover of darkness with help from U.S. forces.
And for good measure, Defense Secretary Pete Hegseth told CBS News on Sunday that the U.S. naval blockage in Iran is “impenetrable” and 125 million barrels of oil have now exited the Gulf, “showing that we control the strait.”
An MH-60R Sea Hawk, assigned to Helicopter Maritime Strike Squadron (HSM) 50, takes off of the flight deck of Arleigh Burke-class guided-missile destroyer USS Thomas Hudner (DDG 116) during flight deck operations, May 19, 2026.
U.S. Navy
Meanwhile, Iran established a separate channel through the strait that runs along its coast, demanding tolls from ships that want to cross and attacking any that try to skirt it.
As a result, U.S. forces and Iran’s Islamic Revolutionary Guard Corps continue to exchange fire on a regular basis as both sides maintain competing lanes.
U.S. aircraft have bombed Iranian missile sites and destroyed fast-attack boats, while the IRGC launches drones at commercial ships and even downed an Apache attack helicopter, forcing the crew to be rescued from the water.
With protection from the U.S. military, tankers are crossing the strait from the Persian Gulf into the Gulf of Oman, where they offload their oil via ship-to-ship transfers—borrowing a tactic that the Iranian and Russian “shadow fleet” have used for years to avoid Western sanctions.
After the transfers, the newly loaded ships take their oil to customers around the world, while the empty tankers cross back into the Persian Gulf to full up on more crude supplies.
This has allowed Kuwait, which has no meaningful routes to export oil other than the Strait of Hormuz, to finally draw down its inventories that had built up during the closure.
In fact, Kuwait began offering to sell its crude to refiners in Asia on Tuesday, marking the first time since the Iran war started.
The United Arab Emirates, which has used a pipeline to get some supplies around the strait, has also been selling oil from inside the Persian Gulf to customers in Asia.
But Kuwait’s shipments are especially notable as they originate from deep inside the Gulf, meaning tankers must first travel while exposed to much of Iran’s coast before even reaching the strait.
A sailor signals an F/A-18F Super Hornet, attached to Strike Fighter Squadron (VFA) 103, aboard Nimitz-class aircraft carrier USS George H.W. Bush (CVN 77), May 20, 2026.