Home Blog Page 45

How high can XRP rally after a 654.71% activity surge? Assessing…

0
How high can XRP rally after a 654.71% activity surge? Assessing…


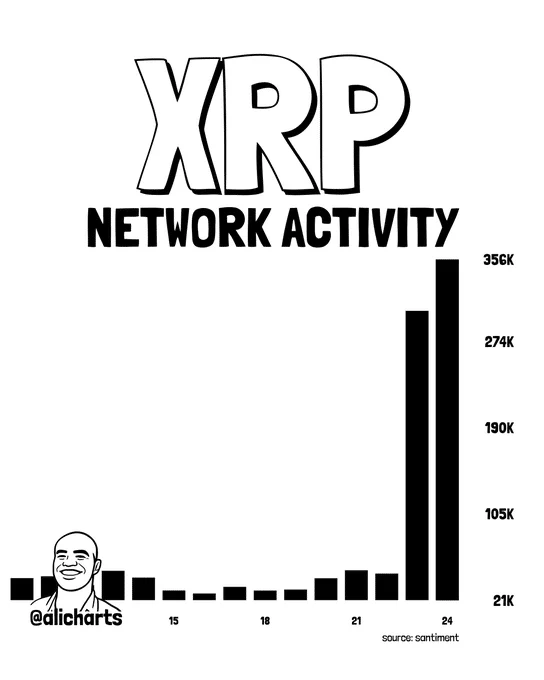
XRP saw a surge in activity on its network, with Active Addresses rising 654.71%. That growth added a new layer to the price recovery by showing stronger network participation.

The Total Active Addresses increased from 47,180 to 356,070, signifying a significant growth in network engagement. 

This rapid growth strengthened the activity supporting XRP’s recovery rather than leaving price gains isolated from network usage. 

Besides, the surge in participation also provided a larger potential user base for engaging with XRP in the recent price rally.

However, Active Addresses alone could not confirm whether participants were accumulating XRP or transferring existing holdings.

The token’s price action added some context as XRP’s price surged significantly with the expanding network engagement.

Source: X

Why are top traders betting on XRP?

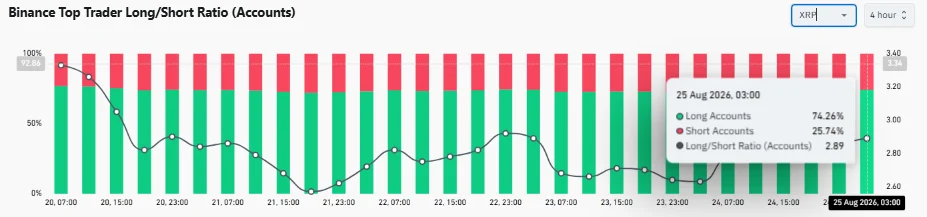
Bullish positioning by top traders on Binance complemented the exceptional growth in XRP network activity. Top traders’ positioning in long accounts was 74.26%, compared to 25.74% in short accounts.

The Long/Short Ratio came in at 2.89, indicating a significant imbalance in the exposure of larger Binance traders favoring the bulls. Notably, long positioning was dominant throughout the recovery period, despite the fluctuations of the account ratio.

That positioning added speculative support as network participation increased and XRP broke through nearby resistance. However, concentrated long exposure also increased the risk of a sharper reversal if leveraged traders began closing positions.

Still, positioning data favored the buyers as almost three-quarters of the tracked top accounts held long exposures. 

Combined with expanding addresses, traders had positioned for further upside rather than aggressively fading XRP’s recovery.

Source: CoinGlass

Is XRP’s NVT Ratio supporting the recovery?

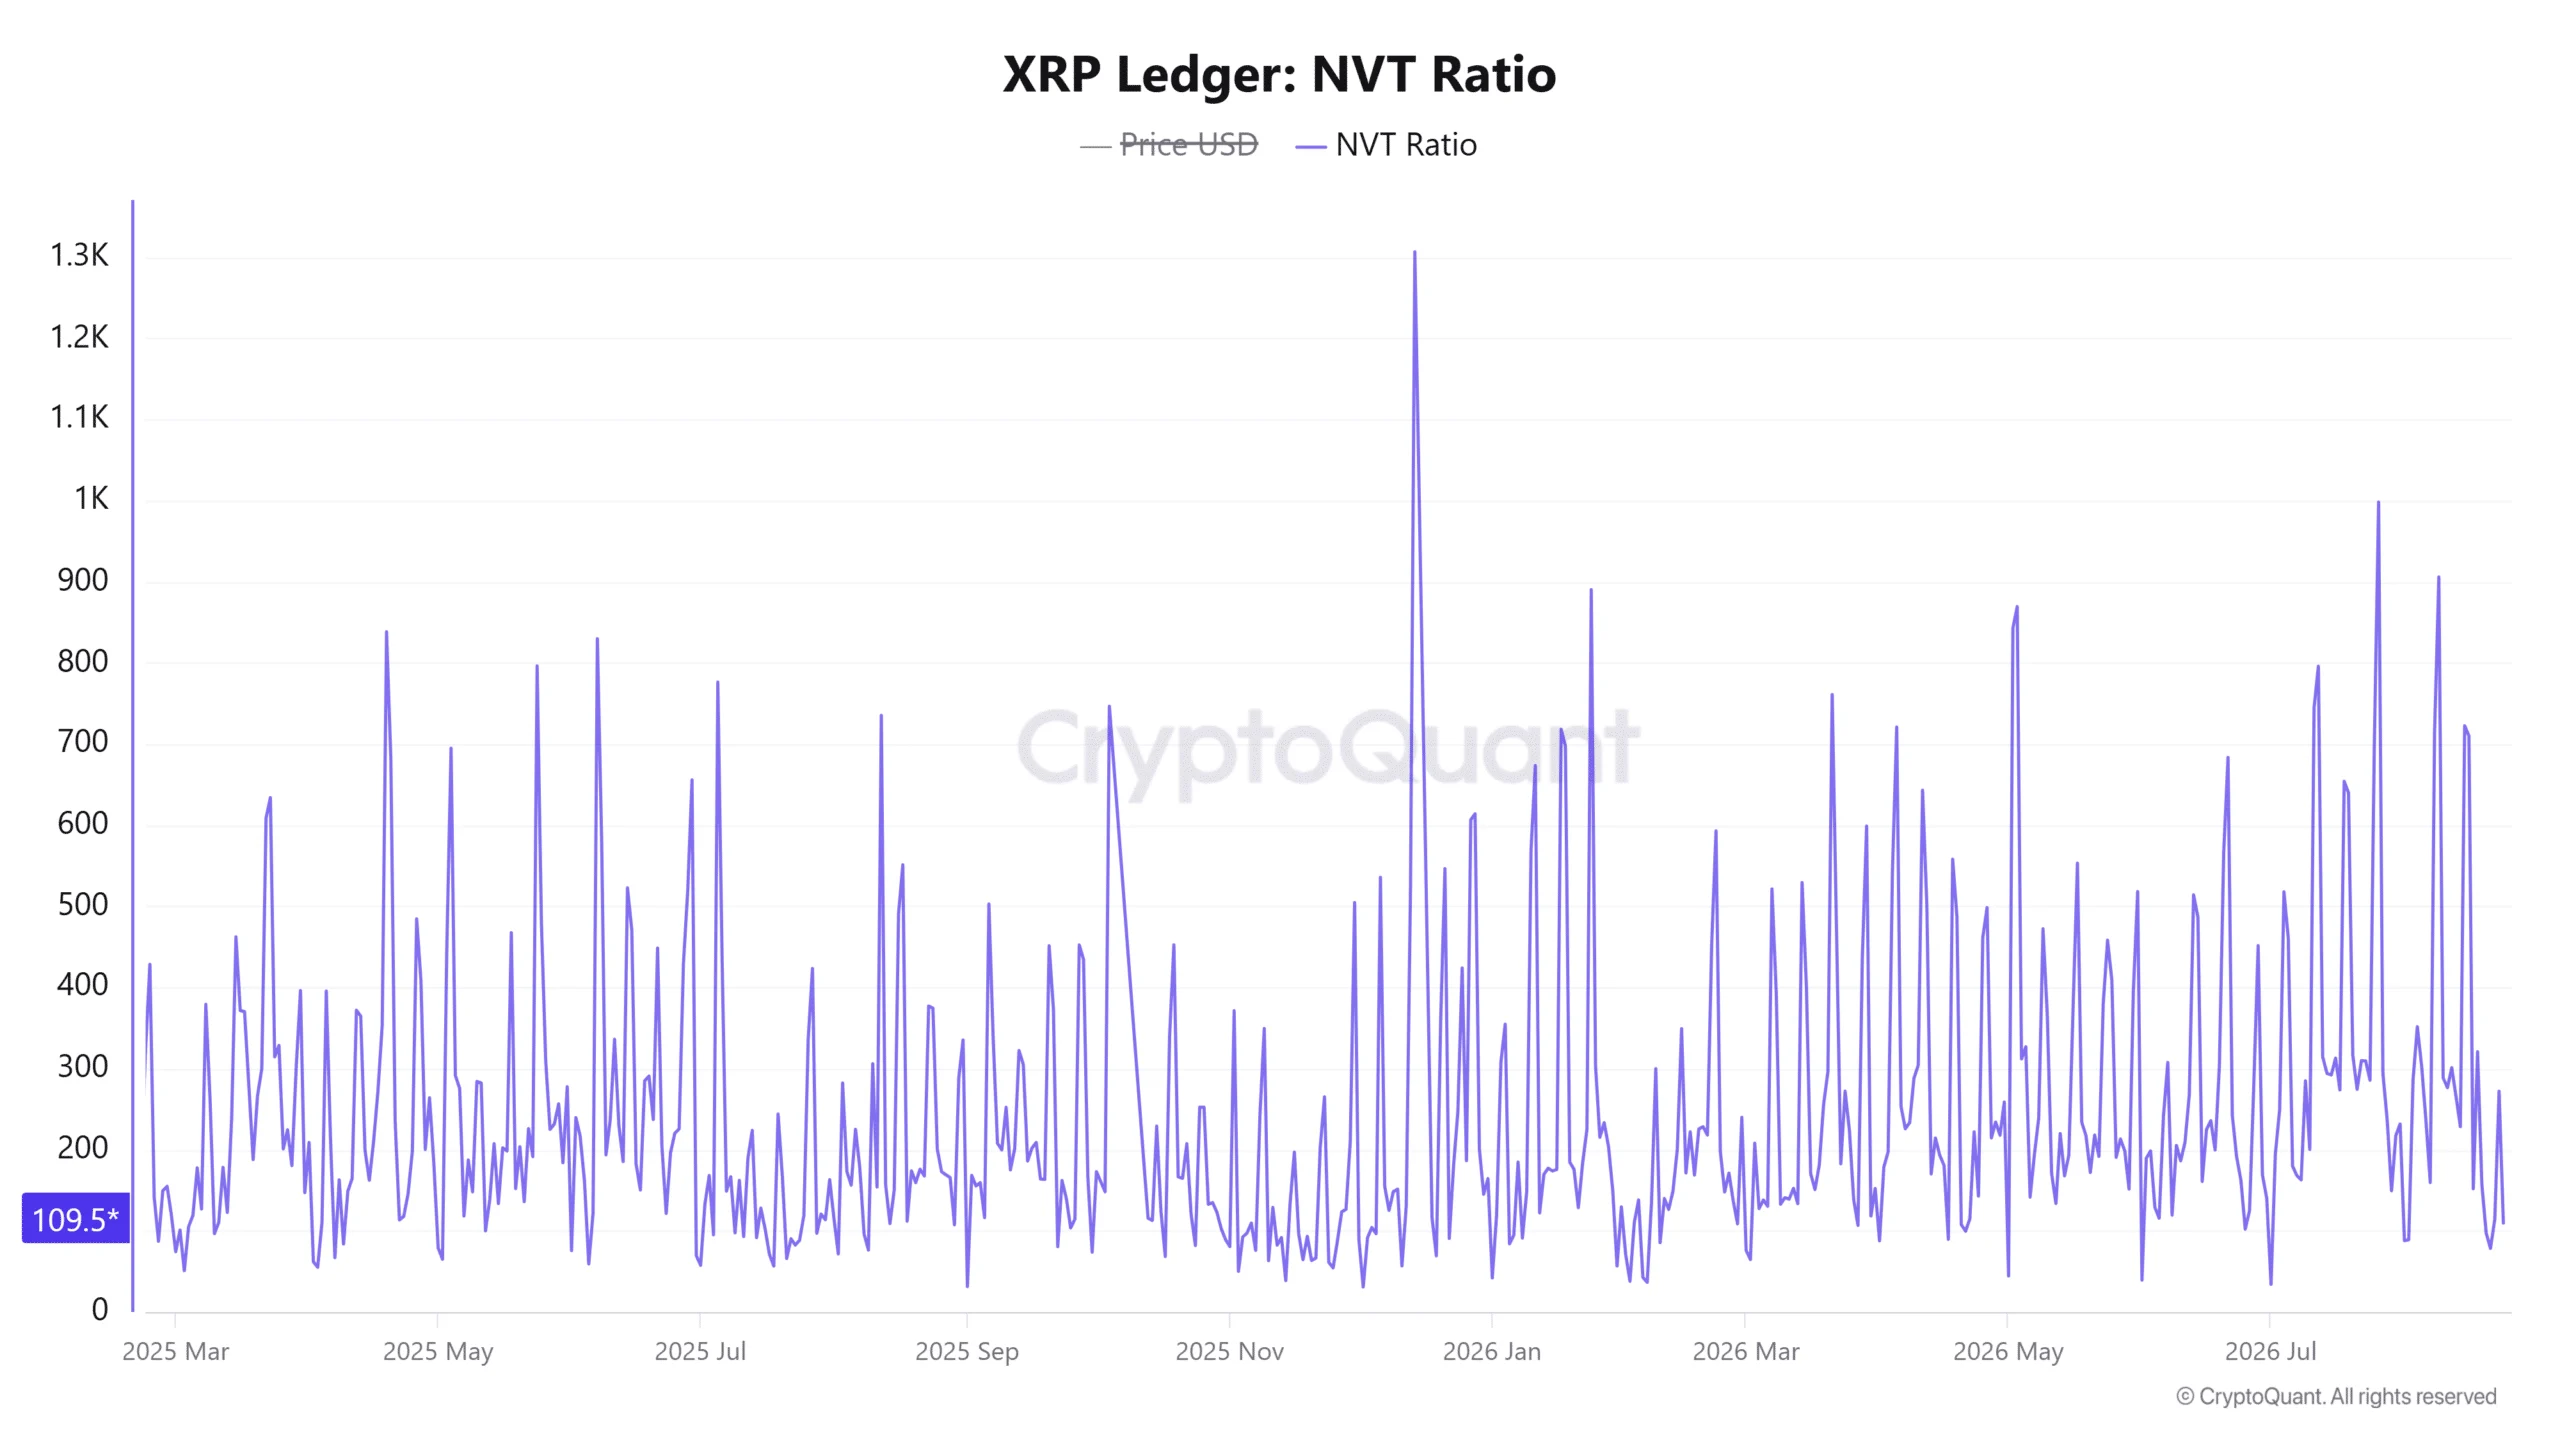
In addition to trader positioning, XRP’s network valuation metric brought an additional positive piece to the positive demand outlook. The NVT ratio dropped 59.72% over 24 hours reaching 109.5728, according to CryptoQuant.

A decline in the NVT tends to indicate that transactions are increasing at a higher rate compared to the network’s value over the observed timeframe. 

In this case, the decline aligned closely with the dramatic increase already recorded across XRP’s active addresses.

Both the metrics pointed toward a stronger network utilization as price recovered, reducing reliance on speculative positioning alone. Importantly, the NVT decline solidified the network image without having to see XRP devalue as activity increases.

However, the ratio remained positive and required continued transaction activity to preserve its improving direction.

Persistent network usage would keep supporting XRP’s valuation backdrop as traders assess whether the recent recovery could extend further.

XRP Ledger NVT Ratio XRP Ledger NVT Ratio
Source: CryptoQuant

Breakout opens the road toward $2

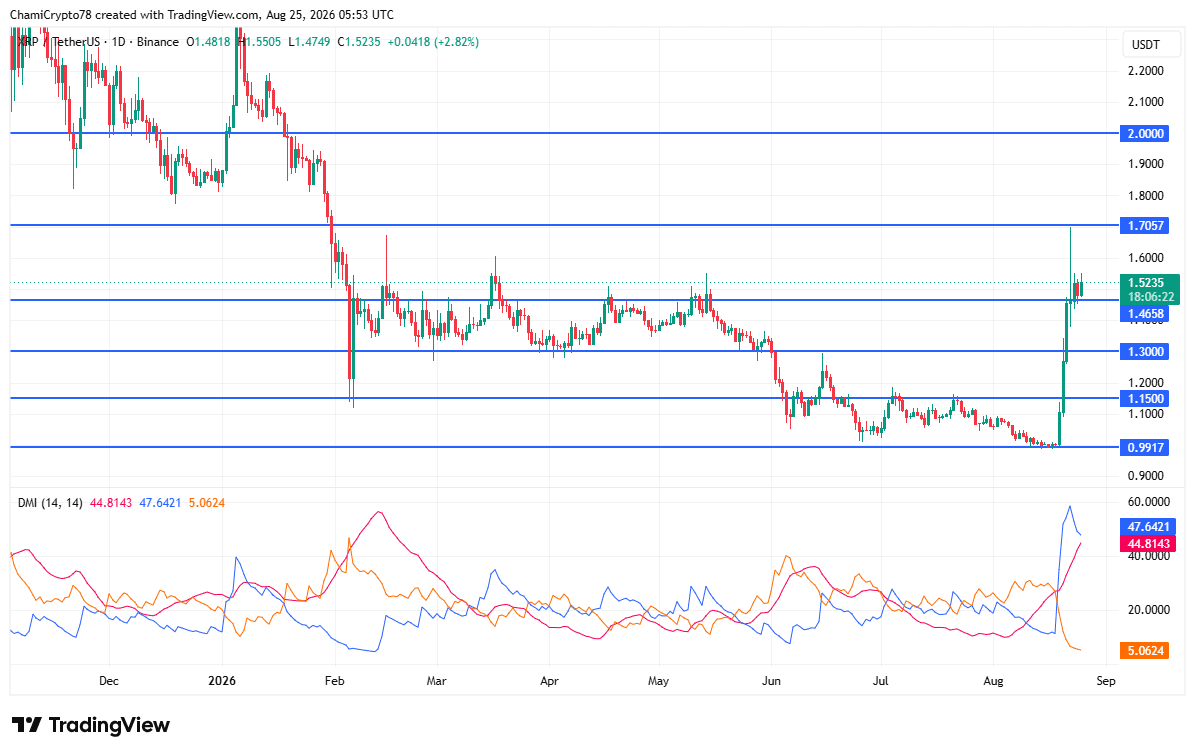
Price action confirmed the breakout by breaking above the important $1.4658 resistance level during XRP’s sharp recovery. 

As of press time, XRP was trading around $1.5235, after briefly touching the $1.7057 resistance level on the daily chart.

Most importantly, the buyers had inverted $1.4658 from overhead resistance to the closest level supporting the breakout structure. The DMI reinforced that price move, with +DI reaching 47.64 while -DI had fallen to 5.06.

Meanwhile, ADX reached 44.81, indicating the directional move had developed considerable strength during the breakout. A successful defense of the $1.4658 support level would keep $1.7057 within reach during another upward attempt.

Failure there would expose the $1.3000 lower support and weaken the breakout despite the strong network and bullish trader positioning. 

However, the current conditions favor another $1.7057 challenge before hitting $2, although buyers would need sustained demand to overcome that resistance.

XRP price actionXRP price action
Source: TradingView

Final Summary

  • XRP’s 654.71% Active Address surge strengthened the network backdrop supporting its recovery.
  • Top traders held a 2.89 Long/Short Ratio, showing strong bullish positioning.


Source link

Cerebras System’s Choppy Year Continues But a Wall Street Pro Forecasts 80% Returns Moving Forward

0
Cerebras System’s Choppy Year Continues But a Wall Street Pro Forecasts 80% Returns Moving Forward


Quick Read

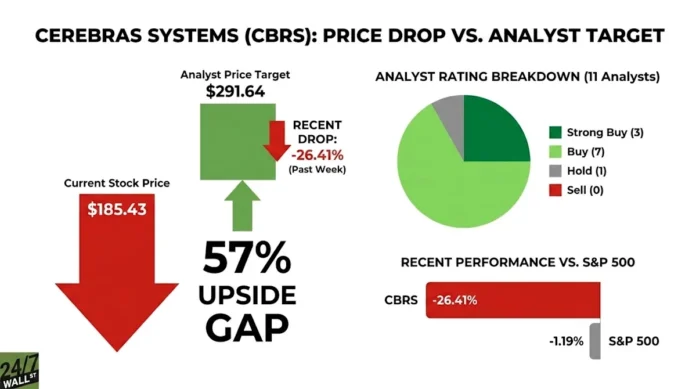
  • CBRS crashed 40% from its May high after Q2 missed estimates, yet 10 of 11 analysts still rate it Buy with a consensus target implying 57% upside.

  • NVDA fell just 7% and AMD dropped 10% over the same stretch, confirming CBRS’s brutal selloff was company-specific, not a sector-wide retreat.

  • A $25 billion backlog anchored by a $20 billion OpenAI deal and plans to triple 2027 revenue form the backbone of the bull case.

  • Act now: the analyst who called NVIDIA in 2010 just named his top 10 AI stocks — and Cerebras Systems Inc. Class A Common Stock didn’t make the cut. Grab the names FREE today.

Cerebras Systems (NASDAQ:CBRS) currently trades near $185.43, while the average Wall Street price target sits at $291.64. That gap implies roughly 57% of upside to consensus.

24/7 Wall St.

Cerebras builds wafer-scale AI systems that sidestep the memory and packaging bottlenecks throttling standard GPU clusters. Its wafer-scale engine architecture avoids HBM memory, CoWoS packaging, and 3nm fabrication, and its customer roster runs through OpenAI, AWS, AMD, and CrowdStrike.

Wall Street expected explosive inference demand post-IPO. Instead, the stock has become one of the choppiest names in AI infrastructure, and that dislocation gives the price-to-target gap real teeth.

An IPO Darling Now Sitting Near Its Debut Price

Shares fell 26.41% in a single week after Q2 2026 results missed expectations. Revenue of $180.11 million fell short of the analyst estimate of $193.55 million, and GAAP EPS of -2.98 came in far below the consensus loss of -0.1801.

The bigger issue was margin guidance. Management guided Q3 core operating margin to negative 25% to negative 23%, down from negative 16% in Q2. On a widely read Reddit thread, traders summed up the reaction as “Cerebras falls 10% after chipmaker forecasts shrinking margin in first earnings report since IPO.”

Shares are now down 40.39% from a May high of $311.07. The move was company-specific. Semiconductors broadly held up over the same window.

Act now: the analyst who called NVIDIA in 2010 just named his top 10 AI stocks — and Cerebras Systems Inc. Class A Common Stock didn’t make the cut. Grab the names FREE today.

UBS Sees 78% Upside From a $330 Street-High Target

Even with shares tumbling, analysts have barely blinked. UBS analyst Timothy Arcuri holds a $330 Street-high 12-month target, implying roughly 78% upside from current levels. His thesis rests on three pillars: the pending launch of Cerebras’s CS-4 wafer-scale platform with orders-of-magnitude higher SRAM memory bandwidth than GPU clusters, hyper-growth revenue anchored by enterprise and hyperscale backlog, and gross margin scaling into the 40%+ range as yields mature.


Source link

I Was Hired to Crack the U.S. Market. I Turned Down the Mission — and Doubled Down on the Market Hiding in Our Data

0
I Was Hired to Crack the U.S. Market. I Turned Down the Mission — and Doubled Down on the Market Hiding in Our Data


Opinions expressed by Entrepreneur contributors are their own.

Key Takeaways

  • Read your own data honestly, then commit before your competitors update their assumptions.
  • The opening is hiding in the data you already have — the winners are the ones who see it and move before anyone else does.

When I was hired as CEO of Builderall, I inherited one mission: crack the U.S. market. The company had originally been built by a Brazilian team, and they believed an American CEO who spoke English without an accent was the missing piece to unlock the biggest market in the world. I took the job. Then I turned down the mission. Instead of pointing the company at the United States, I doubled down on Latin America.

That wasn’t a bet on my instincts. It was a bet on the data, and specifically on the difference between where the opportunity looked like it was and where it actually was. Every entrepreneur today is running some version of that same decision: an industry is shifting under you, AI is rewriting how your customers behave, and you’re being told to chase the market everyone else is chasing. The winners in this cycle will be the ones who look at the ground they’re already standing on, see the opening most people miss and commit to it while everyone else wanders.

If you’re looking to expand, scale into a new market, or find the blue ocean opportunity in your industry, here’s how I’ve learned to find that opening in mine. Four moves, in the order I’ve learned to run them.

1. Read your own data before you chase someone else’s story

You don’t need decades of industry experience to see an opportunity. You need the willingness to look at your own numbers and ask what they’re actually saying, not what you want them to say.

At Builderall, we had a growing U.S. customer base and had never spent a dollar to acquire those users. On the surface, that looked like a green light to invest heavily in the U.S. But when we studied who those American customers were, we found something different. They almost all had Spanish surnames. They clustered in South Florida, Texas and Southern California. They weren’t Americans discovering a Latin American product. They were Latin Americans who had moved north and stayed plugged into the ecosystem back home.

The sign flipped. What looked like early U.S. traction was actually proof that Latin American marketing was already winning U.S. customers as a downstream effect. The right move wasn’t to enter the U.S. It was to go deeper into Latin America, and let the U.S. footprint compound as a byproduct.

The muscle you’re building is asking what your data actually says versus what you wish it would say. Most people project the story they want onto the numbers. The opening tends to be hiding in the story they didn’t expect.

2. Watch for the macro shift that rewrites a market

The richest openings appear right after something fundamental changes. When the ground moves, whoever notices first has a window before everyone else recalibrates.

Years before I joined Builderall, I worked in a role targeting Latin America and the region’s problems were structural. Most people didn’t have bank accounts. Credit cards were rare. Internet access was unreliable. Then a compressed few years rewrote all of it.

According to a 2023 Mastercard study conducted with Americas Market Intelligence, the share of Latin American consumers without an account at any financial institution dropped from 45% in 2019 to 21% in 2023. The World Bank’s Global Findex recorded a 19% jump in financial inclusion across the region between 2017 and 2021, the largest gain anywhere in the world during that window. Internet penetration climbed from 43% in 2012 to 78% in 2022.

It wasn’t the same market anymore. It had quietly become a new one, and most competitors were still running strategies built for the old one. That’s the pattern to look for. Wherever human behavior changes dramatically and quickly, an opening is forming. AI is doing this right now to nearly every industry that touches content, coding or customer support. The job is to notice the shift before your competitors update their assumptions.

3. Refuse to fight the strongest opponent

Once you’ve spotted the opening, the next question is who else is already there and whether you can beat them.

Going after the U.S. market meant going head-to-head with Wix and Squarespace. According to Wix’s 2024 annual report filed with the SEC, Wix alone spent $175.6 million on advertising in 2024. Roughly $14.6 million every month, from one competitor, before you count Squarespace or anyone else with a marketing budget aimed at the same buyer. Meeting that head-on with our resources was never going to work.

In soccer, you don’t try to break the defensive line where it’s thickest. You look for the seam. The goal on the other end is the same regardless of where you cross through. Business is the same. There’s no bonus for beating the strongest defender. There’s only a penalty for trying.

4. Protect your core, and resist adjacency hubris

This is the move most operators get wrong, and the one that quietly undid the U.S. plan for me.

Being excellent at one thing doesn’t guarantee that every adjacent move will work. And the true cost of the new bet is rarely just the money spent pursuing it. It’s the attention, investment and organizational energy pulled away from what made the company excellent in the first place.

Nike is a case study playing out in real time. The company remains the global leader in athletic footwear, but over several years it aggressively prioritized direct-to-consumer sales while reducing its dependence on the wholesale partners that had helped build its reach and cultural relevance. The strategy didn’t fail in isolation. Nike also faced product, competitive and regional challenges during the same period. But the channel shift proved costly. According to Nike’s fiscal 2025 annual report, revenue fell 10% year over year, from $51.4 billion to $46.3 billion, while Nike Direct revenue declined 13%. By mid-2026, the stock had fallen to its lowest level in more than 11 years.

Nike is now working to restore balance. In fiscal 2026, wholesale revenue grew 6% to $27.5 billion, while Nike Direct declined another 6% to $17.7 billion. The company is rebuilding retailer relationships and reinvesting in the broader marketplace it had previously deemphasized.

Even a company as dominant as Nike can’t redirect attention from a core strength without consequences. When evaluating a new opportunity, the honest question isn’t “can we win over there?” It’s “what will pursuing it cause us to neglect here?” When “here” is where more than 90% of your customers, revenue or competitive advantage currently lives, the burden of proof for the adjacent bet should be extremely high.

That was exactly the choice at Builderall. A parallel vertical (the U.S.) versus going deeper into a core (Latin America) where more than 90% of our customer base already lived and where the ground was finally solid enough to compound. I chose depth. Then I chose specific countries inside that continent as beachheads instead of blanketing all of it at once.

Making it real: test wide, commit narrow, let the numbers decide

We didn’t start with Mexico, Colombia and Peru specifically. We blanketed Spanish-speaking Latin America, ran small structured tests across the board and let the strongest markets bubble up from the data.

The mechanics that made this work are simple. Set your guardrails before you enter anything. Define your KPIs. Run small focus-grouped tests. Put a time horizon on the experiment up front so you don’t slide into testing forever.

That last one is where most entrepreneurs get stuck. Between the ages of 18 and 27, I started roughly 22 businesses. Not all of them were serious, but enough of them were that I learned the lesson the hard way: at some point you have to stop ideating and start operating. Testing is a phase, not a lifestyle. If your test is running past its own deadline, either the test is broken or you’re avoiding the decision the test was supposed to make for you.

The way out is to let the numbers be the boss. Set your win metric from your unit economics: what it costs to acquire a customer, what it costs to deliver, what you make. Decide the exact number a market has to hit to count as a win. The moment it hits, the decision is made for you. You’re not the boss. The numbers are.

Macro disruption isn’t going away. The operators who thrive in this cycle will be the ones who read their own data honestly, notice the shift before their competitors do, refuse the fights they can’t win, protect the core they’ve already built, and commit while everyone else is still wandering.

I was hired to chase the crowded market. I went the other direction. That decision has shaped how I think about growth strategy ever since. Find the seam in the line, drive hard into it, and the same logic will work for you.


Key Takeaways

  • Read your own data honestly, then commit before your competitors update their assumptions.
  • The opening is hiding in the data you already have — the winners are the ones who see it and move before anyone else does.

When I was hired as CEO of Builderall, I inherited one mission: crack the U.S. market. The company had originally been built by a Brazilian team, and they believed an American CEO who spoke English without an accent was the missing piece to unlock the biggest market in the world. I took the job. Then I turned down the mission. Instead of pointing the company at the United States, I doubled down on Latin America.

That wasn’t a bet on my instincts. It was a bet on the data, and specifically on the difference between where the opportunity looked like it was and where it actually was. Every entrepreneur today is running some version of that same decision: an industry is shifting under you, AI is rewriting how your customers behave, and you’re being told to chase the market everyone else is chasing. The winners in this cycle will be the ones who look at the ground they’re already standing on, see the opening most people miss and commit to it while everyone else wanders.

If you’re looking to expand, scale into a new market, or find the blue ocean opportunity in your industry, here’s how I’ve learned to find that opening in mine. Four moves, in the order I’ve learned to run them.


Source link

CASHCAT surges 53%, hits a new ATH – Can bulls sustain these massive gains?

0
CASHCAT surges 53%, hits a new ATH - Can bulls sustain these massive gains?


CASHCAT had been on a strong upward momentum. The memecoin reclaimed $0.2 and jumped to a new all time high of $0.237.

As of this writing, CASHCAT was trading around $0.2228, marking a 53% surge on the daily charts. Over the same window, the memecoin’s trading volume climbed 115% to 95.5 million while its market cap rose 53% to $223 million.

The rising volume and market cap indicated strong market participation backed by steady capital inflows. Amid this price surge, holders who have held during difficult times are now enjoying massive profits.

According to Lookonchain, a whale who spent $1.49 million to buy 13.64 million CASHCAT has finally returned to profit.

With the price rising, this whale’s CASHCAT holdings are now worth $2.82 million, sitting on an unrealized profit of $1.3 million.

What’s behind CASHCAT’s ongoing rally?

Amid this market pump, CASHCAT buyers have shown greater determination across the Spot and derivatives markets.

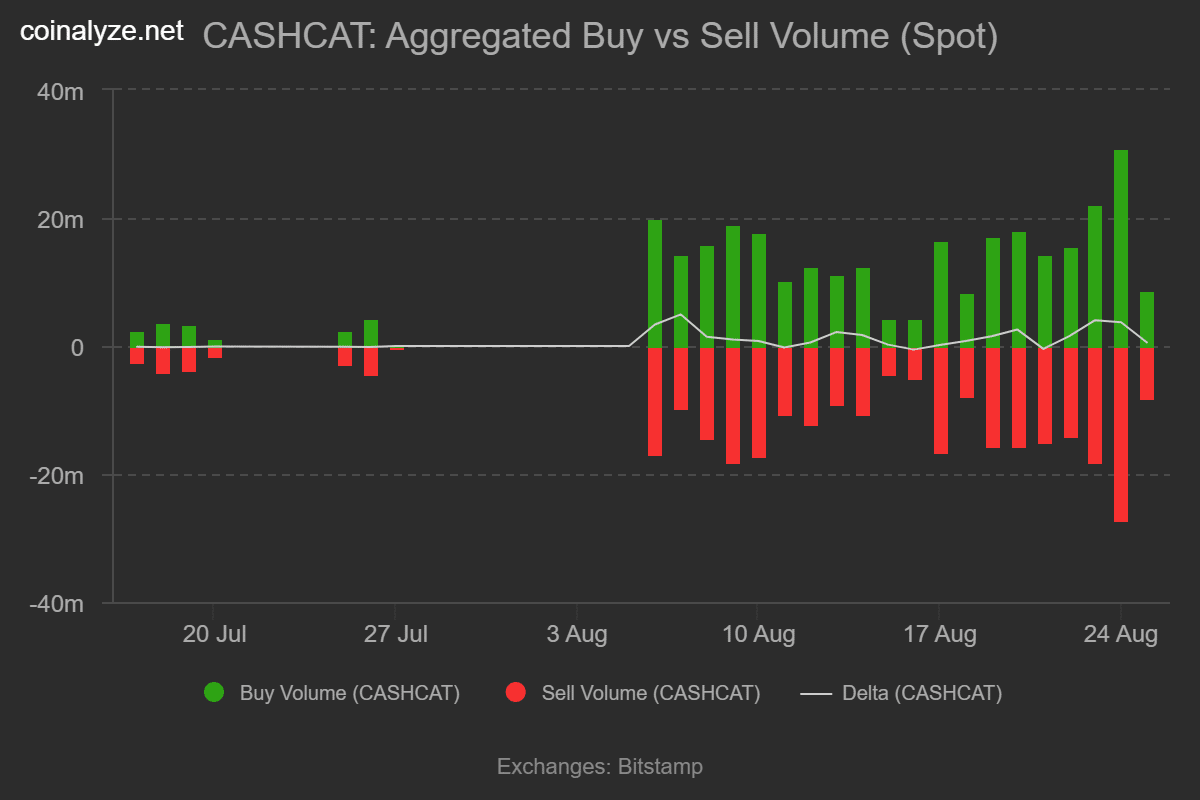
On the Spot side, buyers have dominated the market for four consecutive days. According to Coinalyze data, CASHCAT recorded 39.8 million in buy volume over the past 24 hours compared to 35.3 million.

cashcat_buy_vs_sell_volume_spot
Source: Coinalyze

As a result, the buy-sell delta rose to 4.5 million, a trend that has held for the past few days. On the derivatives side, speculative activity currently remains elevated.

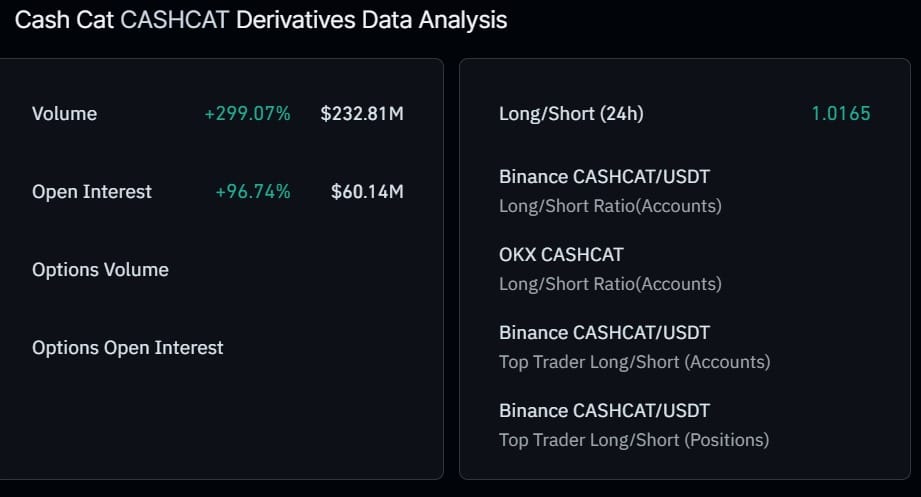
According to CoinGlass data, Open Interest climbed 96.64% to $60.14 million while the derivatives volume rose 299% to $232 million.

CASHCAT derivatives dataCASHCAT derivatives data
Source: CoinGlass

Rising volume and OI in tandem reflect strong market participation, with traders opening new positions.

Meanwhile, the Long/Short Ratio rose above 1 to 1.016. The ratio holding above 1 suggested that traders opened long positions betting for the uptrend to continue.

Historically strong market demand during an uptrend has strengthened the trend and often leads to more gains.

Can the memecoin sustain these gains?

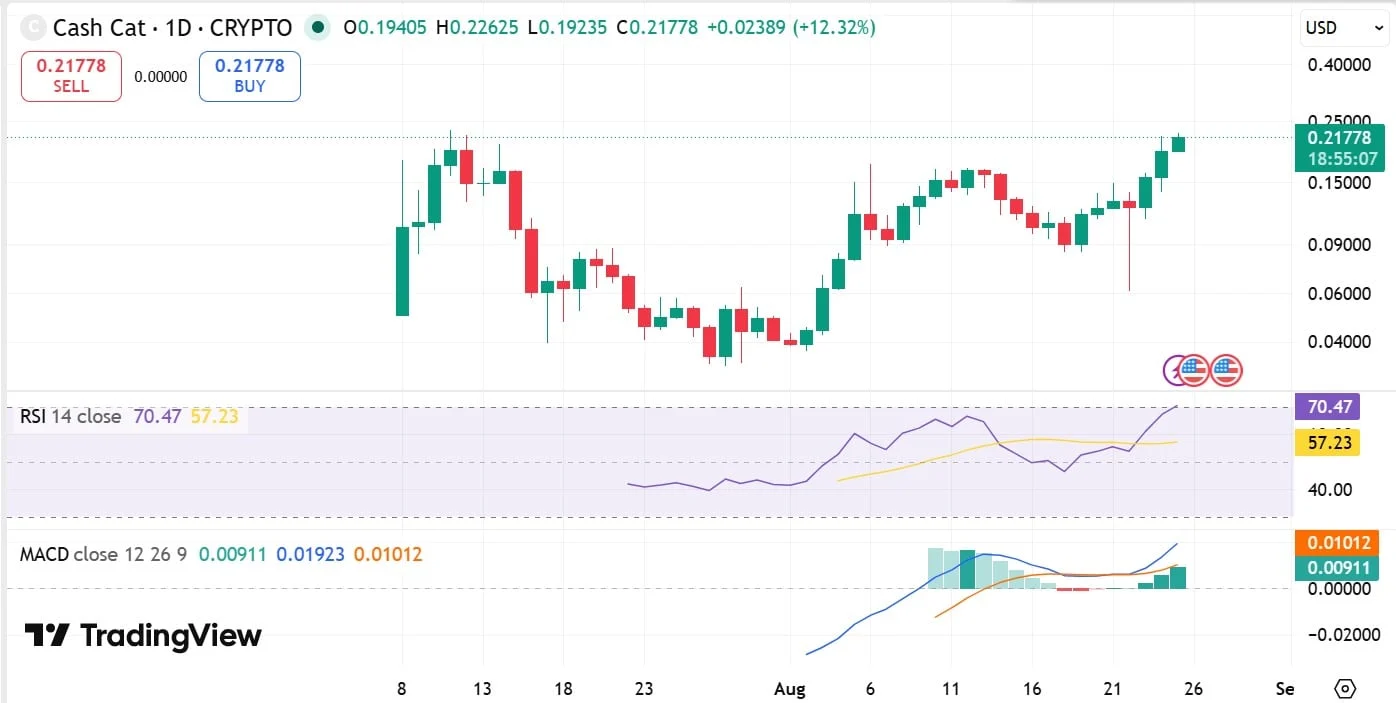
Despite the rising profitability, CASHCAT’s uptrend remains strong. In fact, the memecoin’s Relative Strength Index (RSI) formed a bullish crossover and surged to 71.

At these levels, RSI showed strong buyer dominance. Likewise, the MACD also surged to 0.0096, further confirming this trend strength.

CASHCAT RSI & MACDCASHCAT RSI & MACD
Source: TradingView

Under such circumstances, CASHCAT is well positioned to continue with the trend. If demand holds, the memecoin is likely to flip its ATH at $0.23 and target $0.25 in the short term.

To hold this bullish outlook, the memecoin needs a daily close above $0.22. However, if holders decide to cash out these gains, especially whales with unrealized gains, CASHCAT will drop to $0.16.


Final Summary

  • A whale’s 13.6 million CASHCAT holdings have flipped from losses to profits, rising to $2.82 million, sitting on an unrealized profit of $1.3 million.
  • CASHCAT  cleared the $0.2 resistance and surged 53% to a new all-time high of $0.238


Source link

WAWWA invests in automated fabric cutting to save time and reduce waste

0
WAWWA invests in automated fabric cutting to save time and reduce waste


With this investment, the company aims to address one of its most significant production bottlenecks, as fabric is currently cut by hand and roughly 35% of this process is outsourced.

The new automated fabric spreading and cutting system is expected to save over 90% of the time previously spent on laying and cutting fabric, while almost halving the amount of fabric wasted during production.

This marks the latest phase in WAWWA’s digital transformation, involving £120,000 invested across two related technology projects, supported by £60,000 in grants from Made Smarter North West, a government-backed programme supporting digital adoption among manufacturing small and medium-sized enterprises (SMEs).

WAWWA began working with Made Smarter in 2024 to develop a digital investment roadmap, supported by a £10,000 grant towards a Vetigraph CAD/CAM system that replaced manual pattern processes with digital tools.

The system reduced pattern storage requirements by 90%, cut grading time by 75%, and improved fabric use, allowing the company to increase product variety without adding staff.

Building on this, WAWWA secured a £50,000 grant for an automated fabric spreading and cutting system, following advice from the University of Salford’s Northern Engineering and Robotics Innovation Centre.

The new equipment, integrated with existing software, will streamline workflow from design to cutting and increase in-house production capacity.

Made Smarter’s support also included leadership training and opportunities to trial automated cutting technology with another manufacturer.

WAWWA’s long-term plans involve further integration of digital systems across production and stock management, and an expanded retail presence in Manchester to serve as a model for future growth.

The company is one of over 2,500 manufacturers in the region to have worked with Made Smarter North West, a government-supported initiative that helps SMEs adopt digital technology and boost sustainable growth.

WAWWA production manager Charlie Pyatt said: “Technology has been a big part of the journey, but that’s only one piece of it. Made Smarter gave us the time and support to step back, understand the business better and focus on the changes that would have the biggest impact.

“It’s helped us become better leaders, build relationships with other manufacturers and experts, and given us a roadmap that’s still shaping where we go next.”

“WAWWA invests in automated fabric cutting to save time and reduce waste ” was originally created and published by Just Style, a GlobalData owned brand.


Source link

T. Rowe Price Bets Big on Fixed Income With F/m Deal

0
T. Rowe Price Bets Big on Fixed Income With F/m Deal


Concerned about an AI bubble? Sign up for The Daily Upside for smart and actionable market news, built for investors.

Rowe, rowe, rowe your boat, gently toward fixed income.  

T. Rowe Price will acquire F/m Investments, a fixed income asset manager and exchange-traded fund specialist with about $19 billion under management, according to an announcement on Thursday. The move will expand T. Rowe’s fixed income offerings and is expected to close next year. It’s the second ETF manager acquisition this month, following Goldman Sachs’ announcement that it planned to acquire NEOS Investments, after closing on its acquisition of Innovator Capital Management in April.   

“Overall, [T. Rowe Price is] a massive investment manager, but they’re really heavily weighted on the equities,” said Neil Bathon, a managing partner at FUSE Research Network. The deal “bolsters a fixed income business that needs probably more balance in order to be seen and actually being able to deliver those customized solutions.”

Sign up for The Daily Upside at no cost for premium analysis on all your favorite stocks.

READ ALSO: Why Passive Inflows May be Pulling Down Active Fund Performance and Dimensional, Allspring Latest Firms to Tack on ETF Share Classes

A Rising Tide

F/m was the first firm to offer single-security ETFs, as well as the first to file an application for tokenized ETF shares and to launch mutual fund shares of ETFs. T. Rowe’s distribution capabilities will allow F/m’s funds to scale at a level that they wouldn’t have been able to otherwise, said Alexander Morris, co-founder of F/m. “They always tell you the first billion is the hardest, then it’s the second, the third. Well, turns out it’s still true at the 19th and the 20th,” said Morris. “We didn’t want to just keep growing at a few billion a year. It’s how do we 10x this?”

Here’s the deal by the numbers:

  • It’s expected to increase T. Rowe’s fixed income AUM by about 9%. 

  • However, the deal will more than double the firm’s fixed income ETF assets under management, as well as expand its fixed income SMA business.  

Wave It Off: Despite Goldman’s recent acquisitions, the deal doesn’t signal a larger wave of consolidations, according to both Bathon and Morris. “Consolidation is a story advanced by M&A groups,” said Bathon. “There are as many firms today as there were 20 years ago … This [deal] is opportunistic and strategic, and I don’t know that I think it plays into a broader consolidation theme.”

This post first appeared on The Daily Upside. To receive exclusive news and analysis of the rapidly evolving ETF landscape, built for advisors and capital allocators, subscribe to our free ETF Upside newsletter.


Source link

Bitcoin price reclaims $80K – How Scott Bessent’s $1T liquidity injection fueled BTC

0
Bitcoin price reclaims $80K - How Scott Bessent’s $1T liquidity injection fueled BTC


Bitcoin extended its last week’s winning streak and hit a 3-month high of $81.2K on the 25th of August. 

The ongoing uptrend has been fueled by the renewed debasement trade as U.S. Treasury intervention in the bond market faces backlash and inflation fears. 

Bond market crisis fuels Bitcoin

Notably, BTC began its explosive rebound last week after the Treasury announced a plan to double bond buyback from $4B to $8B. The move seeks to lower the yield (cost of government borrowing) for the 30-year bond below 5%. 

Instead, the 30-year bond yield spiked again and shunned Treasury Secretary Scott Bessent’s plans. 

In response, Bessent said the Treasury could tap into the $1T General Account (TGA) to accelerate the bond buybacks. Spending TGA typically increases the broad money supply and improves liquidity. 

Unfortunately, analysts have slammed Bessent’s intervention methods. Legendary investor Stanley Druckenmiller blasted Bessent, adding that the bond market should freely determine where the yield goes. 

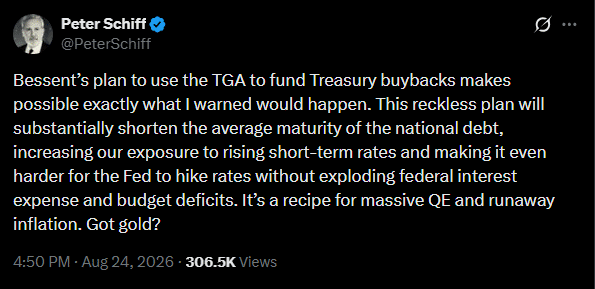
Similarly, Peter Schiff scolded, 

This reckless plan will substantially shorten the average maturity of the national debt…It’s a recipe for massive QE and runaway inflation. Got gold?

Bitcoin
Source: X

Indeed, gold pumped to a 3-month high of $4.6K after the update. And BTC followed the cue. 

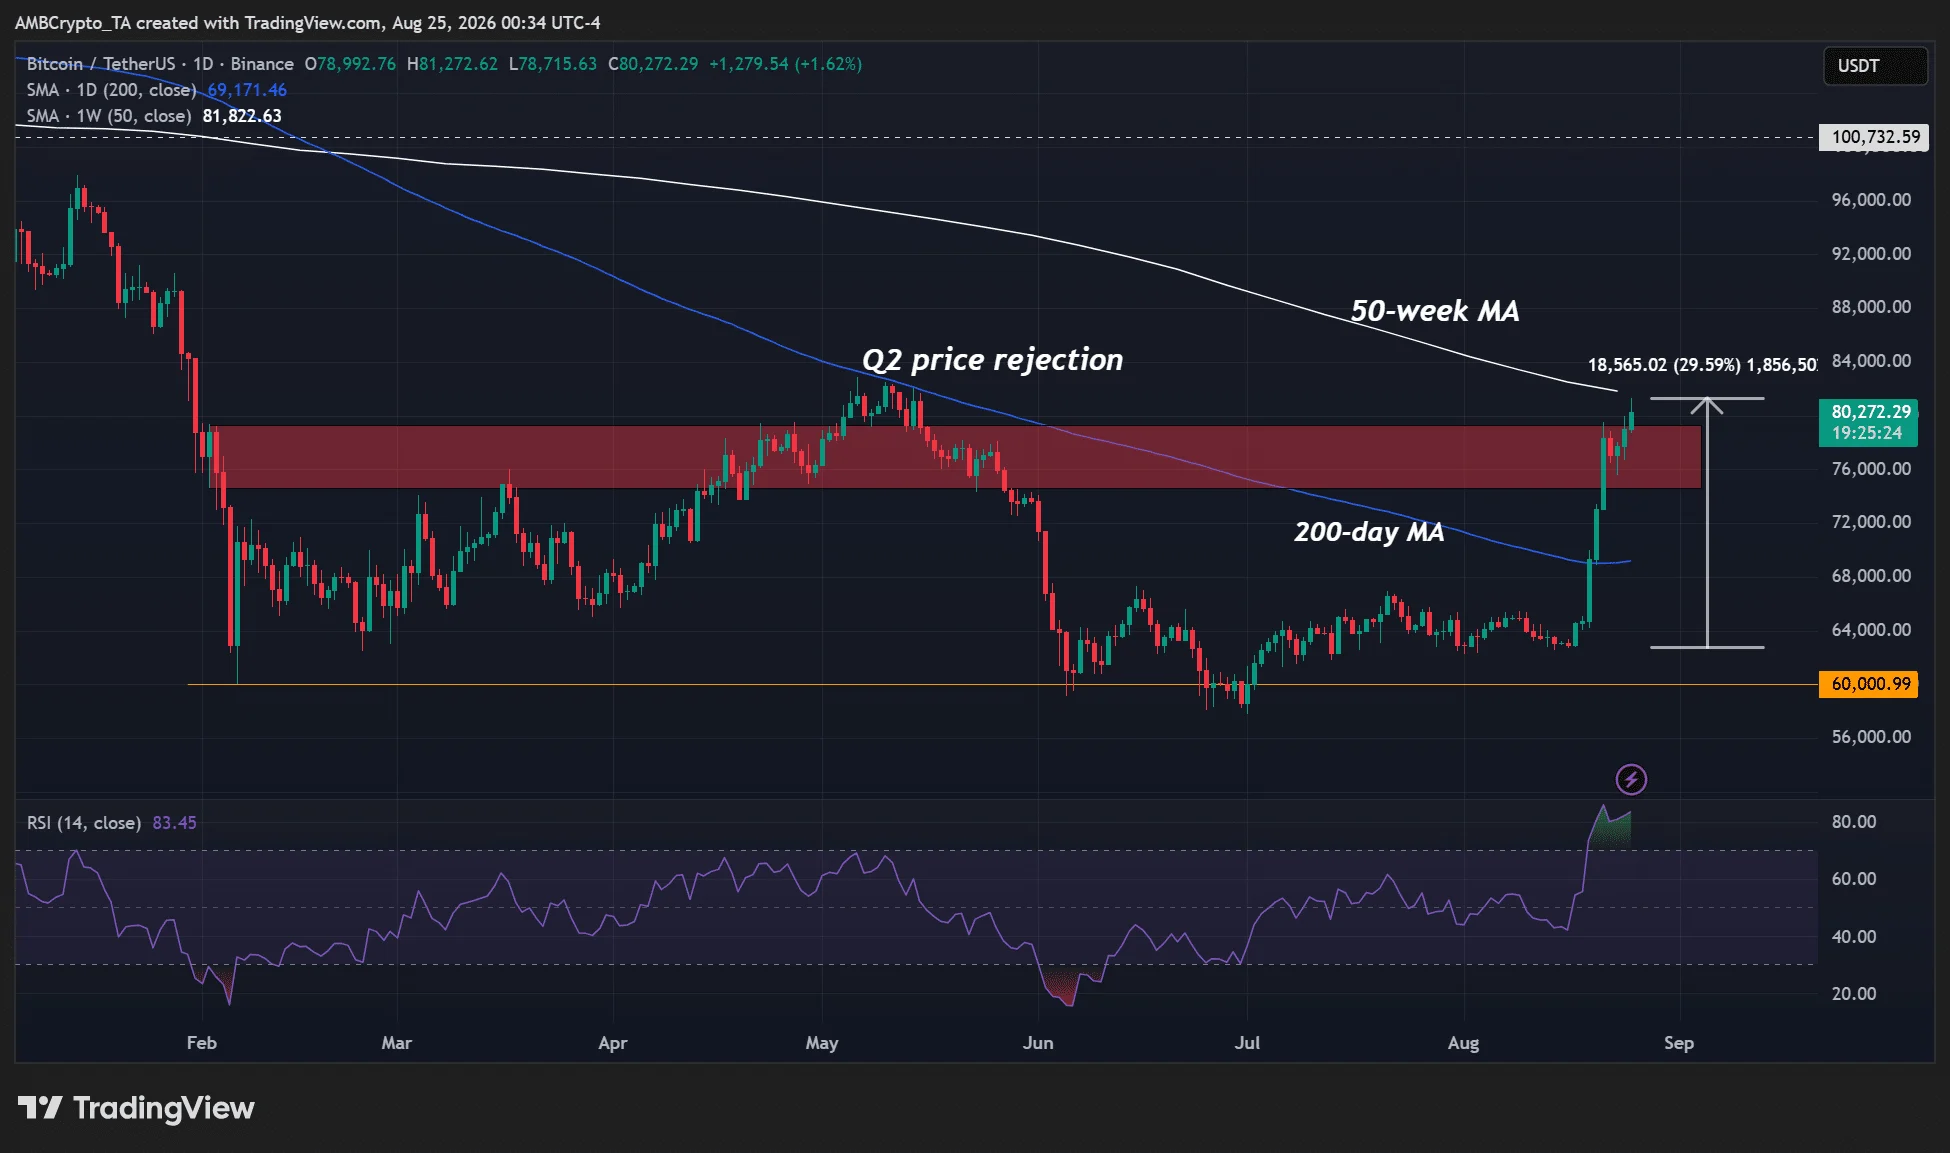
As of this writing, BTC’s price eased to $80.2K slightly but was still shy of the 50-week moving average of $81.8K. Reclaiming this would mark the end of the bear market, according to Galaxy Research. 

Bitcoin Bitcoin
Source: BTC/USDT, TradingView

Fundstrat’s Tom Lee also scored the Treasury’s $1T plan for the bond market as a net positive for the crypto. 

This is positive for long duration assets (anything that investors see a value beyond 7 years): Long duration assets: equities, crypto, gold, real estate.

Is the Bitcoin bear market over?

Worth noting, the renewed debasement trade has also triggered strong U.S. Spot BTC ETF demand. The complex saw nearly $2B in weekly net inflows last week. On Monday, August 24th, they added $337.5M.  

Notably, CryptoQuant data showed that the aggregated BTC demand (apparent demand) has also flipped positive for the first time in August since last November. 

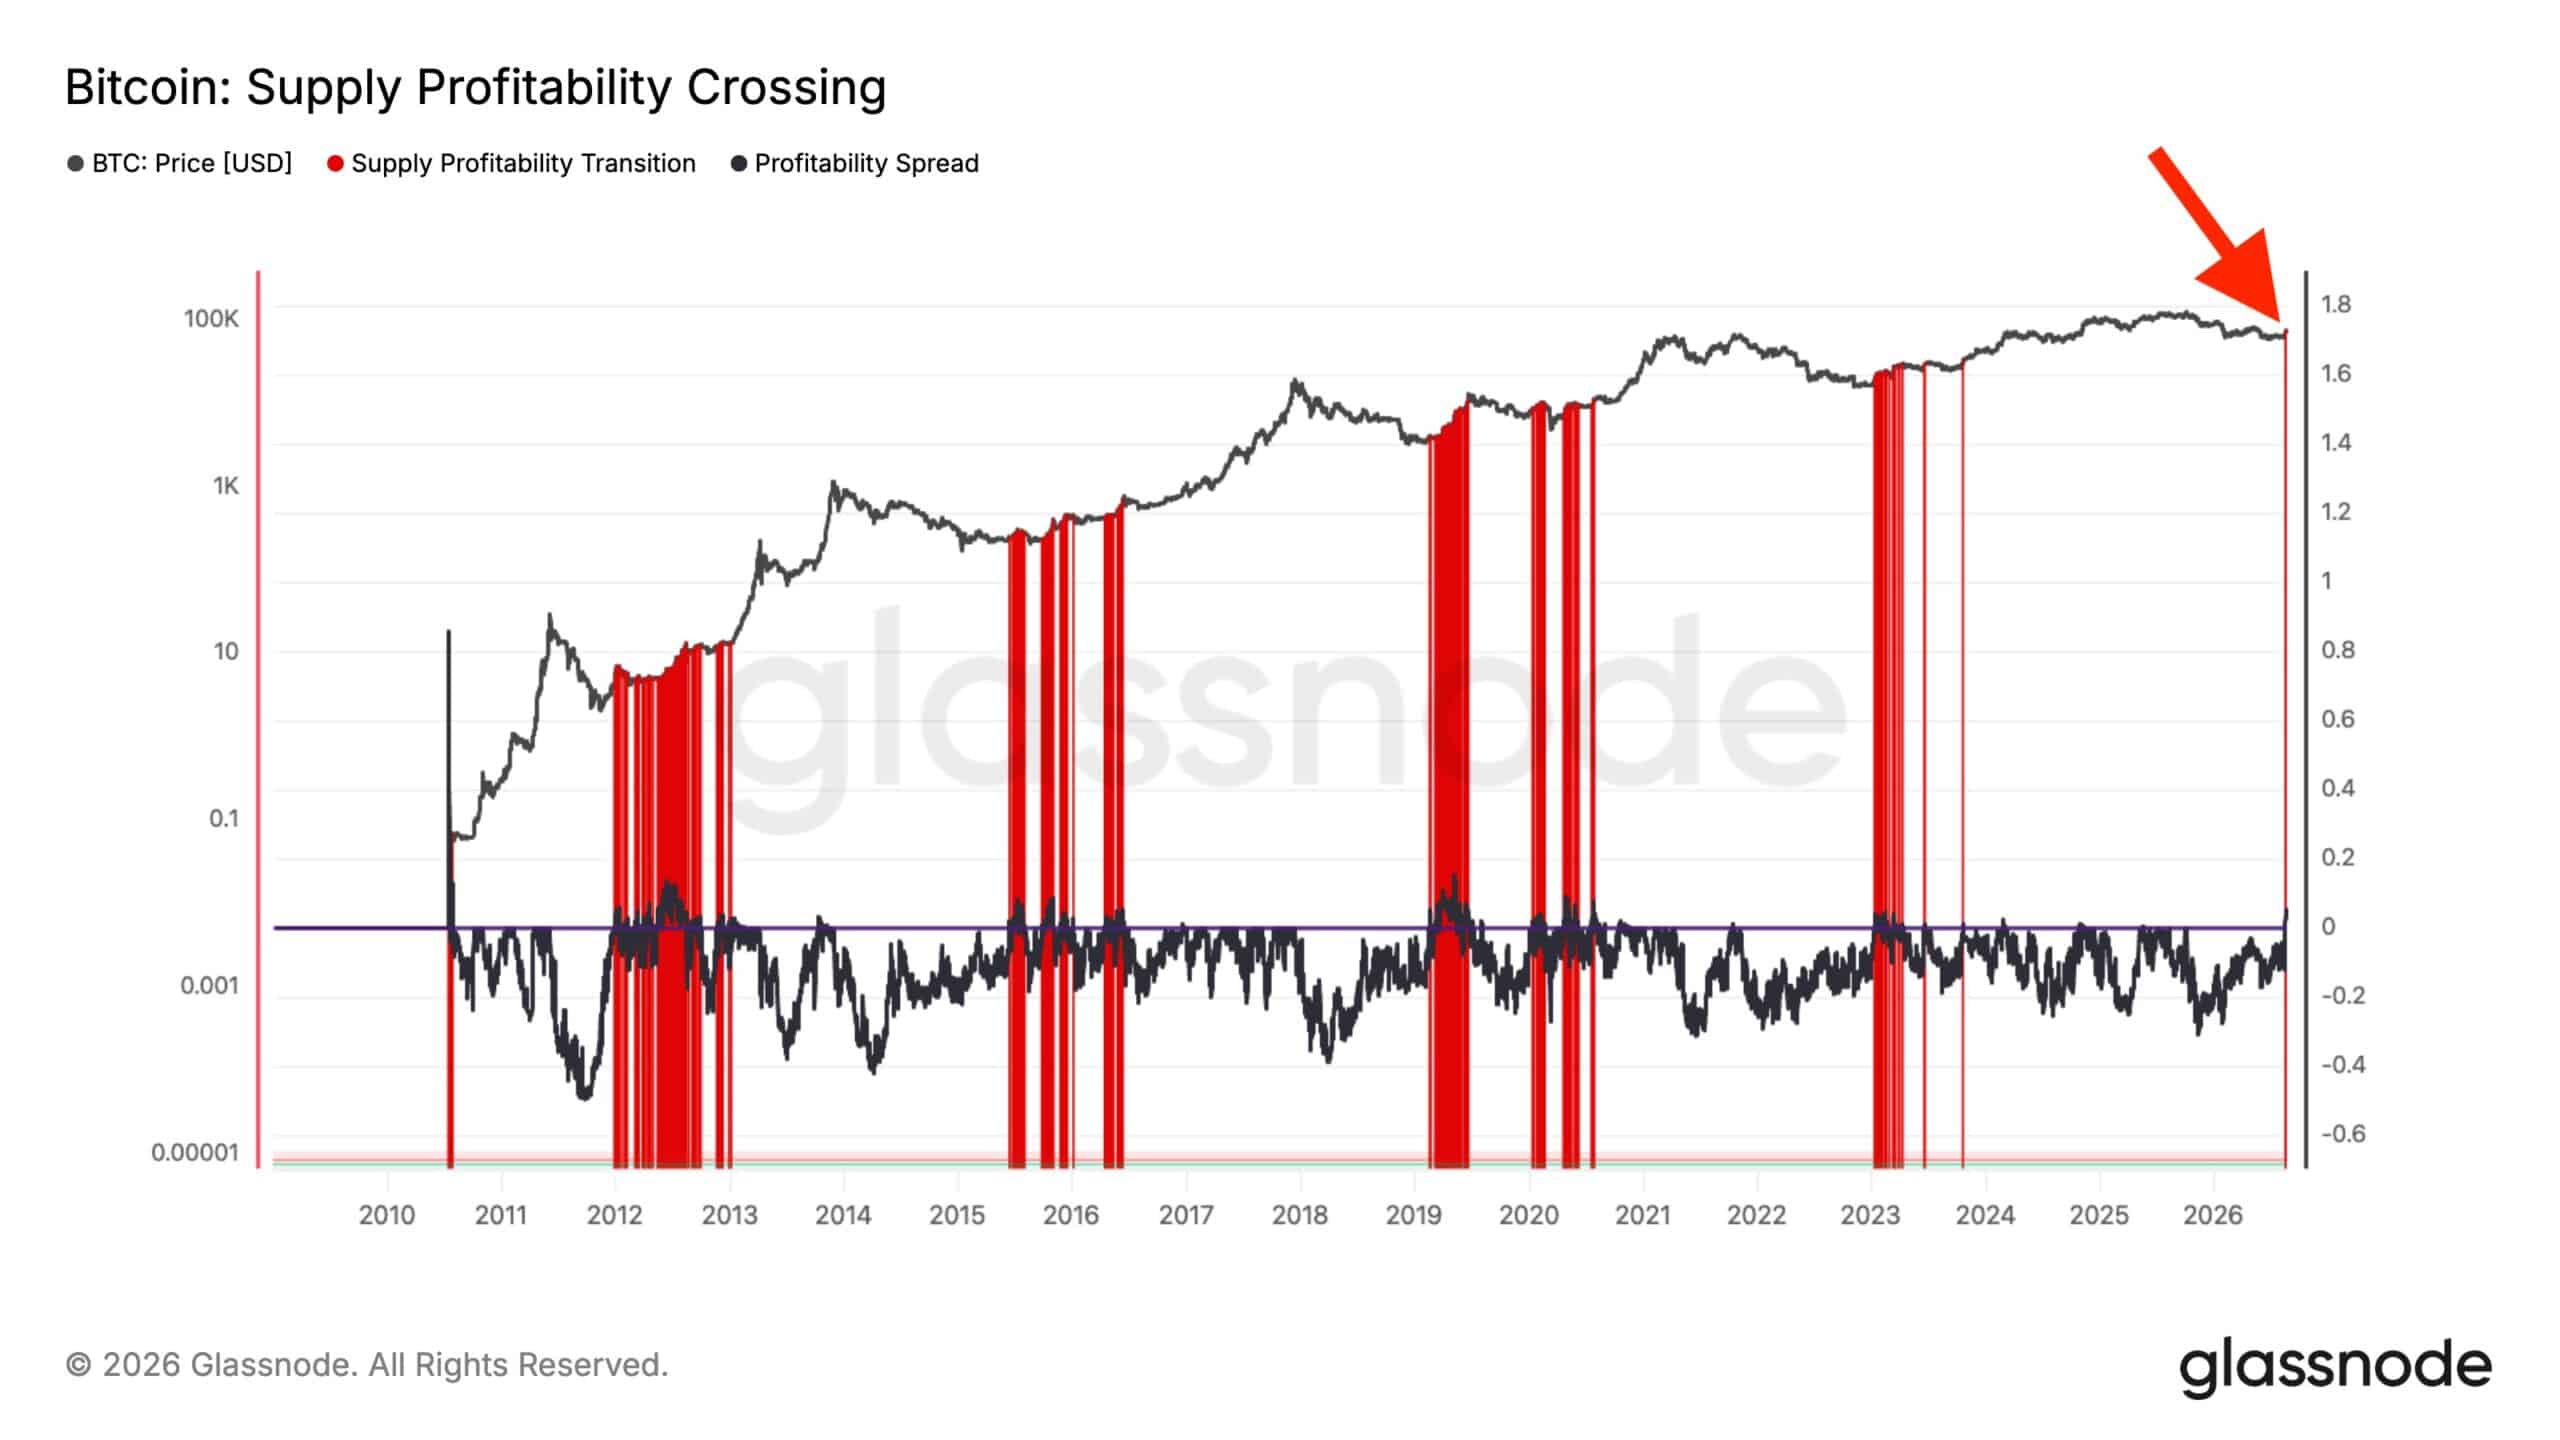
Perhaps the most notable was the firing of a Supply Profitability Crossing signal. The metric tracks bear market recoveries and was last seen in 2023, just before the 2024-2025 bull run began. 

Bitcoin Supply Profitability CrossingBitcoin Supply Profitability Crossing
Source: Glassnode

Historically, Bitcoin [BTC] posted 22%-50% gains in the next 6-12 months after the above metric was triggered. 

That said, BTC must navigate this week’s macro risk events, including Wednesday’s PCE (inflation data) and Nvidia’s earnings report. Additionally, Fed chair Kevin Warsh’s speech at Jackson Hole on Friday could induce market volatility. 

Overall, if the debasement trade holds and BTC decisively reclaims the 50-week MA ($82K), the market could be officially in the early innings of a new bull market. 


Final Summary

  • Bitcoin reclaimed $80K amid the Treasury’s new $1T bond buyback plan.
  • BTC faces market volatility ahead of the PCE report and the Fed’s Warsh speech.


Source link