Michael N. Intrator, Chief Executive Officer and President, sold 13,129 shares of CoreWeave, Inc. (NASDAQ:CRWV) on August 20, 2026, according to an SEC Form 4 filing.
Transaction summary
Transaction value based on SEC Form 4 weighted average sale price ($91.88); post-transaction value based on August 20, 2026 market close ($89.76).
Key questions
What was the nature of this executive disposition? This was a non-discretionary sell-to-cover transaction initiated to meet tax obligations associated with the vesting and settlement of equity awards on August 20, 2026, and does not reflect the insider’s view on the company’s valuation.
How much equity does Michael Intrator retain? Following this transaction, Intrator continues to hold 1,687,129 shares of Class A Common Stock directly and also holds 328,207 derivative securities, including vested and unvested awards.
What is the context of the company’s recent market performance? As of the August 20, 2026 market close, the company has seen a one-year total return of -2%, with a total market cap of $49 billion.
Company Overview
Company Snapshot
CoreWeave operates a specialized cloud computing platform that delivers high-performance GPU and CPU compute resources, storage solutions, advanced networking capabilities, and fully managed services designed to support generative AI and intensive compute workloads for large enterprises.
The company generates revenue through a flexible consumption-based model, offering clients the choice between virtual servers and bare-metal infrastructure, enabling enterprises to scale compute resources according to their specific workload requirements.
CoreWeave serves large enterprises and organizations requiring substantial computational capacity for generative AI applications, machine learning workloads, and data-intensive operations across multiple industry verticals.
CoreWeave has established itself as a critical infrastructure provider in the generative AI ecosystem, with a market cap of $49 billion and trailing 12-month revenue of $7.6 billion. The company’s platform addresses the substantial and growing demand for specialized compute resources required to train and deploy large language models and AI applications.
CoreWeave’s competitive advantage lies in its purpose-built infrastructure optimized for GPU-accelerated workloads, coupled with its flexible service delivery model that enables enterprises to efficiently manage complex computational requirements.
What this transaction means for investors
CoreWeave CEO Michael Intrator’s Aug. 20 sale of company stock is not a red flag for investors. It was a non-discretionary transaction executed to fulfill tax withholding obligations in connection with the vesting of restricted stock units (RSUs).
An RSU is a form of compensation where a company grants an employee shares of stock at a future date. When that vesting date arrives, as was the case here, a “sell to cover” transaction occurs to pay the related taxes.
Post-transaction, Intrator’s stake remains massive. He has nearly 1.7 million directly held shares and another 328,207 RSUs. This ensures his continued alignment with shareholder interests.
CoreWeave stock is down 2% over the trailing 12 months as of Aug. 20, as shares experienced substantial volatility. Thanks to the artificial intelligence boom, the company enjoyed impressive 112% year-over-year growth in second-quarter revenue to $2.6 billion. However, the costs to construct computing infrastructure are high, resulting in a Q2 net loss of $626 million.
Should you buy stock in CoreWeave right now?
Before you buy stock in CoreWeave, consider this:
The Motley Fool Stock Advisor analyst team just identified what they believe are the 10 best stocks for investors to buy now… and CoreWeave wasn’t one of them. The 10 stocks that made the cut are built for long-term growth and could produce monster returns in the coming years.
Consider when Netflix made this list on December 17, 2004… if you invested $1,000 at the time of our recommendation, you’d have $429,223!* Or when Nvidia made this list on April 15, 2005… if you invested $1,000 at the time of our recommendation, you’d have $1,318,055!*
That performance is why people listen. With a track record of beating the S&P 500 by nearly 5x, Stock Advisor offers a distinct advantage. Don’t miss the latest top 10 list, available with Stock Advisor, and join an investing community built for the long haul.
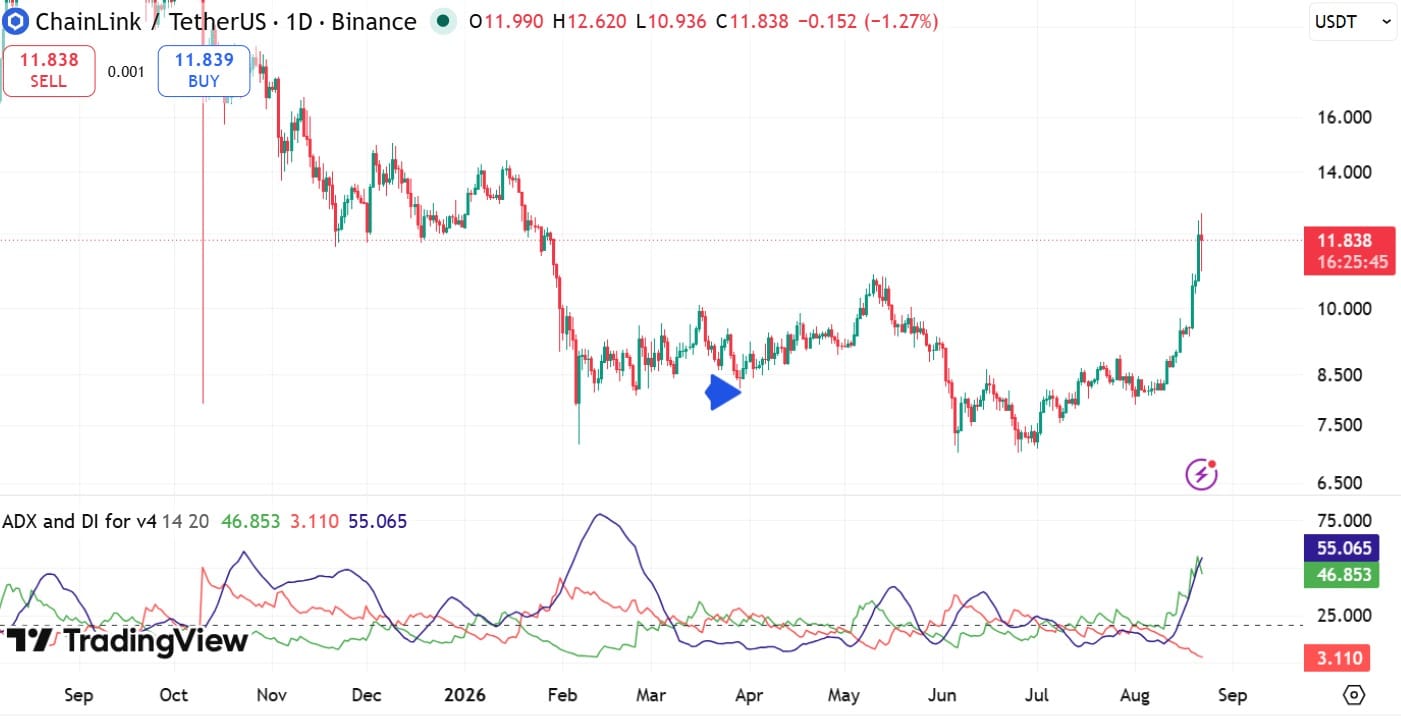
Chainlink [LINK] moved closer to erasing its 2026 losses after reaching $12.60, its highest price in seven months.
However, LINK quickly retraced from that level. At press time, Chainlink traded near $11.76, marking a 1.47% daily gain. Trading Volume climbed 84% to $1.2 billion, reflecting elevated market activity during the volatile move.
Why did Chainlink fall from $12?
Chainlink’s retreat coincided with considerable capital leaving the futures market.
Source: CoinGlass
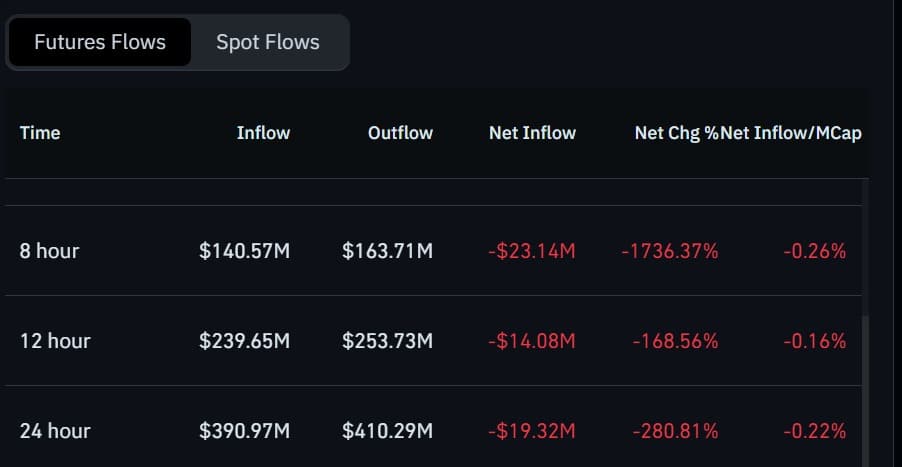
CoinGlass recorded $410.29 million in Futures Outflows, compared with $390.9 million in Futures Inflows.
Consequently, Futures Netflow fell 280% to -$19.3 million. The negative reading showed that more capital exited futures than entered them.
However, Futures Netflow alone could not confirm whether traders closed Long Positions or added selling pressure. While derivatives exposure weakened, institutional demand moved in the opposite direction.
Are Chainlink ETFs buying LINK?
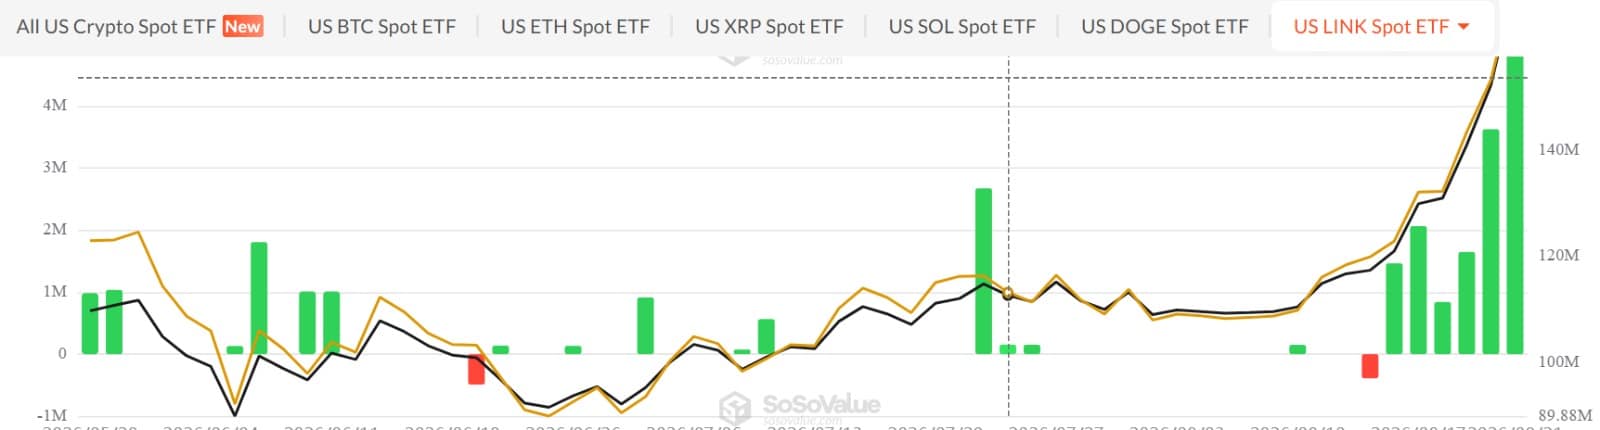
Chainlink Spot ETFs recorded five consecutive days of Net Inflows as LINK approached its seven-month high.
Onchain Lens reported that Grayscale received 132,950 LINK worth $1.53 million from Coinbase Prime. Grayscale was the only Chainlink fund recording Net Inflows that day. Its Daily Net Inflows reached $5.16 million, lifting Cumulative Net Inflows to $109 million.
Source: SoSoValue
The previous day, Bitwise’s Chainlink ETF added 163,379 LINK worth $1.85 million.
These purchases suggested that institutional demand continued despite LINK’s rejection from $12.60. That demand now faces a test from the wider Spot market.
Is Spot demand supporting Chainlink?
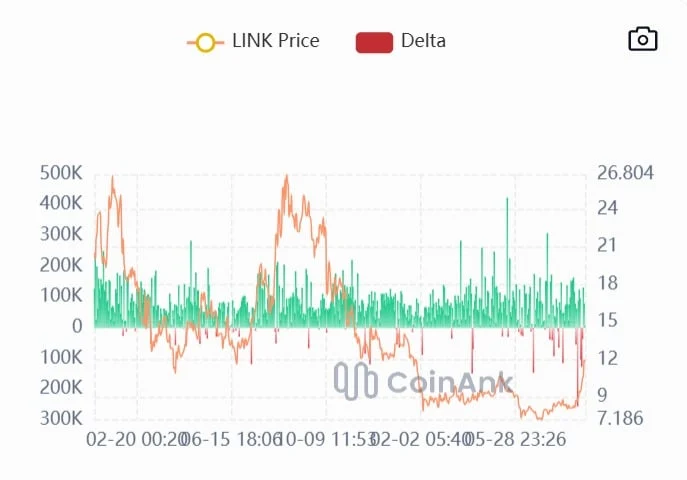
CoinAnk data showed that Market Delta remained positive for three consecutive days.
Source: CoinAnk
At press time, Market Delta stood near 64,000, reflecting stronger Spot buying than selling.
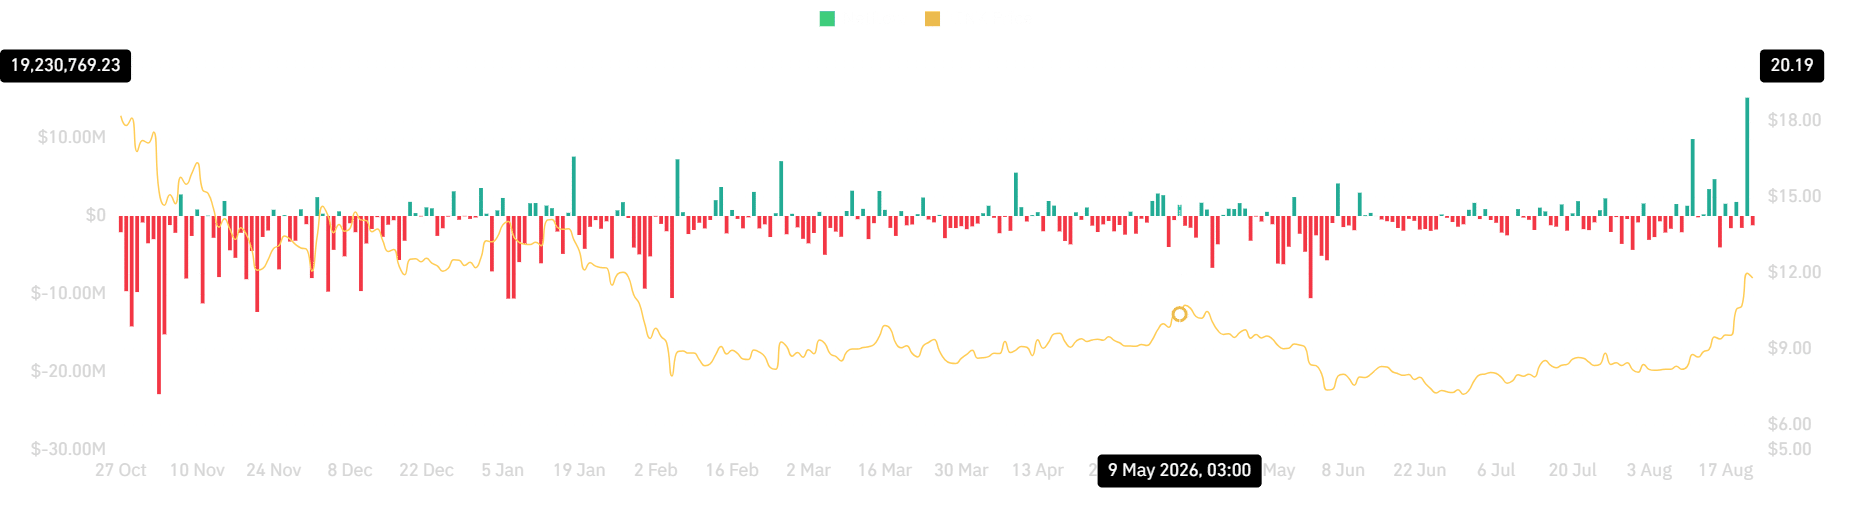
Meanwhile, Spot Netflow turned negative after previously reaching $15 million. That earlier spike coincided with increased profit-taking after LINK crossed $10.
Source: CoinGlass
At press time, Spot Netflow stood near -$1.19 million, indicating that more LINK left exchanges than entered them. This reduced immediate sell-side pressure but did not independently confirm fresh purchases.
Can Chainlink reach $14?
Chainlink’s bullish structure remained intact despite the rejection. The Positive Directional Indicator climbed to 55, while the Negative Directional Indicator fell to 3.
Source: TradingView
A rising Average Directional Index and Positive Directional Indicator reflected a strong prevailing trend.
If institutional and Spot demand continue, Chainlink [LINK] could reclaim $12 before targeting $14. However, continued Futures Outflows could weaken momentum and expose the $10 support.
Final Summary
Chainlink reached a seven-month high of $12.60 before retracing to $11.76.
LINK Trading Volume rose 84% to $1.2 billion during the volatile move.
The latest round of Form 13Fs is out, which means investors can track what billionaire investors are doing. One hedge fund manager I follow is Stephen Mandel, who runs Lone Pine Capital. Mandel has a phenomenal track record, and isn’t just a tech investor; he’s diversified across all sectors.
What makes his latest move in Q2 so significant is that he added a stock to his portfolio that wasn’t there during Q1 and made it his largest overall holding. That’s a major vote of confidence, and clues investors in that they should investigate further.
Missed Nvidia in 2009? This Rare Signal Is Flashing Again. In 2009, a “Double Down” signal flashed for a little-known chipmaker called Nvidia. For the first time in years, that same “Total Conviction” signal is flashing for a company 1/100th the size of Nvidia. Continue »
What is this stock? It’s Nebius (NASDAQ: NBIS). Here’s why he might have bought it.
Image source: Getty Images.
Nebius is one of the fastest-growing stocks on the market
Nebius has had an incredible 2026 and is up nearly 200% this year. It had a major dip at the end of July, but that doesn’t matter.
These filings only include holdings as of June 30, so they wouldn’t reflect whether Mandel bought the July dip, but if he bought in April, he’s still up a lot on his initial investment. Nebius caught fire throughout the summer and emerged as one of the best stock picks of 2026, mainly because of its growth. However, there are plenty of signs that Nebius can continue this for the foreseeable future, making it still a great stock to consider owning.
Nebius operates in the neocloud space and is an AI-focused cloud computing provider. Right now, there is a major shortage of AI computing power, and any company that has access to computing capacity is in a great spot. To sweeten the deal, Nebius is a preferred partner of Nvidia and gains early access to cutting-edge technology. This makes it a top provider to consider, as Nebius will always have the latest and greatest products.
Nebius has signed deals with several of the major AI hyperscalers to rent them computing power, and this is leading to jaw-dropping growth. In Q2, Nebius grew revenue by 454% year over year. That number wasn’t boosted by an acquisition or one-time effect; that’s real growth coming from rapidly expanding its computing capacity. It’s also not a one-off quarter, either. Analysts expect 523% growth for the second half of 2026 and 258% growth for 2027. With AI computing demand only expected to increase, this makes Nebius one of the best options in terms of pure growth in the AI space.
Although Nebius’ stock has about tripled in 2026, I still think it’s a phenomenal investment to make, and you should consider following billionaire Stephen Mandel’s lead and purchasing shares.
Should you buy stock in Nebius Group right now?
Before you buy stock in Nebius Group, consider this:
The Motley Fool Stock Advisor analyst team just identified what they believe are the 10 best stocks for investors to buy now… and Nebius Group wasn’t one of them. The 10 stocks that made the cut are built for long-term growth and could produce monster returns in the coming years.
Consider when Netflix made this list on December 17, 2004… if you invested $1,000 at the time of our recommendation, you’d have $429,223!* Or when Nvidia made this list on April 15, 2005… if you invested $1,000 at the time of our recommendation, you’d have $1,318,055!*
That performance is why people listen. With a track record of beating the S&P 500 by nearly 5x, Stock Advisor offers a distinct advantage. Don’t miss the latest top 10 list, available with Stock Advisor, and join an investing community built for the long haul.
Keithen Drury has positions in Nebius Group and Nvidia. The Motley Fool has positions in and recommends Nvidia. The Motley Fool has a disclosure policy.
This story was originally published on CRE Daily. Join 70,000+ commercial real estate professionals getting daily news, market insights, and industry analysis delivered straight to their inbox with the free CRE Daily newsletter.
Key Takeaways
More than 2,600 conduit and SBLL CMBS loans mature within nine months, carrying a balance above $100B.
Multifamily shows a 7.5% distress rate in the pool, above retail at 3.5% and hotel at 4.4%.
Mixed-use, retail and office loans face resets of roughly 172 to 178 bps, even where loans look clean.
More than 2,600 conduit and SBLL CMBS loans mature over the next nine months. Their combined outstanding balance tops $100B. The balance-weighted distress rate across that pool is 5.55%, according to CRED iQ. That average conceals more than it reveals.
Multifamily Breaks Its Safer Asset Reputation
Office carries the highest distress rate of any major property type in the maturing pool, at 9.4% on $23.86B. That much is expected. Multifamily is the surprise. At $5.01B of maturing balance, it shows a 7.5% distress rate. That sits above retail at 3.5% and hotel at 4.4%. Multifamily is conventionally treated as the safer bet, especially against retail’s long-running death of the mall narrative. In this cohort, the ranking flips.
The Details
Distress rates describe what has already gone wrong. The refinancing math describes what is coming. Loans maturing in this window carry an average note rate of 5.44%. Loans originated between May and August of this year priced at a loan-weighted 6.58%. That is a gap of roughly 114 bps. It applies whether or not a loan is flagged as distressed. Mixed-use faces the widest reset at 178 bps, followed by retail at 173 bps and office at 172 bps. Hotel faces the smallest gap at 32 bps, since those loans already priced close to today’s market.
A Wall Concentrated in Gateway Markets
Just 10 of the 371 metro areas in the data account for 57.8% of the full $87.8B balance. New York, Newark and Jersey City alone represent $15.87B, or 18.1% of the national total. Los Angeles follows at $7.81B and San Francisco at $4.70B. Individual loans are large enough to move those numbers on their own. A single Honolulu retail property carries a $1.73B loan maturing in June 2027, the largest in the entire wall. A $1.69B office loan on Binney Street in Cambridge matures in May 2027.
Why It Matters
Shadow distress is the real exposure this data surfaces. A performing loan can still face a materially higher payment after refinancing. That pressure matters as AI-driven leasing reshapes major technology office markets and strengthens demand for high-quality space.
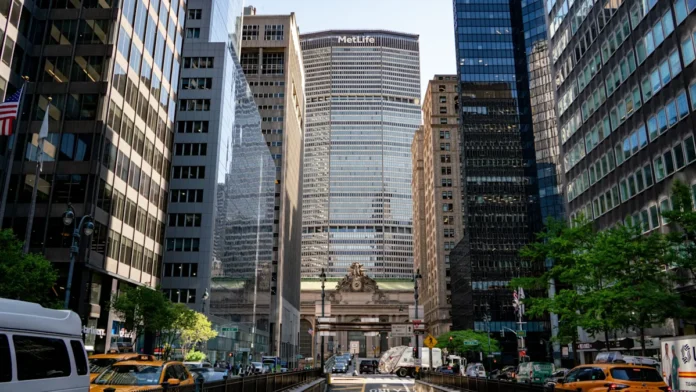
Three New York trophy office towers show the spread of outcomes. 1290 Avenue of the Americas has $673M maturing in November 2026. 1095 Avenue of the Americas has $544M due in February 2027. 280 Park Avenue has $430M due in September 2026 and is already showing real strain. Its Sixth Avenue counterparts are considered comfortable performers today.
What’s Next
January 2027 is the month to watch. Its distressed balance sits across four office loans in four separate gateway metros. New York, Washington, Seattle and San Francisco are all stressed in the same 30-day window. September 2026 shows a different pattern. A lodging portfolio and a Chicago office loan are fully distressed there. A $699.7M New York office loan is only 10.4% distressed, yet contributes more dollars by size. Size and distress rate both do real work in these totals.
Bill Marler’s business is booming — and that’s not great for the rest of us.
Marler is a food safety lawyer, defending people who’ve been sickened by foodborne illness. He has been doing this for 33 years, with such high-profile wins that he’s become a towering figure in the food safety world.
This year, he’s so slammed with foodborne-illness cases that, for the first time in years, he’s expanding his team — hiring another lawyer and a couple of paralegals. “We just have too much shit to do,” Marler said.
This summer alone, Americans have been warned about a massive Cyclospora outbreak linked to iceberg lettuce — 10,930 confirmed illnesses, 454 hospitalizations, and two deaths — plus Salmonella in jalapeños and eggs and E. coli in frozen blueberries. Then there are the recalls: bread that may contain metal fragments, fruit bars that may contain glass, and foods pulled for possible bacterial contamination or undeclared allergens.
By August, the FDA’s 2026 public health advisories had covered what felt like everything, from cheese to infant formula.
“As a consumer, you’re looking at this like, well, what the hell’s safe to eat?” Marler said.
America is having a headline-grabbing food-safety summer. Some of that is perception: We’re better at finding outbreaks, and recall counts can be misleading.
But long-standing vulnerabilities in our food system — compounded by cuts to the public health infrastructure designed to catch problems — are also at play. Whether it represents something more significant is harder to say.
“It’s real, and it looks bad,” Marler said.
Recall counts can be misleading
This summer looks more exceptional than it actually is, said Craig Hedberg, a professor and foodborne-disease epidemiologist at the University of Minnesota.
“Certainly the magnitude of the cyclospora outbreak is unprecedented, but in terms of all of the things that are going on with food, it’s not all that unusual,” Hedberg said.
Summer is typically a busy season for foodborne illness, he said, and outbreaks involving foods like sprouts, berries, and produce recur year after year. What’s truly extraordinary in 2026 is cyclospora — “an order of magnitude bigger than anything we’ve seen in previous years.”
Berry recalls are not uncommon in summer.
FlorianTM/Getty Images
Recall counts can also exaggerate the number of distinct problems. Jennifer McEntire, founder of Food Safety Strategy, a consulting firm that works with industry groups, pointed out that when a single contaminated ingredient is used in many foods, each finished product may trigger its own recall.
“This makes the recall numbers look high, even though the number of ‘root causes’ may be much lower,” McEntire said.
Take California Dairies, which recalled certain bulk batches of powdered milk and buttermilk in April due to potential Salmonella contamination. These products had been sold to wholesale distributors and manufacturers, triggering downstream recalls.
That meant the recall rippled across the sector, with over a dozen products pulled from shelves — from potato chips to ranch seasoning.
We’re finding issues we couldn’t find before
There’s another reason today’s food-safety problems may be more visible: We’re better at finding them.
E. coli and Salmonella can be grown and tested in a lab, making it easier to connect the dots between illnesses.
Anchalee Phanmaha/Getty Images
“We clearly have better tools and are using them more effectively to identify outbreaks,” Hedberg said.
In the last five to 10 years, public health laboratories have increasingly used whole-genome sequencing to link seemingly isolated Salmonella or E. coli cases by their genetic fingerprints.
That means some of what appears to be an increase in foodborne illness is actually better surveillance. “We’re finding ones that may have been missed previously,” said Melanie Firestone, an epidemiologist at the University of Minnesota, who studies foodborne-disease surveillance.
Those tools, however, aren’t as readily available for Cyclospora, in part because the parasite can’t be grown in a lab; investigators rely more heavily on finding common exposures among sick people.
Our food system has changed — and one mistake can go a very long way
The food system itself has also transformed. Americans can now buy fresh produce year-round, including fruits and vegetables.
“Foods don’t go out of season. We just go to the season where they’re being produced, and we bring them in,” Hedberg said.
Still, a food system optimized for year-round availability, convenience, long supply chains, and massive distribution networks can also amplify failures.
Lettuce grown in Mexico can be sold in US grocery stores.
Bloomberg/Getty Images
Marler points to the massive 2006 E. coli outbreak linked to bagged spinach, a crisis so consequential that he said the leafy-greens industry came to refer to it as its “9/11.”
Investigators traced the spinach to a single 20-acre farm that had a wild-pig invasion. Not every crop was infected, but harvesting and processing allowed it to spread. The bags were then shipped around the country, turning what Marler argued might once have been scattered illnesses into a national outbreak.
Ultimately, when something does go wrong, the modern food system can make it go spectacularly wrong.
“The reality is that with a lot of our fresh produce, once contamination occurs, we have limited ability to decontaminate the produce items,” Hedberg said.
Parts of our safety net weakened
One explanation for the increased number of headlines about food safety has loomed particularly large this summer: the Trump administration’s DOGE cuts.
Elon Musk spearheaded the cost-saving DOGE efforts. Cuts impacted health agencies.
Samuel Corum/Getty Images
In 2025, the administration cut thousands of jobs across federal health agencies and billions of dollars in grants to state and local health departments.
Those cuts landed on a public-health system that was already stretched. “Our public health systems have been chronically underfunded for a long time, and we’re seeing that worsen,” Firestone said.
In a statement, the FDA said that “frontline FDA investigators are critical to the FDA’s mission and were exempt from past workforce reductions.”
The agency said that while there are more foodborne illness clusters in 2026 than in previous years, it is “constantly working to improve laboratory detection of foodborne illness,” such as Cyclospora. “Still, Cyclosporaremains a challenging agent and epidemiology, and traceback are key elements of an outbreak investigation.”
Food safety cuts predate the Trump administration. In 2012, under the Obama administration, the USDA’s Microbiological Data Program ended after its funding was eliminated. The program had sampled and tested selected fruits and vegetables for foodborne pathogens, reporting its findings to federal and state public health agencies — proactive surveillance, rather than waiting for reports of infections to crop up.
Some food-safety hazards, Hedberg said, are well understood and “just require constant attention on the part of producers to be able to prevent.”
So, should I be scared of my groceries?
Hedberg doesn’t think this summer should change the way Americans eat. “Most of the food moving through the system is free of contamination,” he said.
Fresh produce remains an important part of a healthy diet, and he cautioned against allowing a single enormous outbreak to distort our sense of risk.
Don’t be scared of healthy eating!
Oleg Breslavtsev/Getty Images
That doesn’t mean accepting outbreaks as inevitable.
Thirty years ago, hamburgers kept Marler incredibly busy: more than 90% of his E. coli cases involved them. Today, he said, it’s practically zero. “That’s because of government intervention and industry stepping up.”
After the deadly 1993 Jack in the Box outbreak, regulators and the meat industry introduced new rules, testing, and other safeguards that made hamburger substantially safer.
So, is this summer unusually riskier? The Cyclospora outbreak is. Beyond that, many of the problems are familiar ones. And the hamburger example shows that which foods pose the biggest risks can change substantially over time.
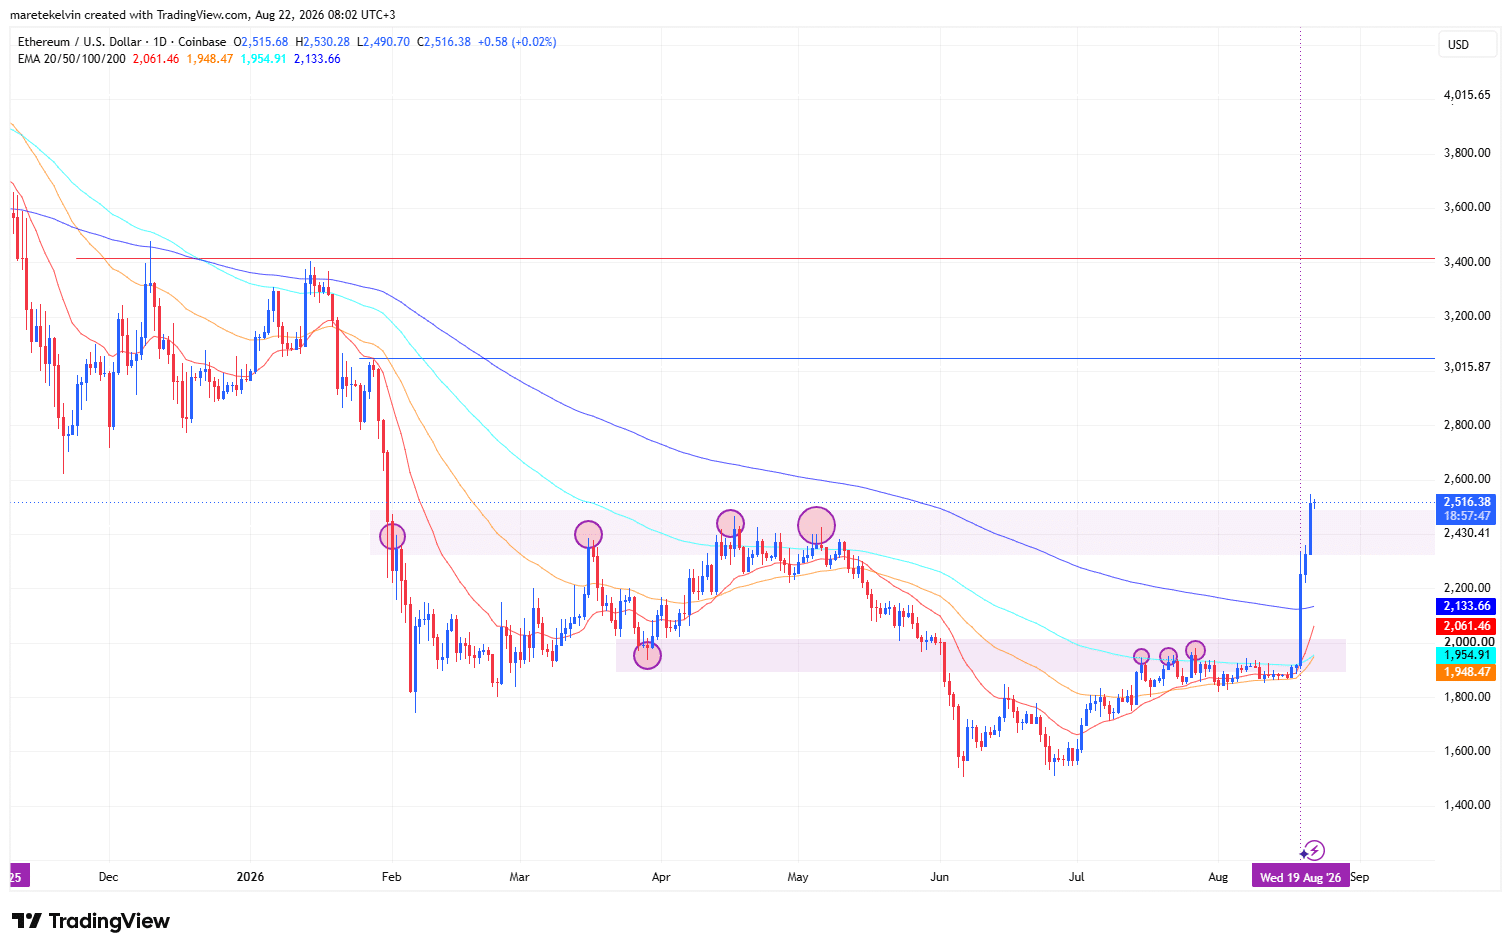
Ethereum [ETH] reclaimed $2,500 after several days of aggressive bullish momentum, strengthening its short-term market structure.
On the 21st of August, the daily candle closed above this key supply zone. That move turned former resistance into an important level for buyers to defend.
Meanwhile, stronger U.S. demand, rising Fund Holdings, and lower system-wide leverage supported the breakout.
Can these conditions carry Ethereum toward the next psychological level at $3,000?
Can Ethereum hold $2,500?
Ethereum’s latest advance pushed its price above $2,500 and all key Exponential Moving Averages. The daily close showed that buyers had absorbed a major layer of overhead selling pressure.
Source: TradingView
Holding $2,500 could strengthen Ethereum’s bullish structure and establish a foundation for further gains. However, the breakout needs demand beyond price momentum alone.
What is driving Ethereum demand?
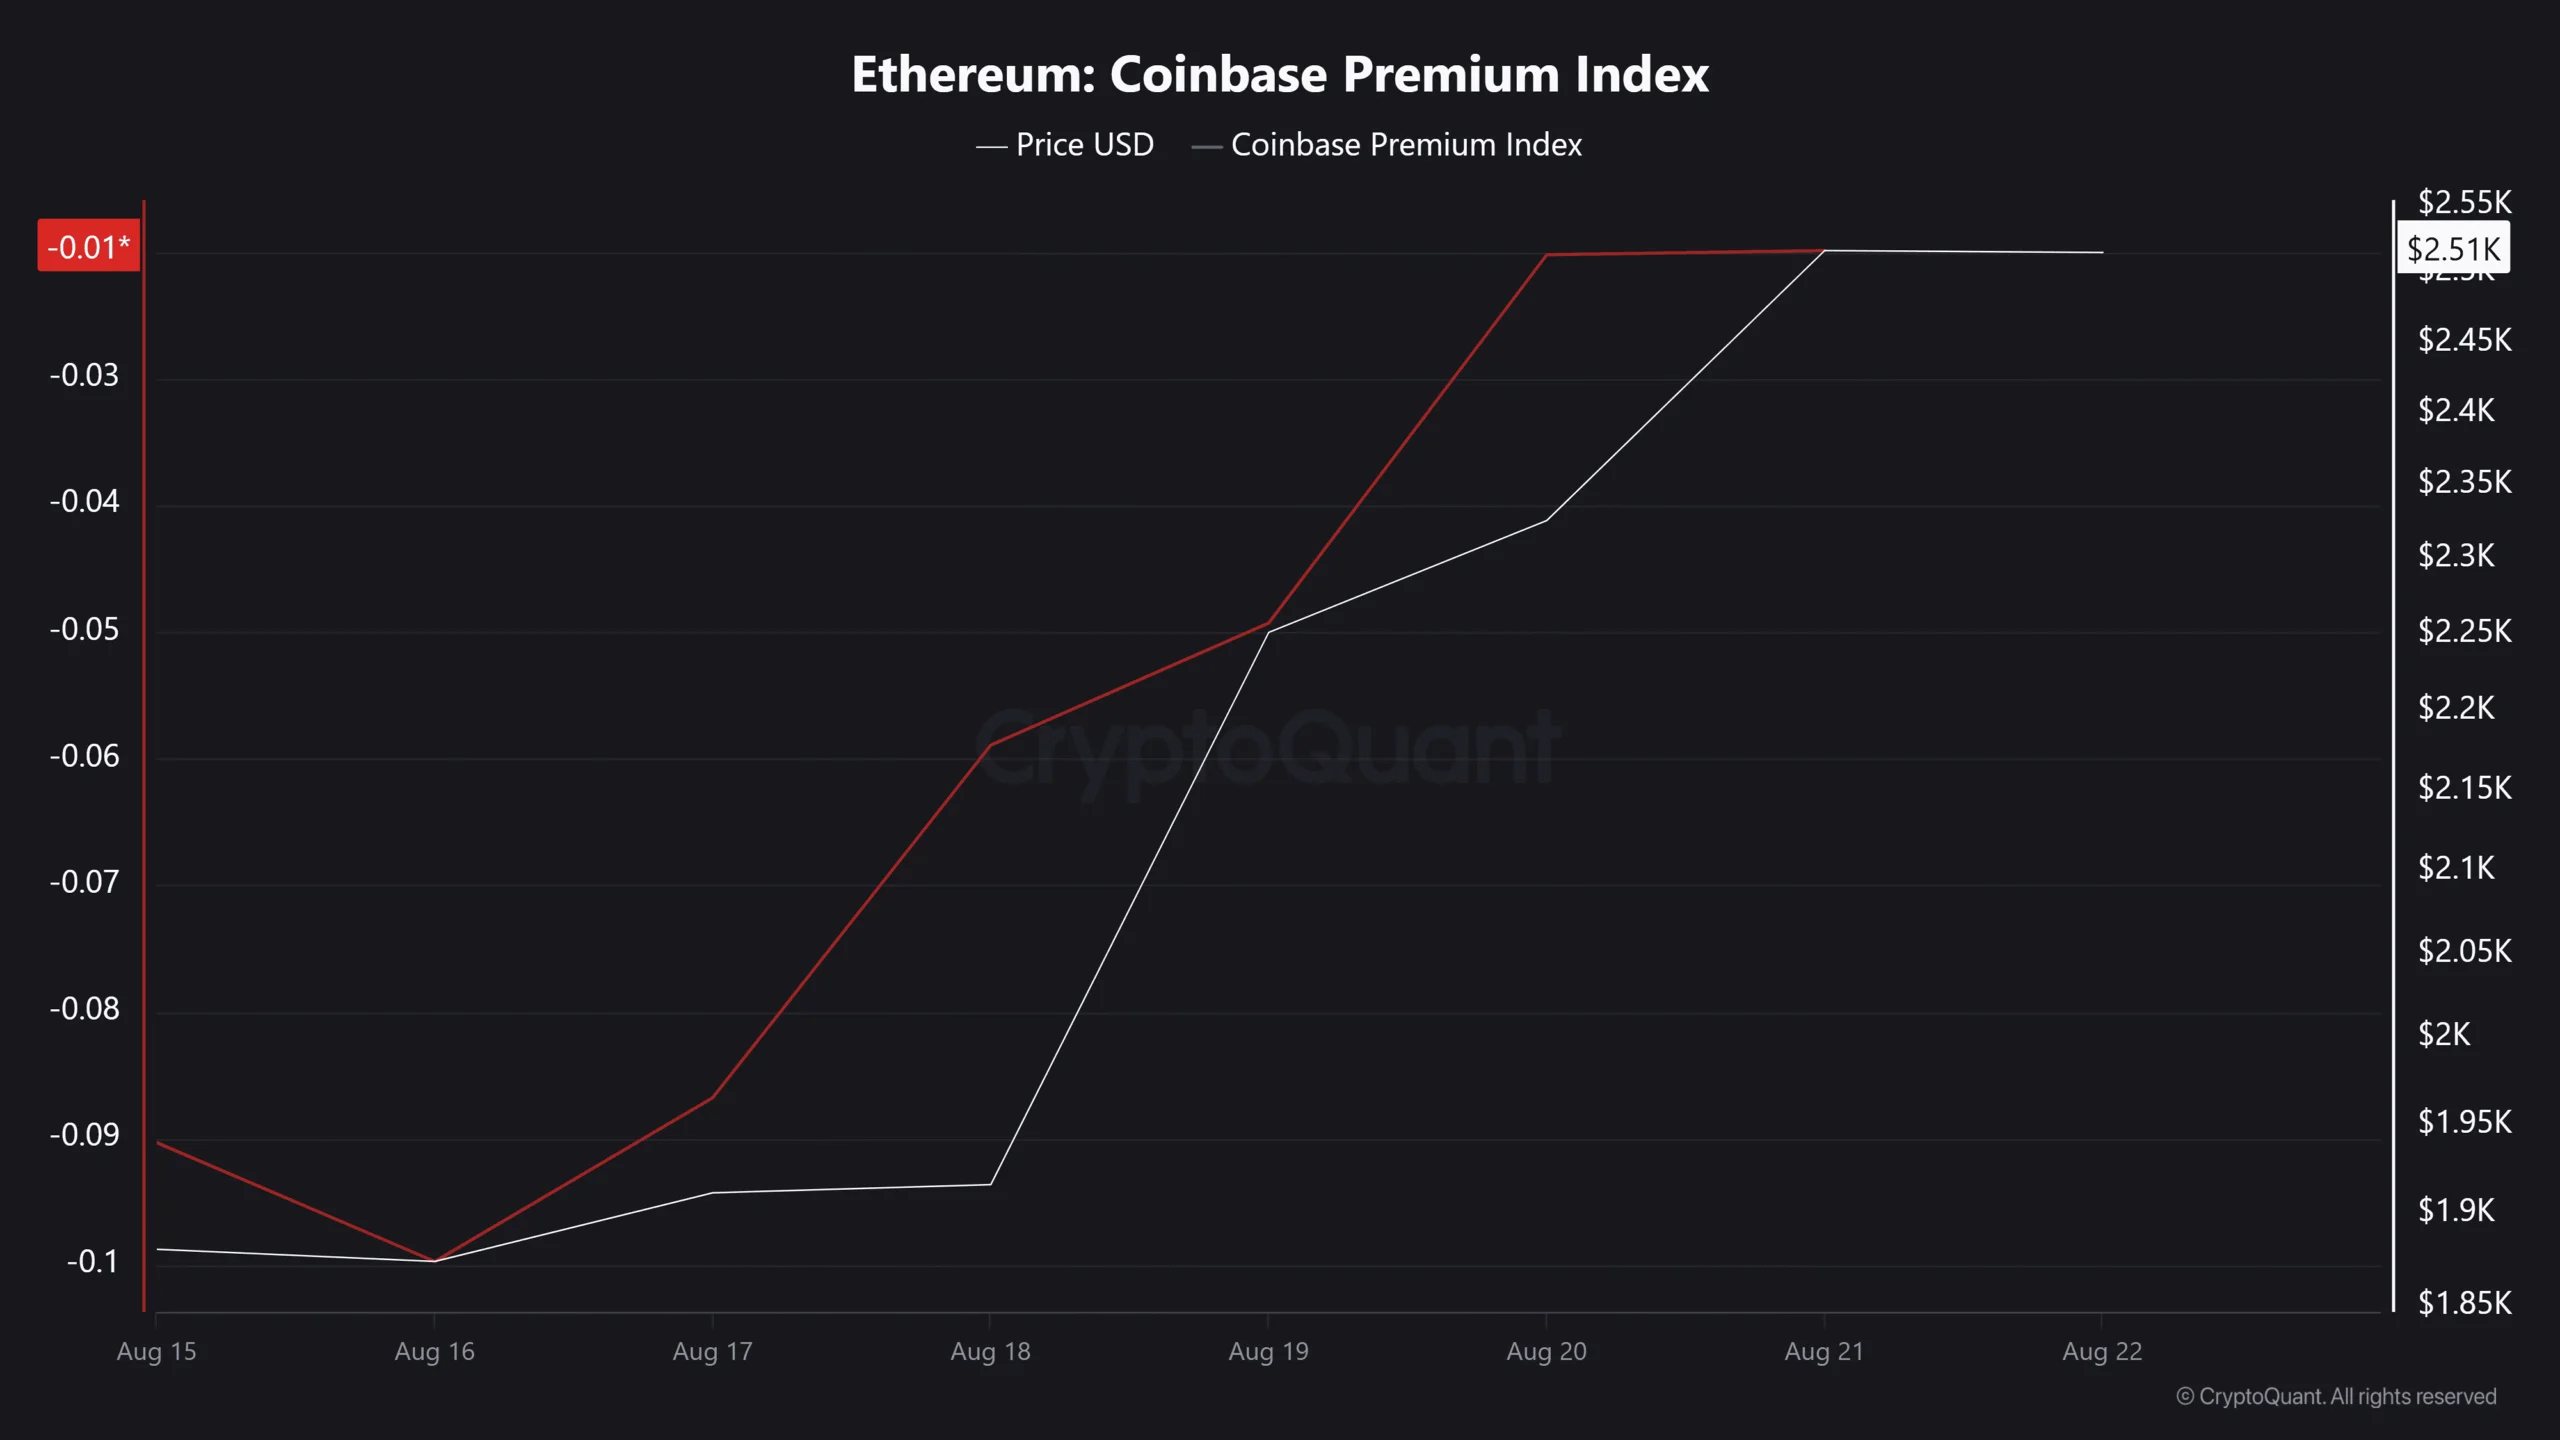
Ethereum’s Coinbase Premium Index surged 60%, indicating stronger U.S. buying relative to other markets.
Source: CryptoQuant
Continued Premium Index growth could confirm that Spot demand supported the rally.
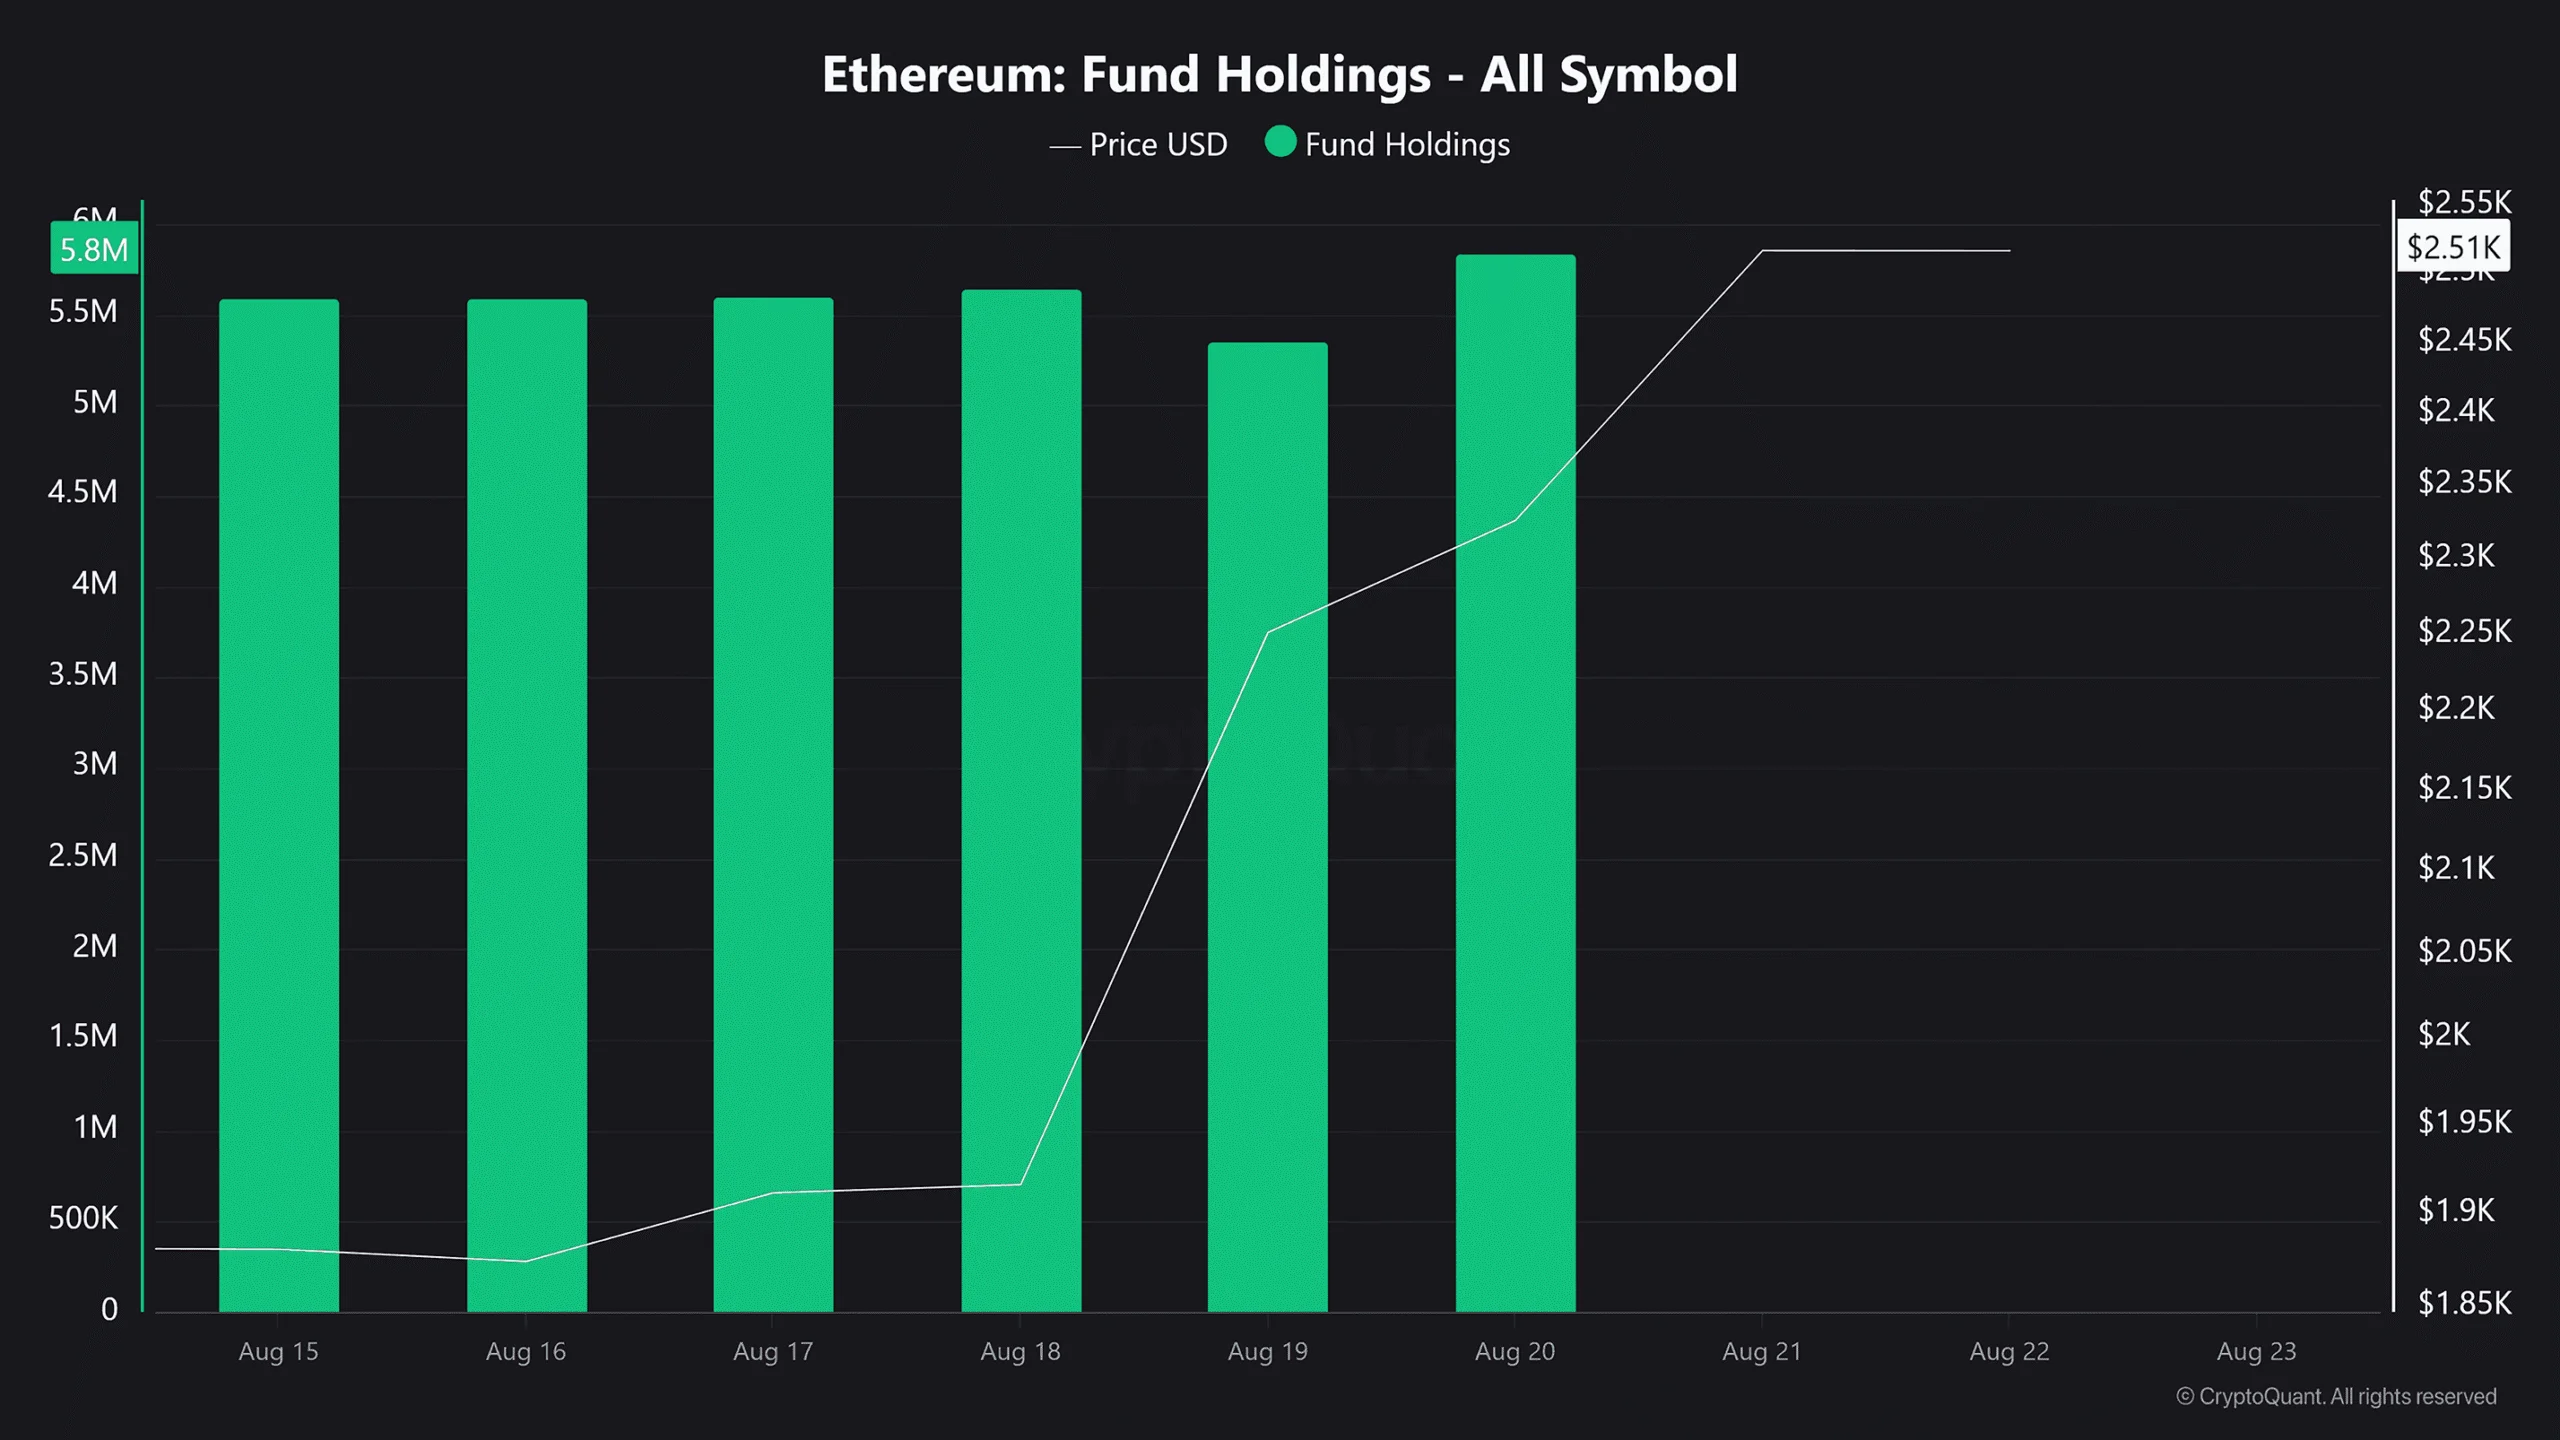
On top of that, Fund Holdings reached a weekly high of 5.8 million ETH. That balance was worth approximately $14.5 billion near the altcoin’s $2,500 price.
Source: CryptoQuant
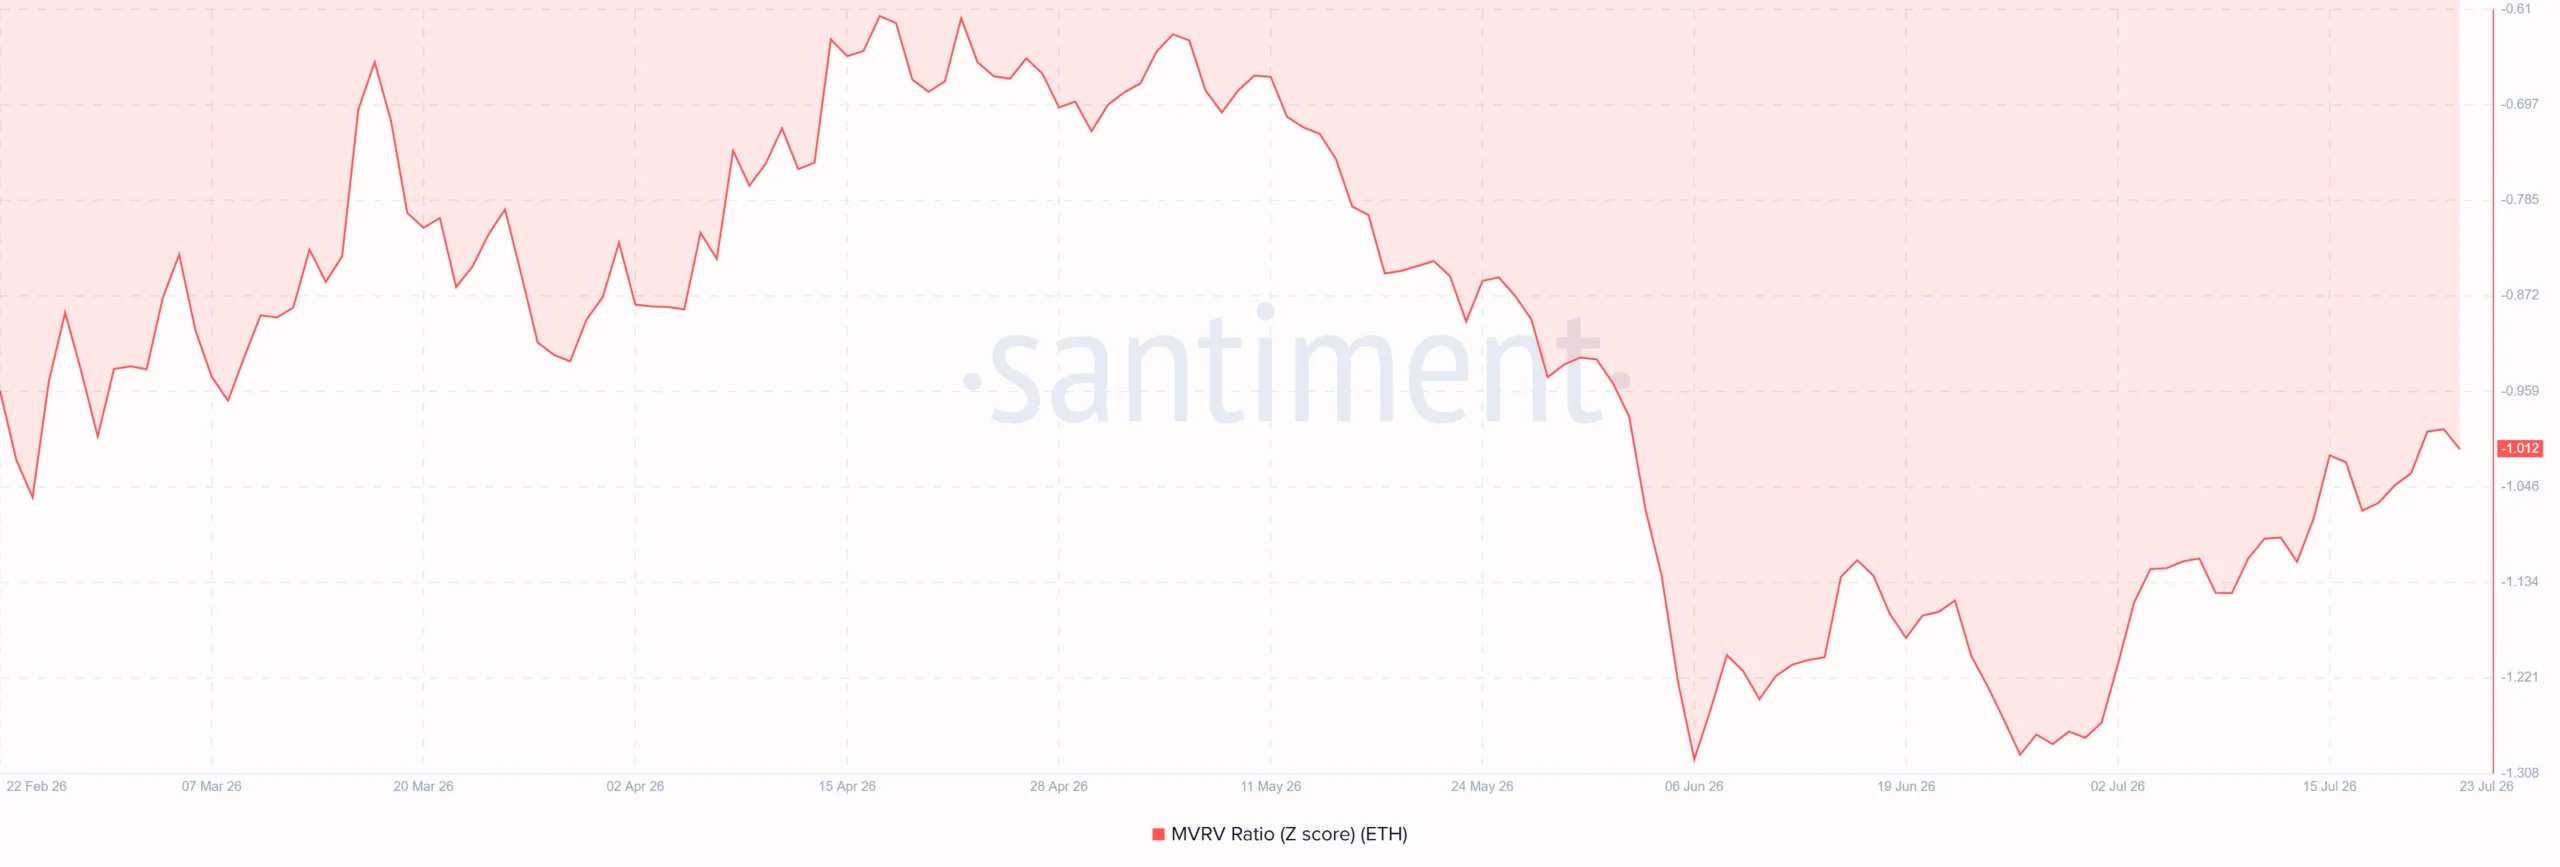
Meanwhile, the MVRV Z-Score stood at -1.012, leaving Ethereum below historically overheated valuation levels. Together, these readings suggested that the rally had institutional demand without an extreme valuation.
Source: Santiment
Is leverage strengthening Ethereum?
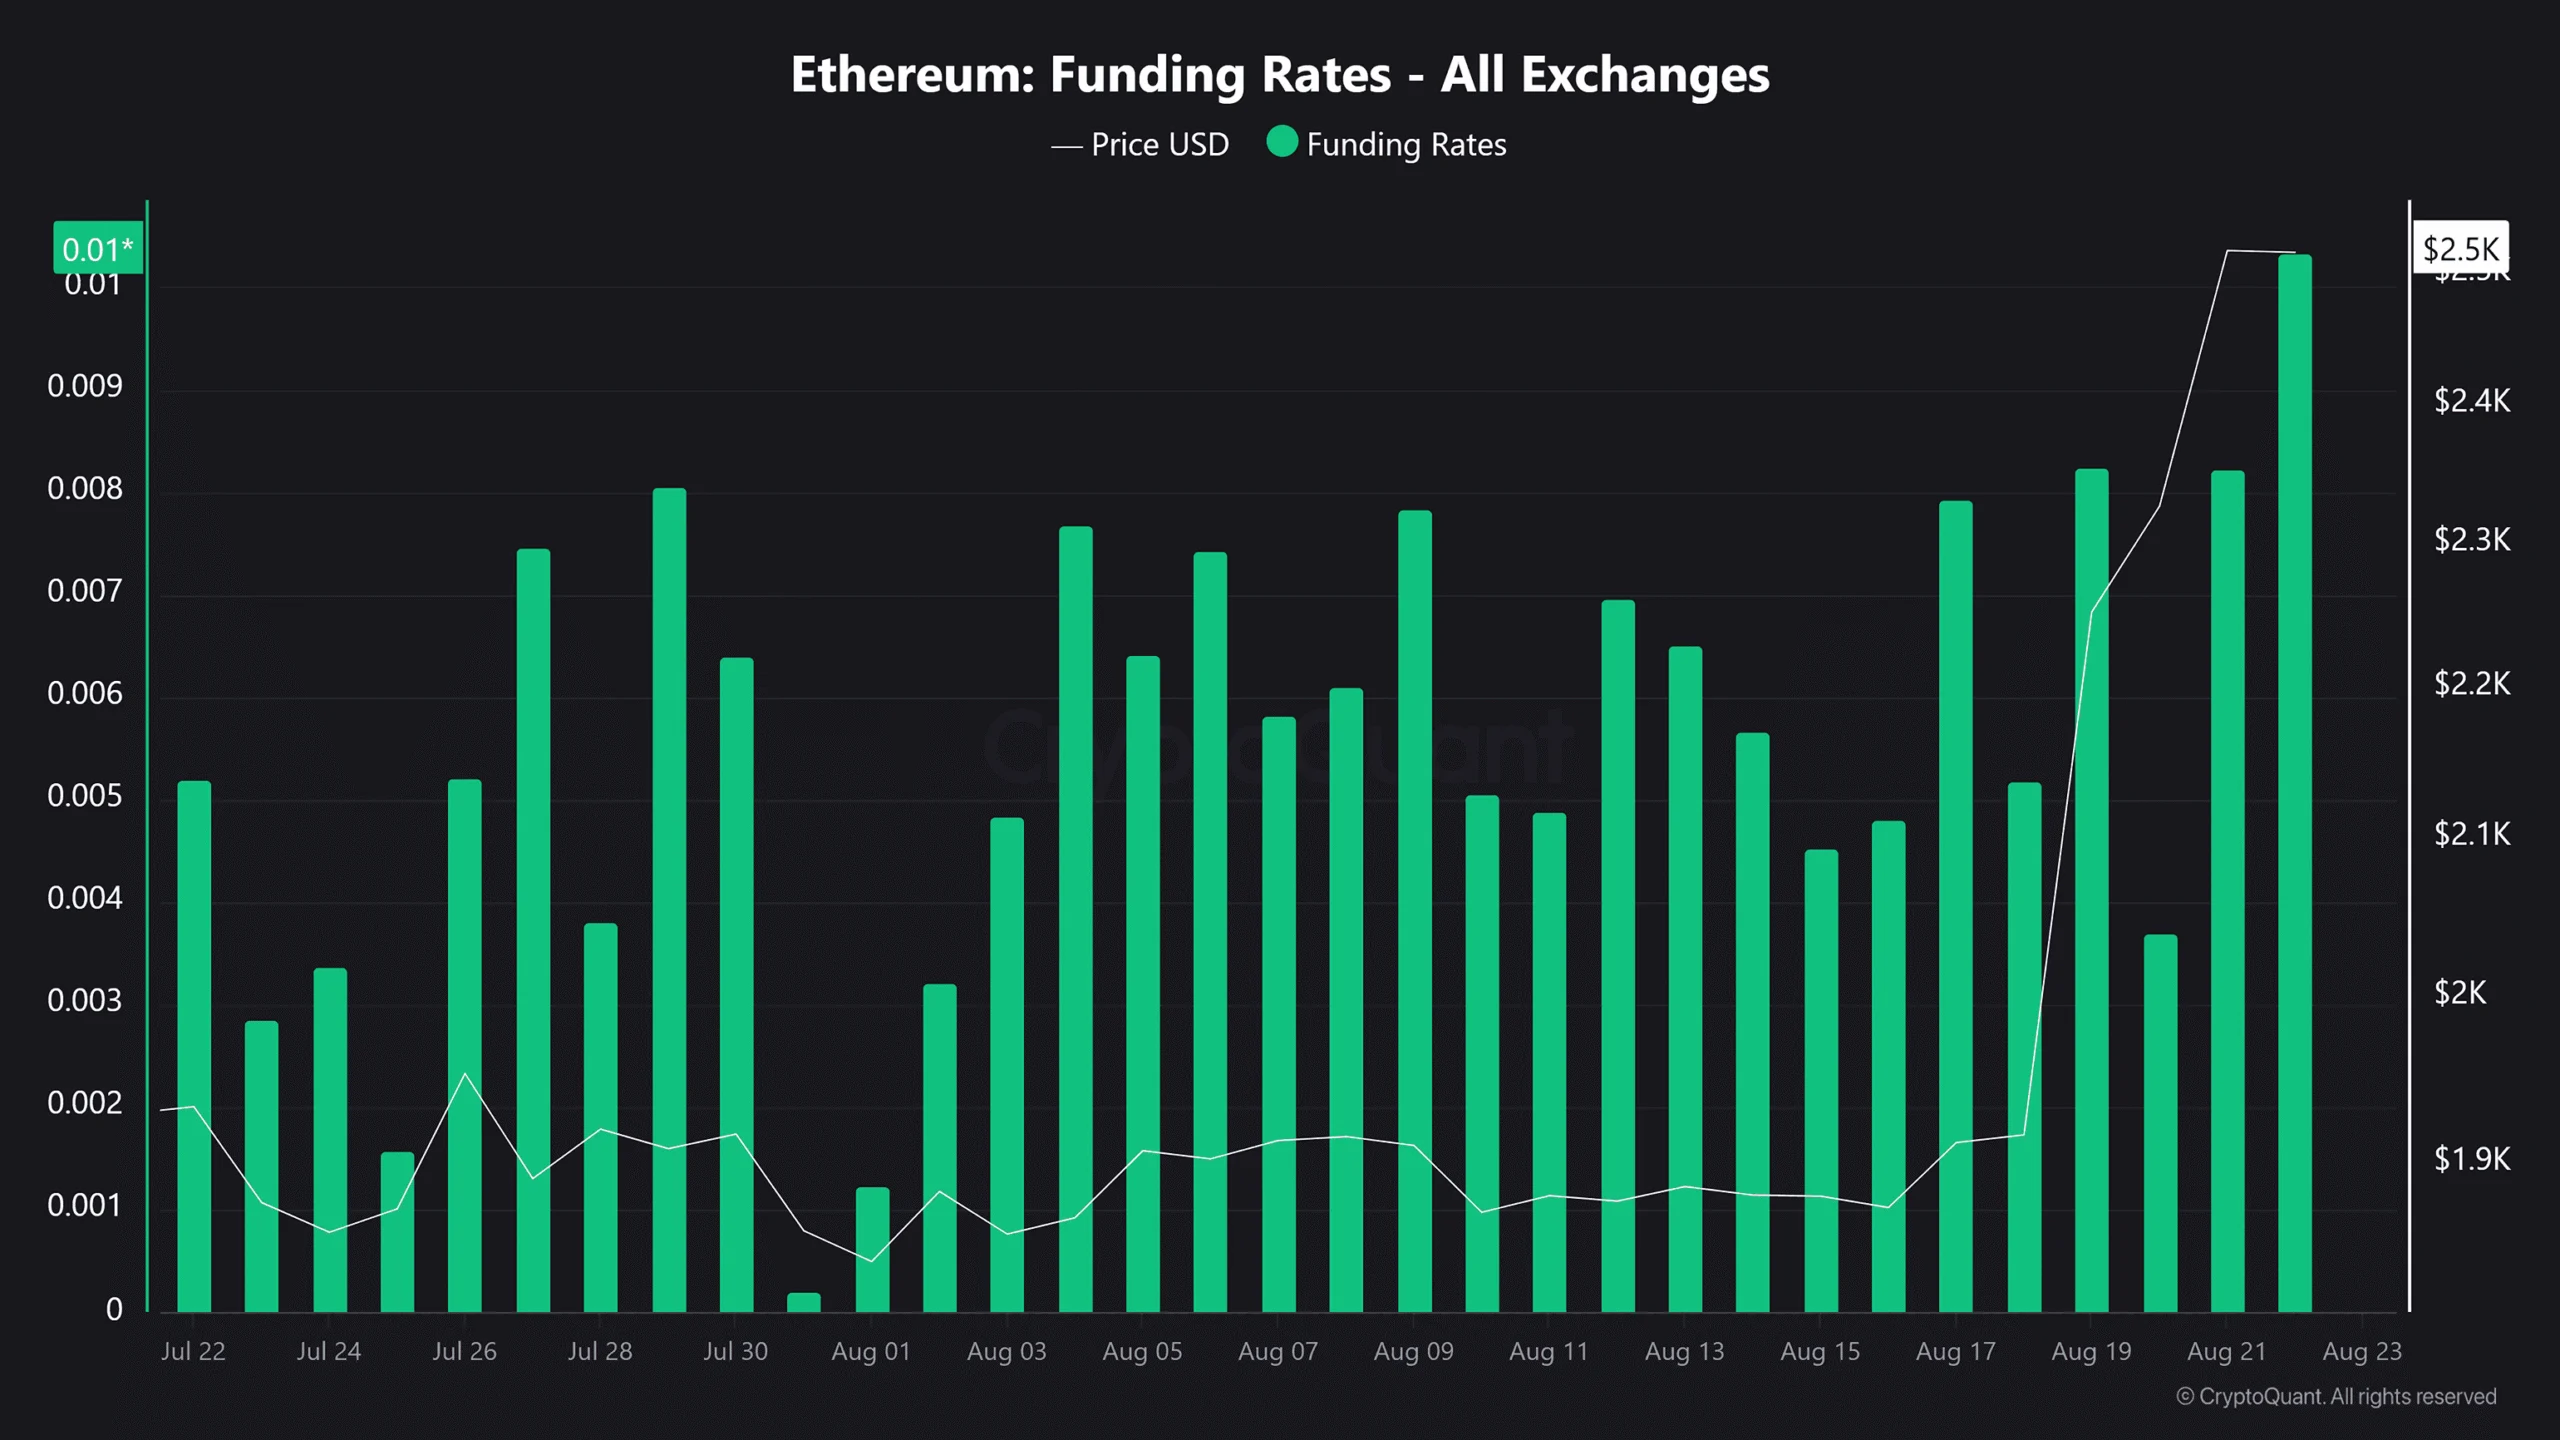
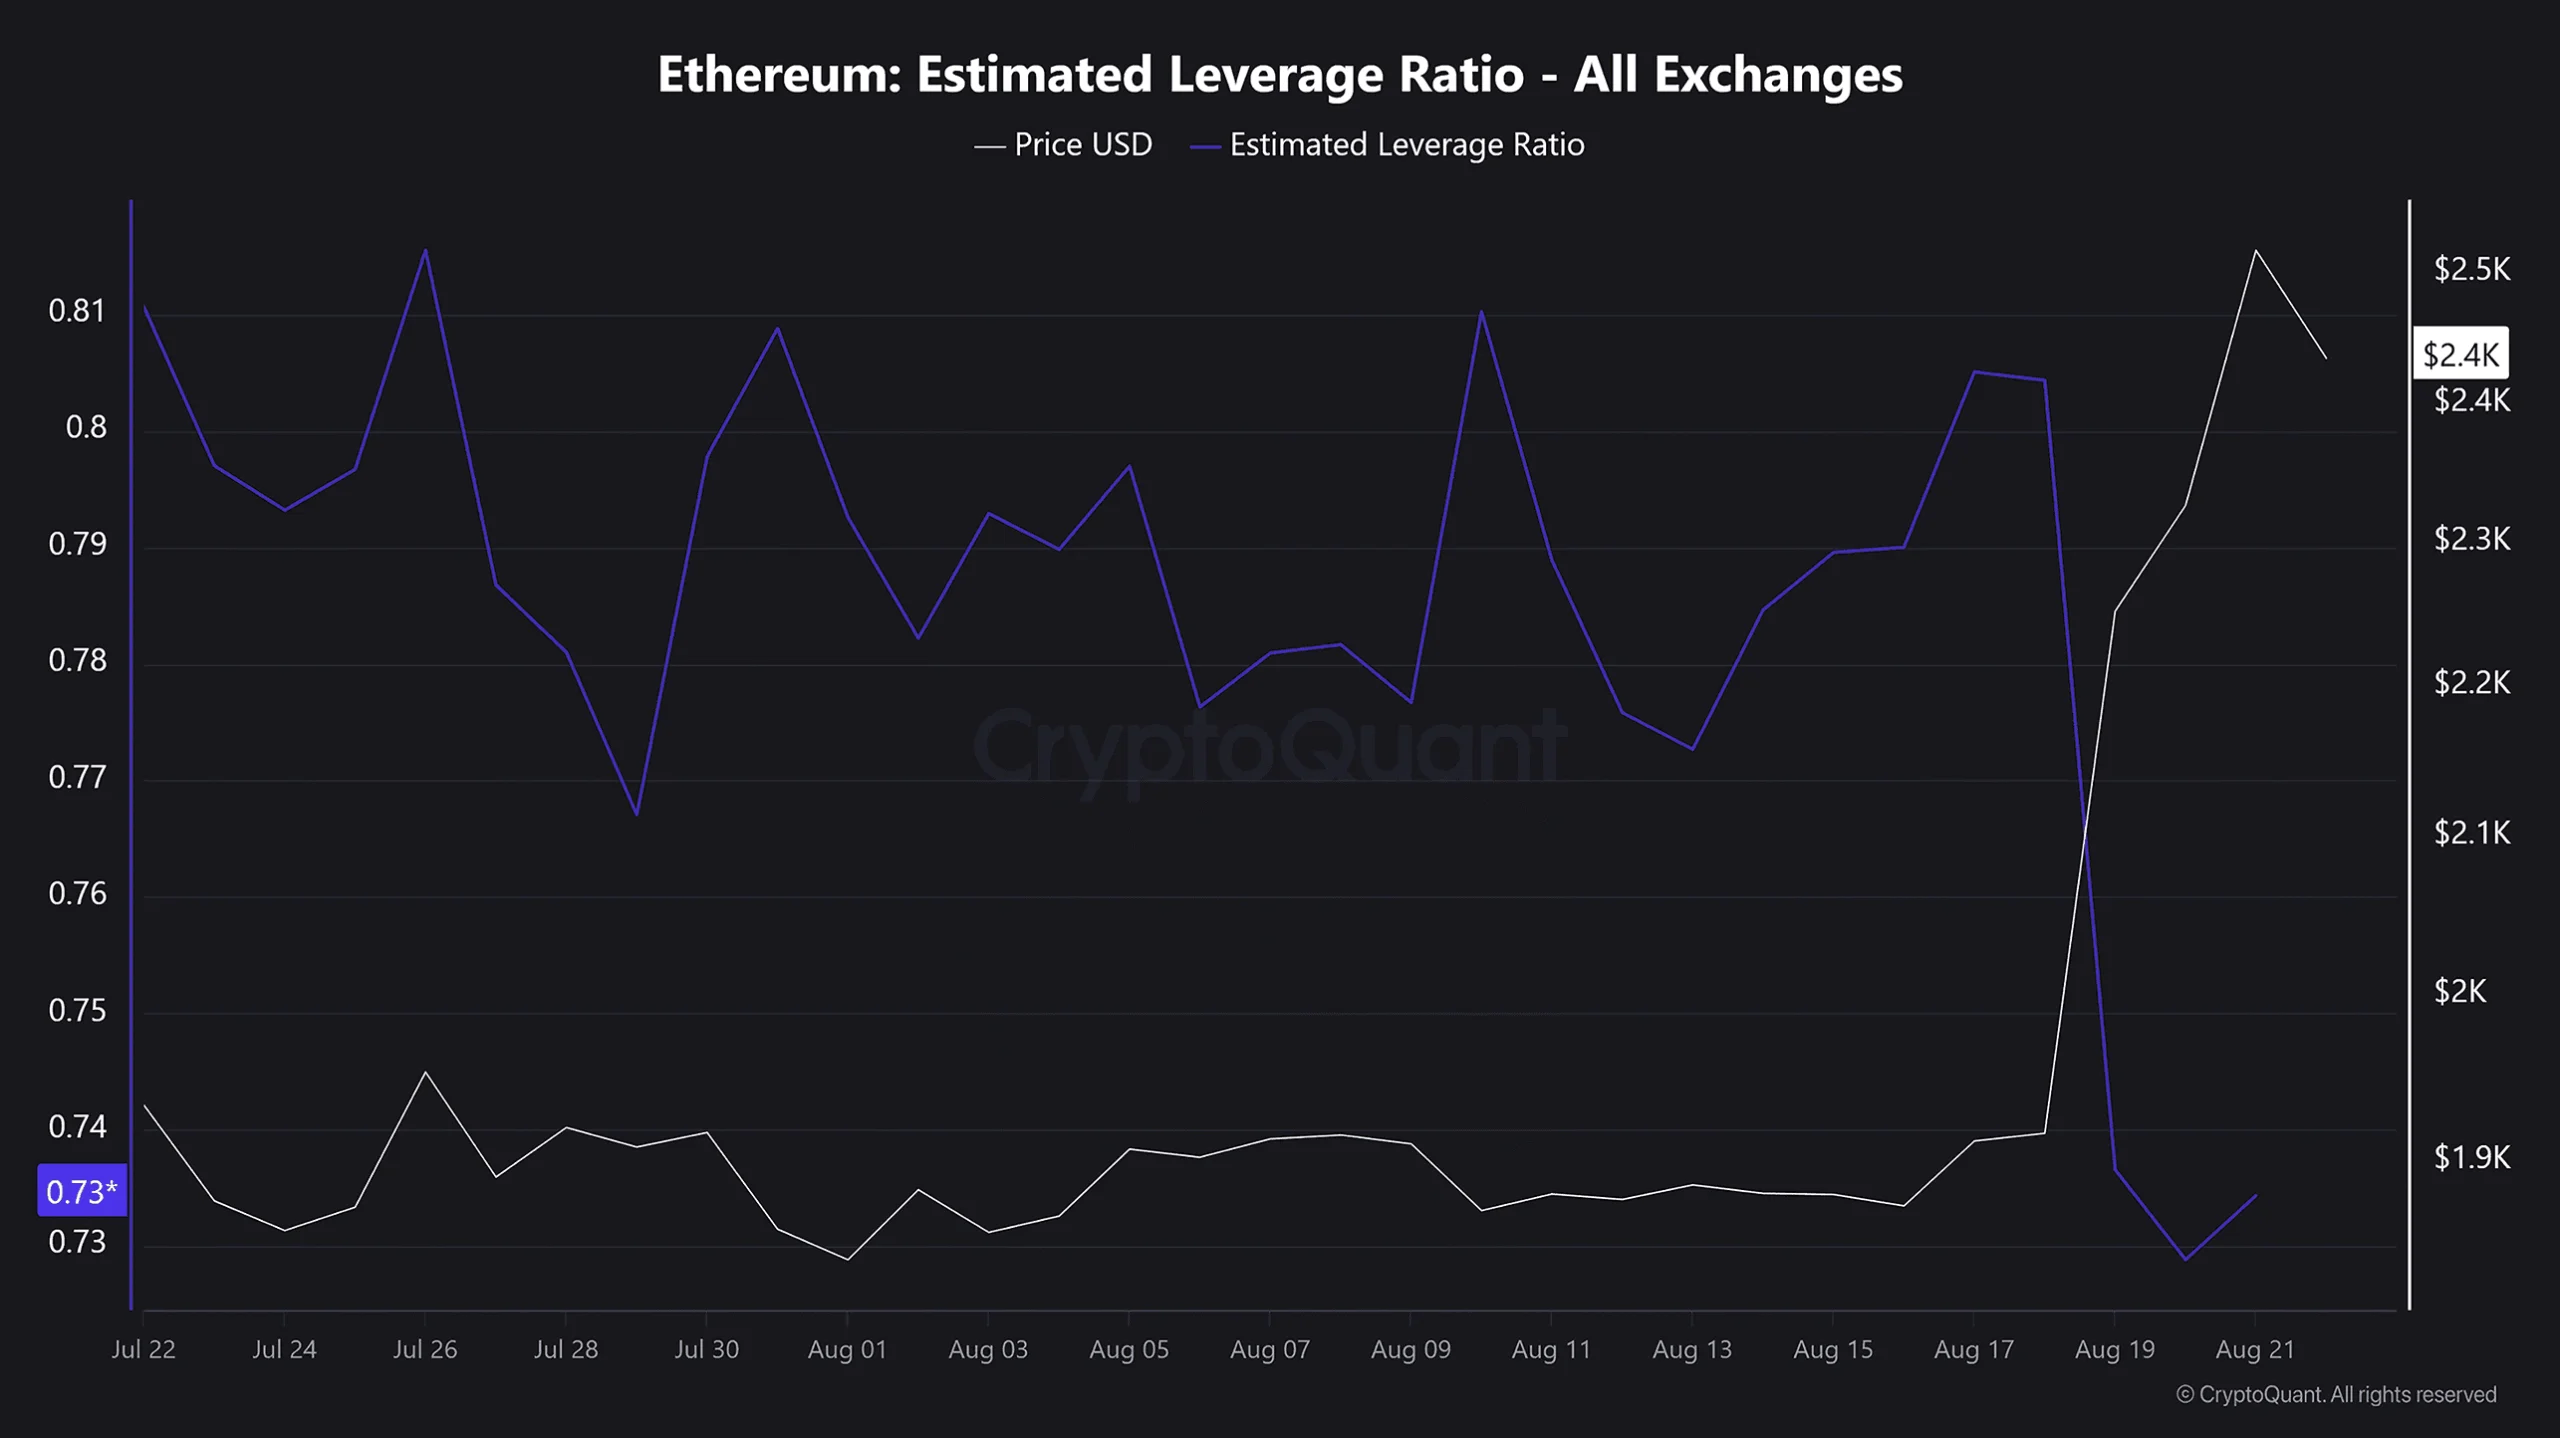
Ethereum’s Funding Rate climbed 19% over 24 hours, reflecting stronger demand for leveraged Long Positions. However, the Estimated Leverage Ratio fell to a monthly low of 0.73.
Source: CryptoQuant
This divergence showed stronger bullish positioning alongside lower system-wide leverage.
Source: CryptoQuant
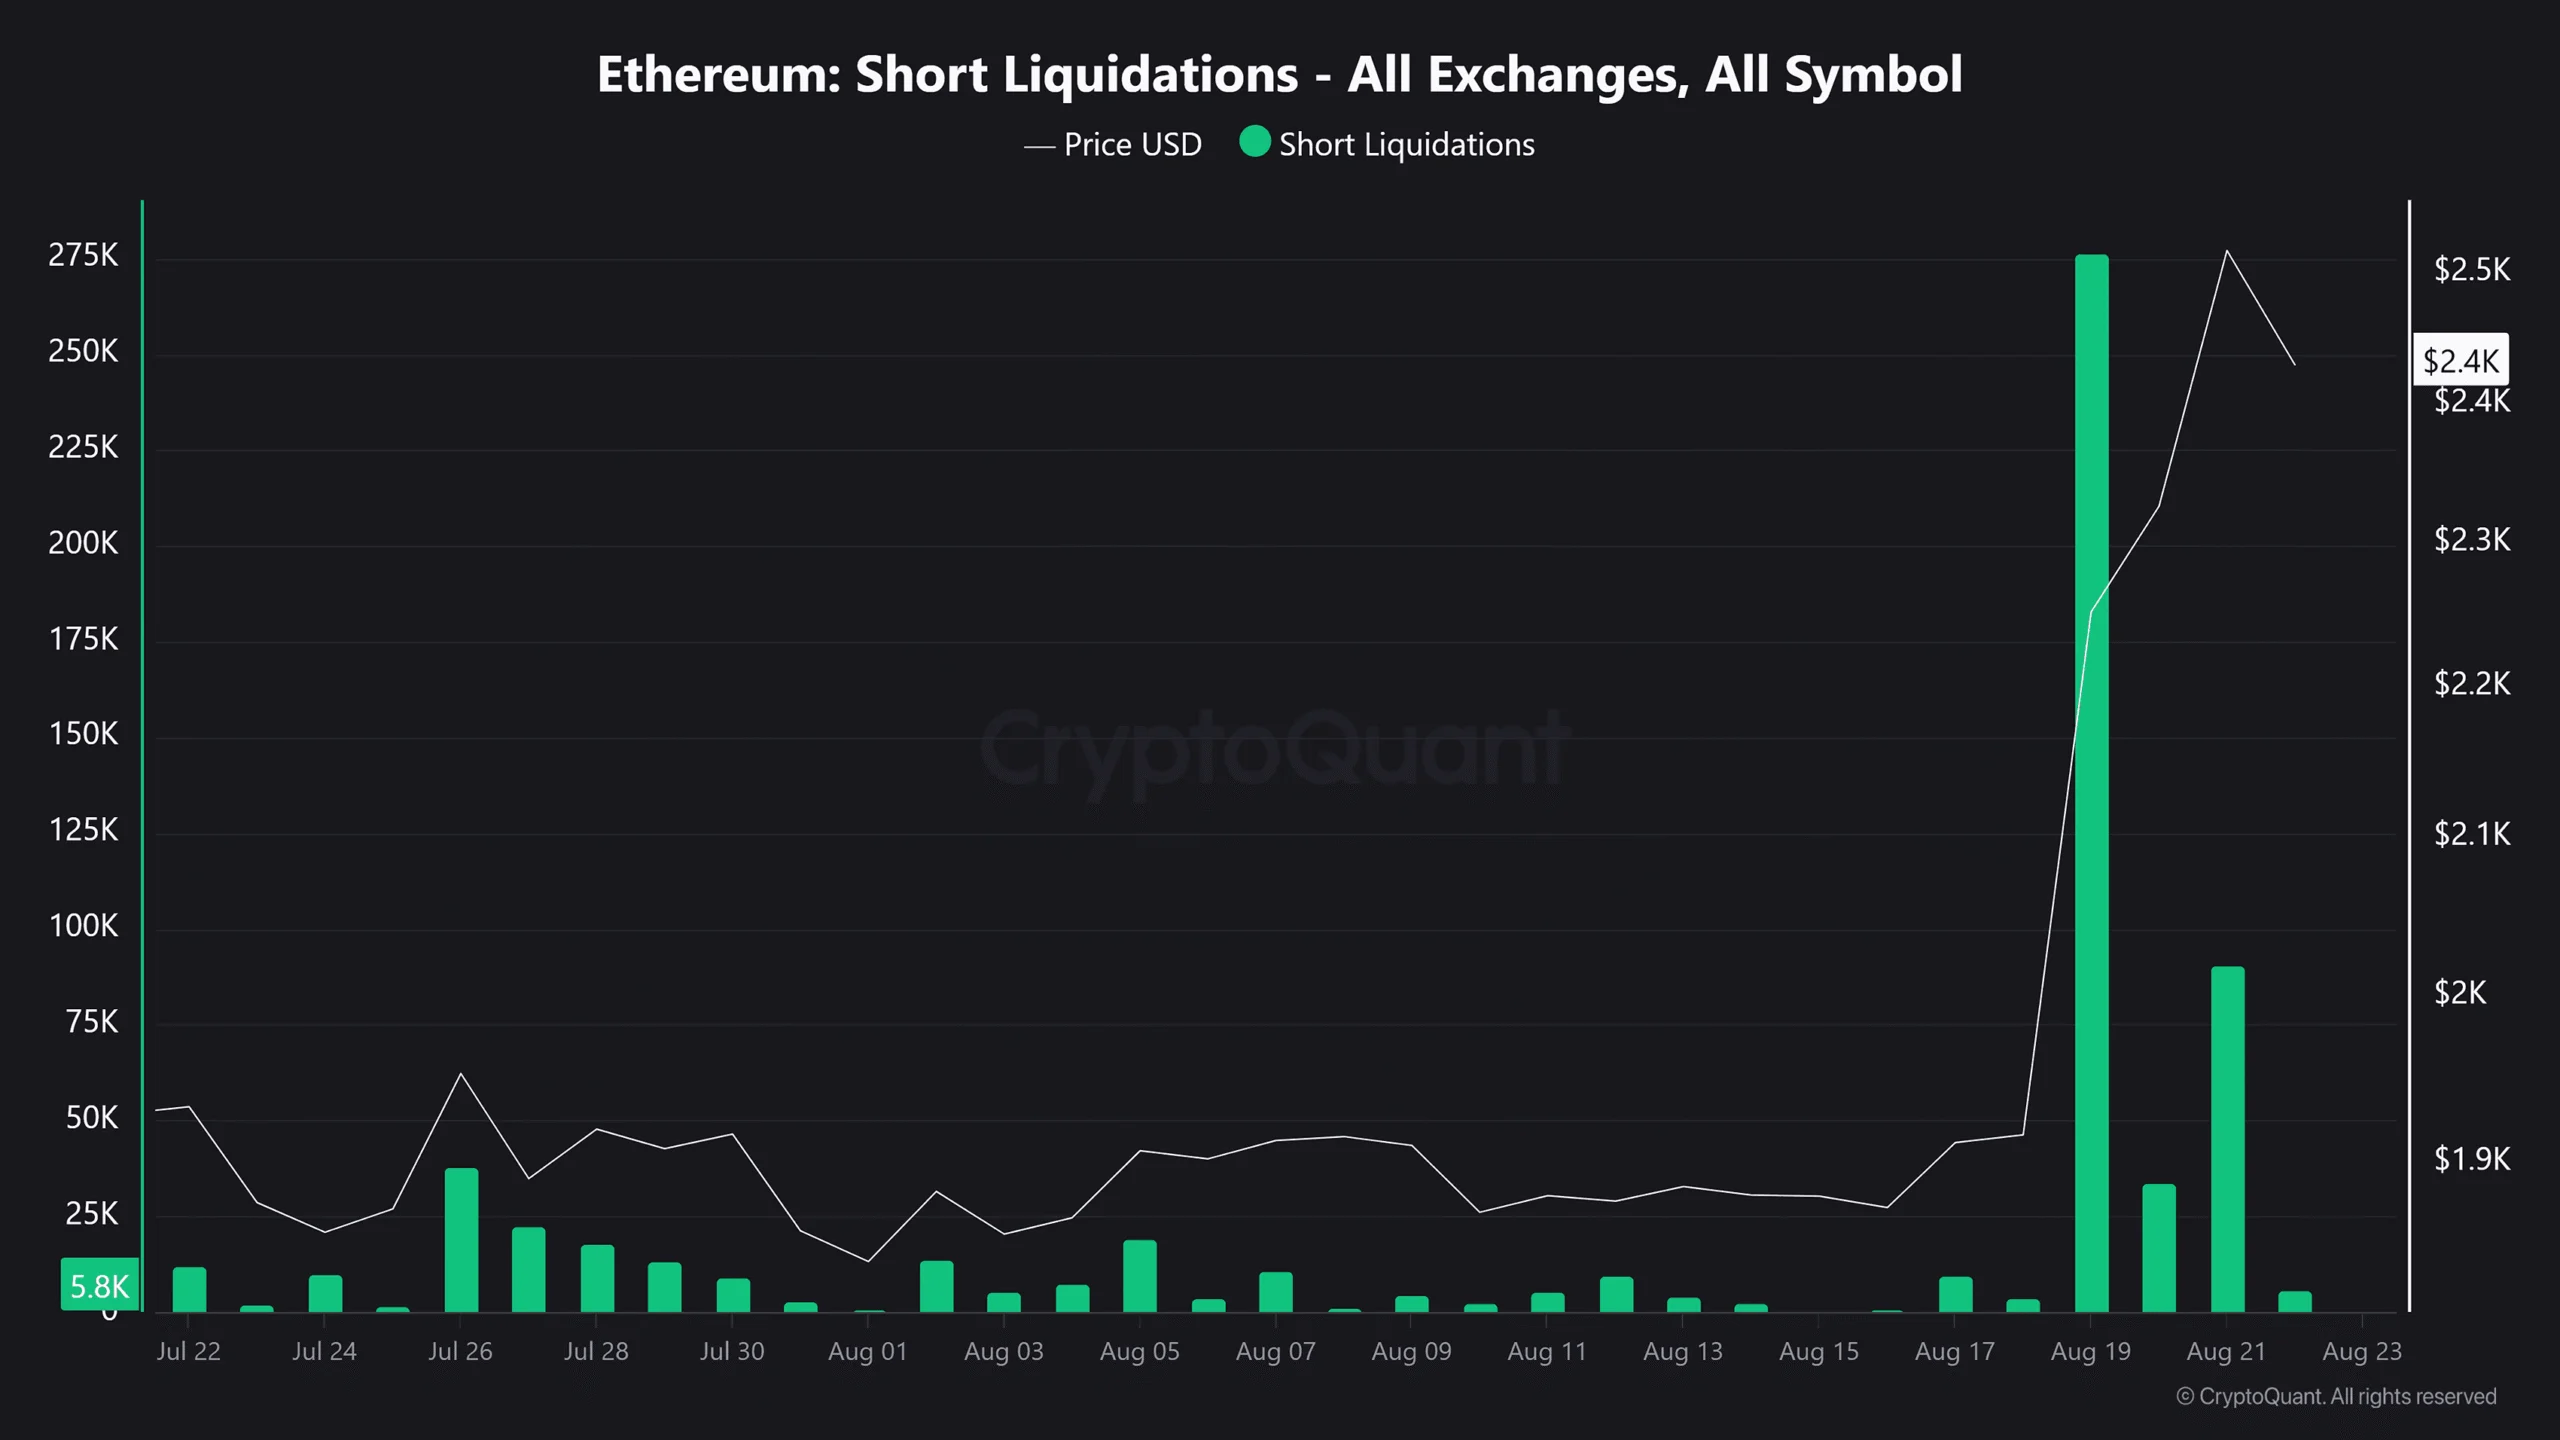
The decline could reflect position closures, increased collateral, or both. It followed a Short Squeeze near $2,200, which liquidated approximately 276,000 ETH worth $673 million.
Source: CryptoQuant
That unwind may have cleared considerable bearish exposure without leaving the broader market excessively leveraged.
Can Ethereum reach $3,000?
Ethereum’s breakout combined stronger U.S. demand, elevated Fund Holdings, and lower system-wide leverage.
If buyers defend $2,500, the altcoin could target the next resistance near $3,000. However, a daily close below $2,500 could invalidate the breakout and extend consolidation.
The rally has claimed $2,500. Turning that victory into support will decide whether $3,000 is in reach.
Final Summary
Ethereum reclaimed $2,500 and closed above its key Exponential Moving Averages.
Approximately 276,000 ETH worth $673 million was cleared through Short Liquidations.
The Vanguard Information Technology ETF (NYSEMKT: VGT) has delivered a monster 24% annualized return over the last decade. If the fund maintains its pace over the next 10 years, it would grow from today’s price of around $120 a share to more than $1,000 per share.
The fund’s past performance doesn’t guarantee similar returns in the future. However, the Vanguard Information Technology ETF‘s heavy allocation to AI semiconductor giants Nvidia and Broadcom bodes well for its future return potential.
Missed Nvidia in 2009? This Rare Signal Is Flashing Again. In 2009, a “Double Down” signal flashed for a little-known chipmaker called Nvidia. For the first time in years, that same “Total Conviction” signal is flashing for a company 1/100th the size of Nvidia. Continue »
Image source: Getty Images.
Loaded with growth
VGT has been a strong performer since its inception in 2004 with a 14.6% annualized return. Its performance has been really strong over the past decade, including one-, three-, and five-year annualized returns ranging from 17.8% to 31.7%. That’s due in large part to the robust performance of semiconductor stocks, which are crucial for AI. For example, Broadcom and Nvidia have delivered eye-popping annualized returns of 35.5% and 63.8%, respectively, over the past decade, helping drive this fund’s robust performance.
They should continue to be major contributors to its future success. Nvidia is the fund’s top holding, with a large 17.2% allocation. Meanwhile, Broadcom currently ranks fourth at 4.2%. The fund has meaningful allocations to all the top tech and AI stocks.
That’s worth noting because most analysts believe we’re still just in the early stages of the AI infrastructure build-out. According to a Deloitte outlook, global semiconductor sales alone are expected to more than double from $975 billion this year to $2 trillion by 2036. That should drive continued robust growth for Nvidia and Broadcom. That’s just one catalyst for this fund.
While VGT has robust return potential over the next decade, it’s not without risks. There’s growing competition in the AI semiconductor space, which could compress profit margins over the next decade. Additionally, there is a risk that AI might not deliver the productivity gains many envision, which could lead to slower spending.
That caveat aside, the Vanguard Information Technology ETF offers the opportunity to passively invest in one of the biggest megatrends in history. If AI comes even close to delivering on the promise many see in the technology, the fund could easily top $1,000 per share by 2036.
Should you buy stock in Vanguard Information Technology ETF right now?
Before you buy stock in Vanguard Information Technology ETF, consider this:
The Motley Fool Stock Advisor analyst team just identified what they believe are the 10 best stocks for investors to buy now… and Vanguard Information Technology ETF wasn’t one of them. The 10 stocks that made the cut could produce monster returns in the coming years.
Consider when Netflix made this list on December 17, 2004… if you invested $1,000 at the time of our recommendation, you’d have $432,189!* Or when Nvidia made this list on April 15, 2005… if you invested $1,000 at the time of our recommendation, you’d have $1,330,956!*
Now, it’s worth noting Stock Advisor’s total average return is 967% — a market-crushing outperformance compared to 212% for the S&P 500. Don’t miss the latest top 10 list, available with Stock Advisor, and join an investing community built by individual investors for individual investors.