Home Blog Page 62

Forecasts for Hot US Temperatures Lift Nat-Gas Prices

0
Forecasts for Hot US Temperatures Lift Nat-Gas Prices


Gas flame with blue reflection on dark backdrop by Bellanatella via iStock

September Nymex natural gas (NGU26) on Tuesday closed up +0.086 (+3.20%).

Nat-gas prices settled sharply higher on Tuesday amid forecasts of above-average temperatures in the US South, boosting nat-gas demand from electricity providers to power increased air conditioning use.  The Commodity Weather Group said on Tuesday that forecasts shifted to hotter, with above-average temperatures expected across the western and southern US through September 1. 

More News from Barchart

US (lower-48) dry gas production on Tuesday was 112.4 bcf/day (+2.5% y/y), according to BNEF.  Lower-48 state gas demand on Tuesday was 83.6 bcf/day (+3.2% y/y), according to BNEF.  Estimated LNG net flows to US LNG export terminals on Tuesday were 17.8 bcf/day (+2.7% w/w), according to BNEF.

As a bearish factor, the US Energy Information Administration (EIA) last Tuesday projected that US nat-gas storage levels will swell to 3,985 bcf at the end of October, the highest level in 10 years and 5% above the five-year average.  US nat-gas inventories are currently +6.7% above their 5-year seasonal average, a sign of robust supplies. 

Nat-gas prices have some negative carryover from August 4, when Energy Transfer announced that the Hugh Brinson pipeline will be able to operate at its full transportation capacity of 1.5 bcf/day by September 1, allowing more gas supplies to flow from the Permian Basin to the US benchmark Henry Hub in Erath, Louisiana, boosting US domestic supplies. 

A bearish medium-term factor for nat-gas prices is speculation that a powerful El Niño weather system will bring warmer-than-normal temperatures to the Northern Hemisphere this fall and winter, reducing nat-gas heating demand. 

As a positive factor for gas prices, the Edison Electric Institute reported last Wednesday that US (lower-48) electricity output in the week ended August 8 rose +7.0% y/y to 99,864 GWh (gigawatt hours).  Also, US electricity output in the 52 weeks ending August 8 rose +2.3% y/y to 4,357,109 GWh.

Last Thursday’s bearish weekly EIA report showed a +36 bcf increase in US nat-gas inventories for the week ended August 7, larger than market expectations of +31 bcf and the 5-year weekly average of +33 bcf.  As of August 7, nat-gas inventories were down -1.0% y/y and +6.7% above their 5-year seasonal average, signaling adequate nat-gas supplies.  As of August 16, gas storage in Europe was 61% full, compared to the 5-year seasonal average of 78% full for this time of year.


Source link

Pump.fun whale bets $6M on PUMP – Can liquidity fuel a breakout?

0
Pump.fun whale bets $6M on PUMP - Can liquidity fuel a breakout?


Whale activity intensified around Pump.fun [PUMP] after a trader opened a $6 million leveraged long, reinforcing bullish conviction through the latest recovery. 

As reported by Lookonchain, the position involved a 10x leverage on 1.94 billion PUMP, with approximately $246,000 in unrealized profit already. Meanwhile, PUMP was up 8.51% in 24 hours to trade near $0.003017 at press time. However, the whale set a liquidation price of $0.002852, leaving the position exposed in case of a correction.

The leveraged bet therefore reflected strong directional conviction while raising the significance of nearby price support. Continued strength above the liquidation threshold would preserve the whale’s exposure and maintain buying confidence.

A breakdown to $0.002852 could then put pressure on the bulls in the leveraged position and make the bull market more uncertain.

Spot outflows give whale demand more support

Exchange flows added another favorable component to the whale-led positioning during the latest session. 

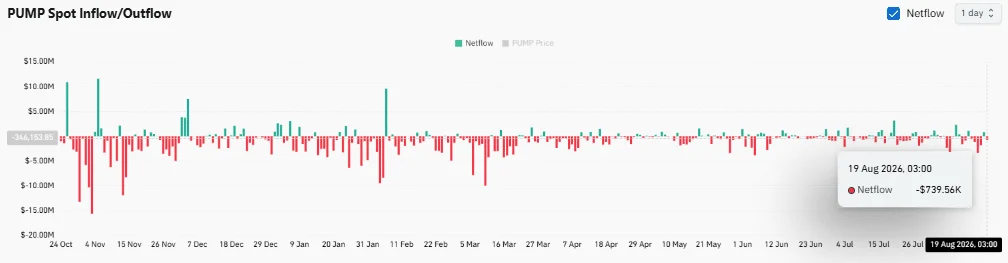
At the time of analysis, PUMP had recorded a $739.56K spot outflow, indicating more tokens left exchanges than entered them. Hence, the immediately tradable exchange supply dropped while the whale maintained significant leveraged exposure. 

Reduced exchange availability also limited one potential source of near-term selling pressure. Importantly, the outflow supported the whale position rather than challenging it, supporting a bullish direction. 

Buyers were thus left with less supply on the exchange side as PUMP tried to retain its recent gains. One outflow a day, however, was not enough to guarantee continued demand in subsequent sessions. 

Persistent withdrawals are needed to set up a better supply backdrop and enhance the prospects for a further push higher. 

Source: CoinGlass

Can PUMP’s ascending channel survive resistance?

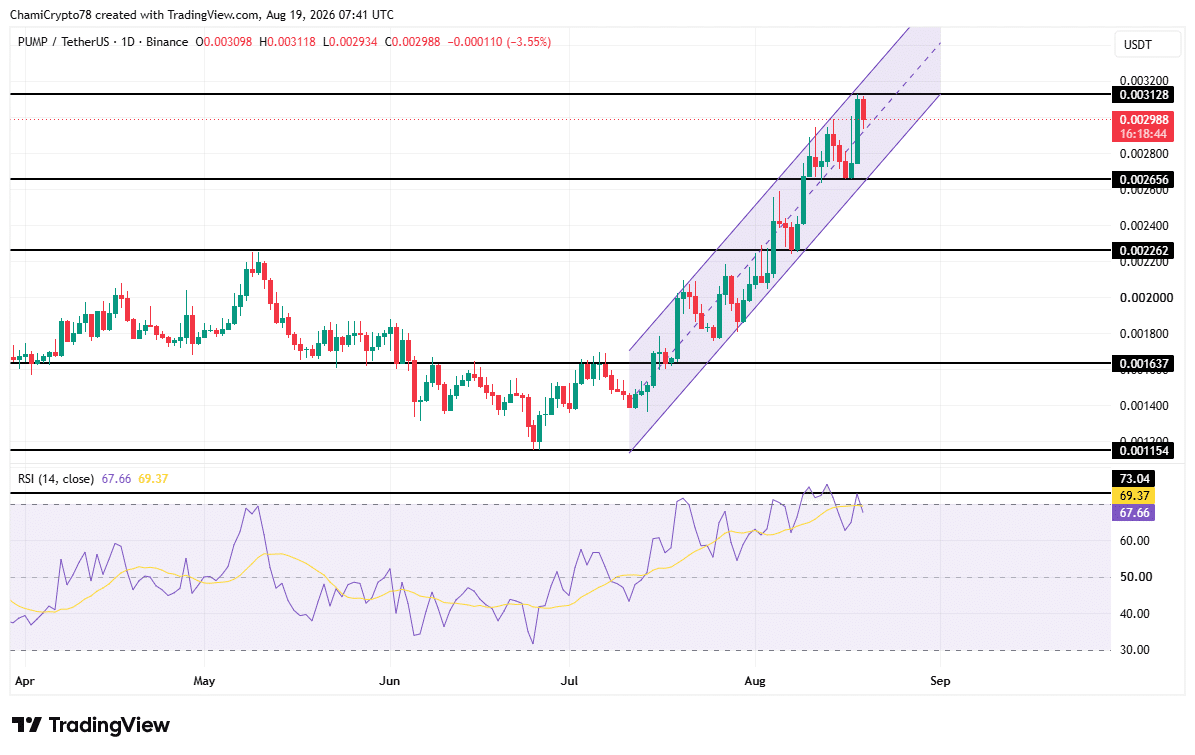
On the daily timeframe chart, the price action maintained the upward channel movement for PUMP as it pushed into $0.003128 resistance. The latest push was met by sellers near the upper part of the channel as PUMP headed toward the $0.00300 level. 

However, the price was still far from the significant $0.002656 support level. The channel structure thus maintained the general upward sequence despite resistance interrupting the latest advance. 

At the time of writing, the RSI reached 67.66, while its average stood higher at 69.37. Those readings kept PUMP near stronger buying territory without crossing the marked 73.04 threshold. A sustainable move through the $0.003128 level would reinforce the channel and open the way to higher prices.

However, losing the $0.002656 level would weaken the structure and leave $0.002262 as the next major level of support.

PUMP price actionPUMP price action
Source: TradingView

Overhead liquidity could pull PUMP higher

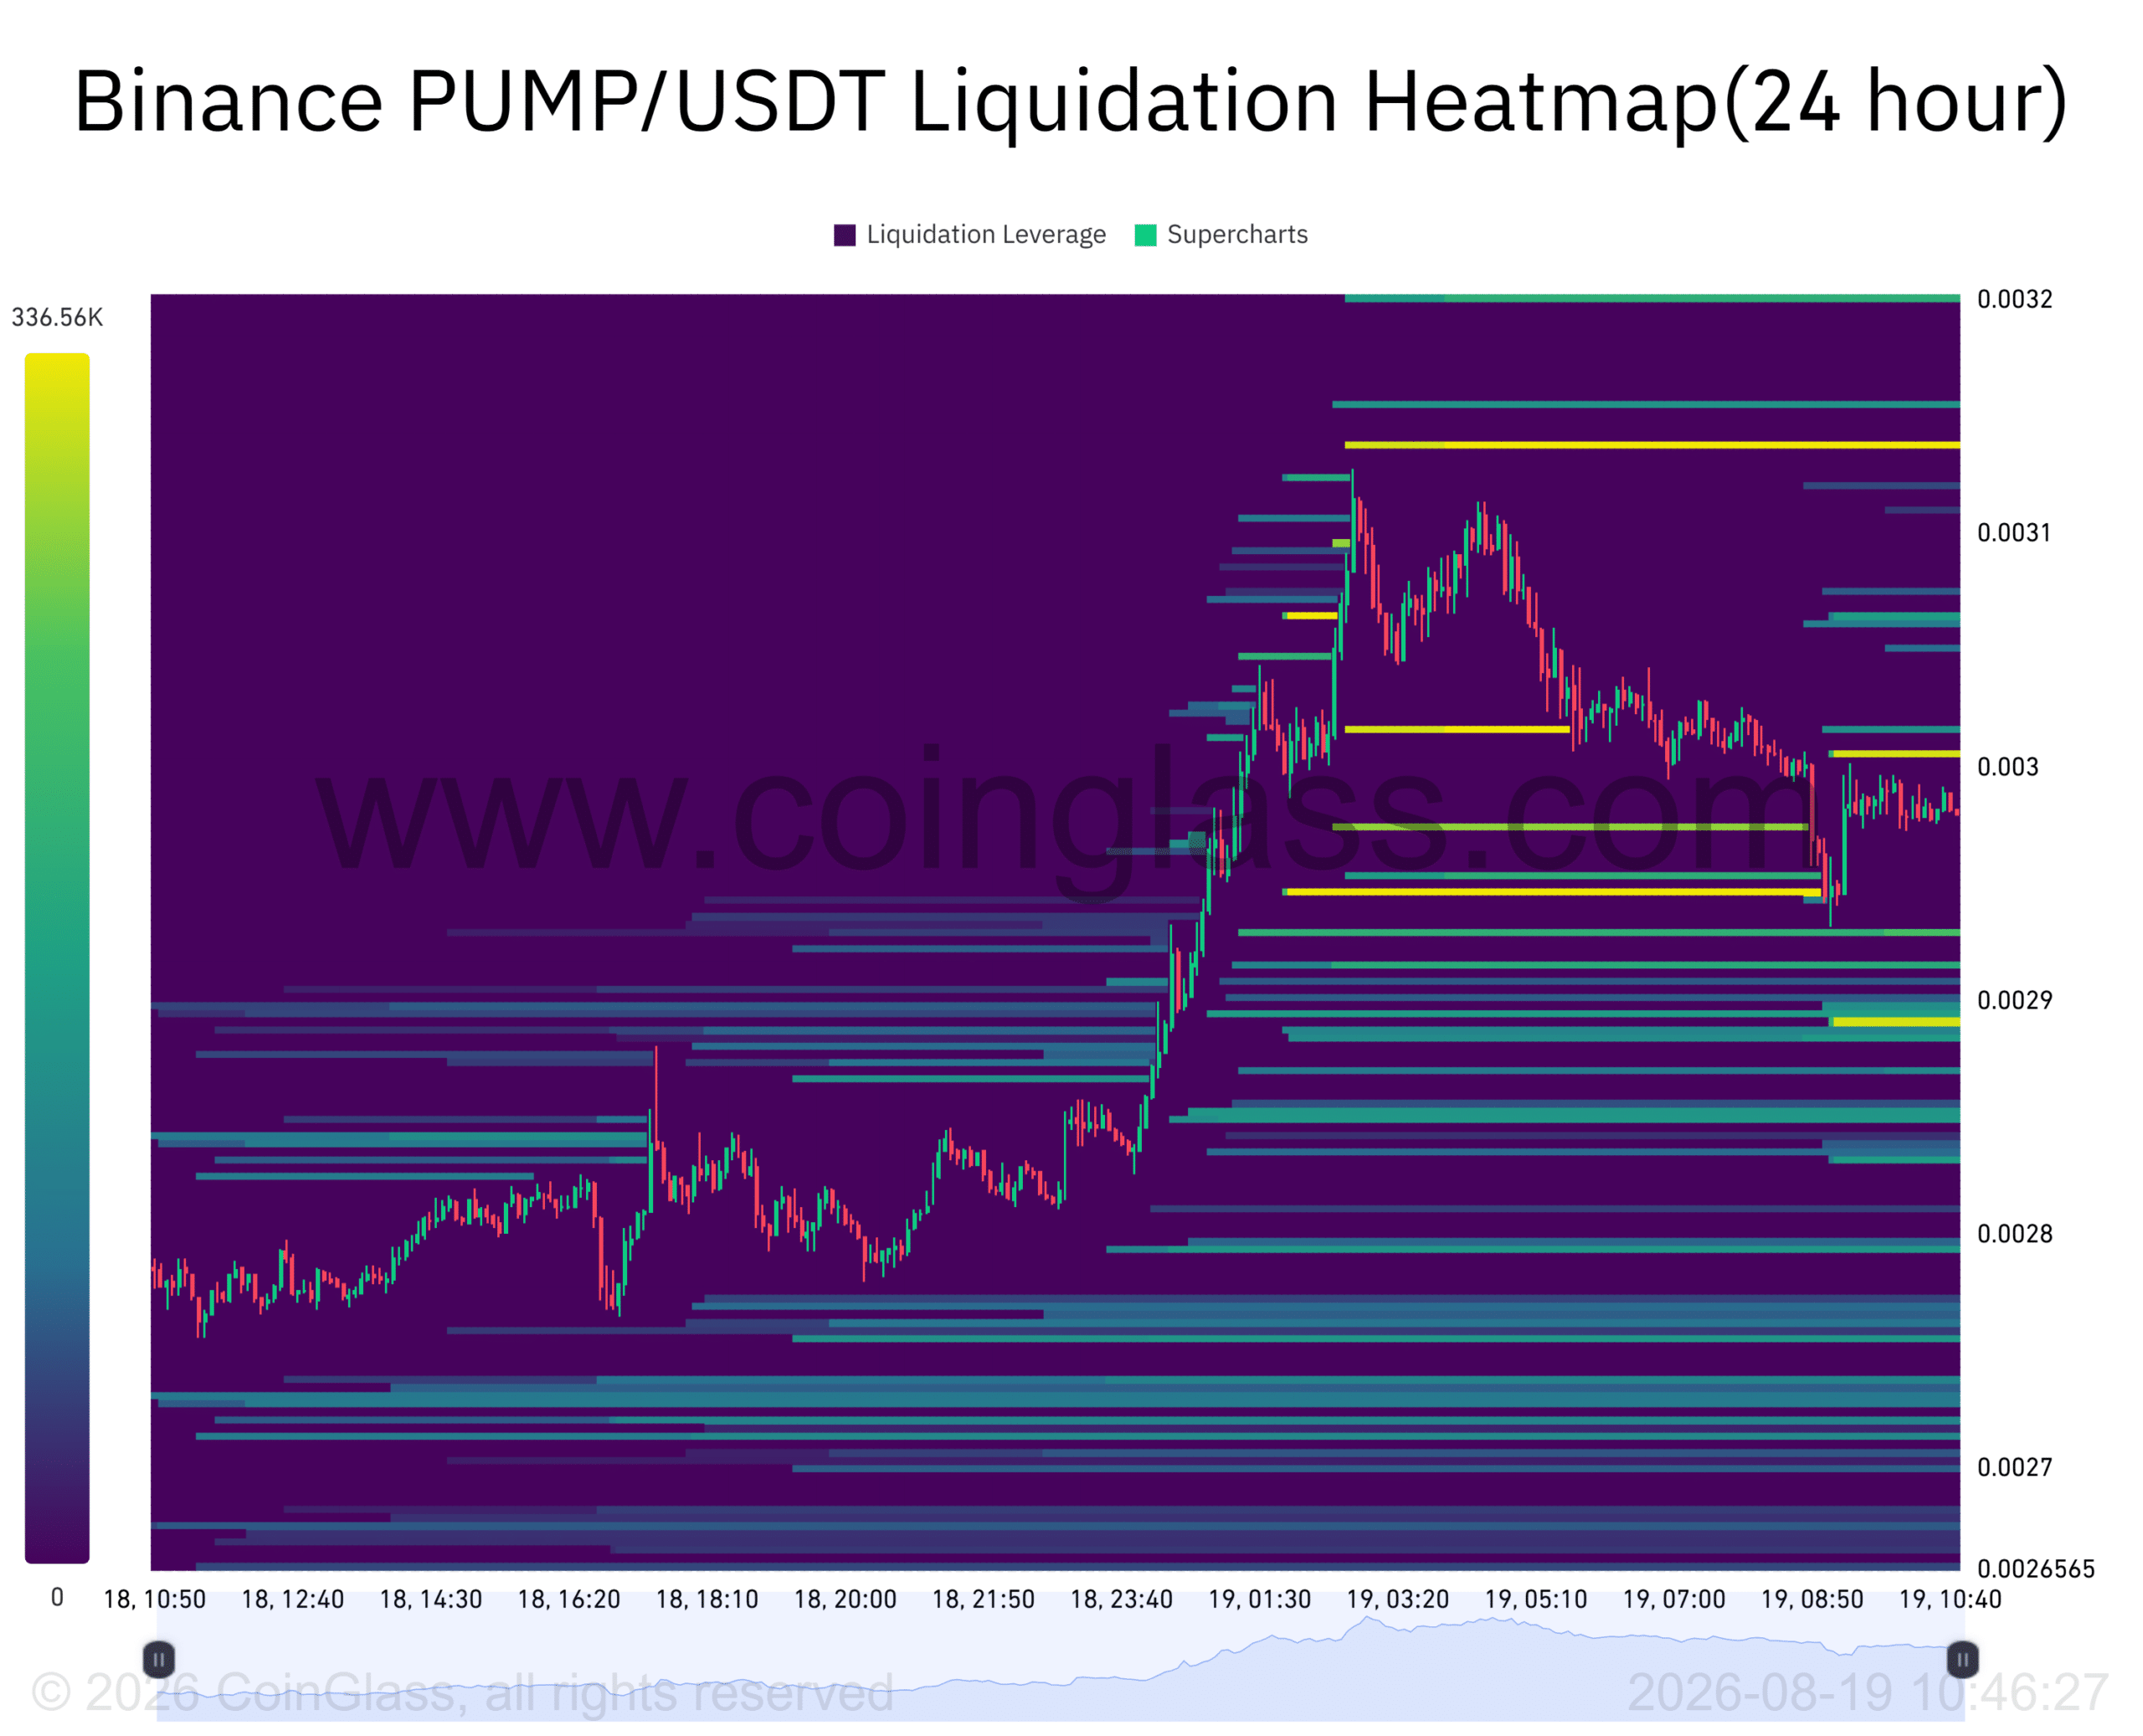
Liquidation positioning added another bullish factor since liquidity was heavily skewed to the upside of PUMP’s current market price. The Liquidation Heatmap showed significant liquidations around $0.00300 and close to $0.003150. 

Contrastingly, liquidity at $0.002895 was relatively low with a significantly lower downside concentration. Therefore, the liquidation map created a stronger overhead liquidity imbalance than the structure below price. 

A renewed price advance could draw prices toward those upper concentrations as leveraged positions faced increasing pressure. The $0.003150 area was also very close to the chart’s $0.003128 resistance, further reinforcing the significance of the $0.0031 area. 

However, buyers would first need to reclaim the $0.00300 level convincingly and sustain pressure around the resistance zone. Success there would likely fuel the liquidation-driven activity and help bolster the whale-driven demand already fueling PUMP.

Source: CoinGlass

Final Summary

  • PUMP’s $6 million whale long and spot outflows keep buyers firmly positioned.
  • Holding $0.002852 could support another push toward $0.003128 and $0.003150.


Source link

Beyond Oil: Record Revenue & U.S. Direct-Sales Expansion Fuel Scaling Phase – Quarterly Update Report

0
Beyond Oil: Record Revenue & U.S. Direct-Sales Expansion Fuel Scaling Phase – Quarterly Update Report


Download the Complete Report Here

Record Revenue and U.S. Direct-Sales Buildout Support Scaling Phase; Enterprise Rollouts and Margin Recovery Shape 2H Setup

  • Key Takeaways:

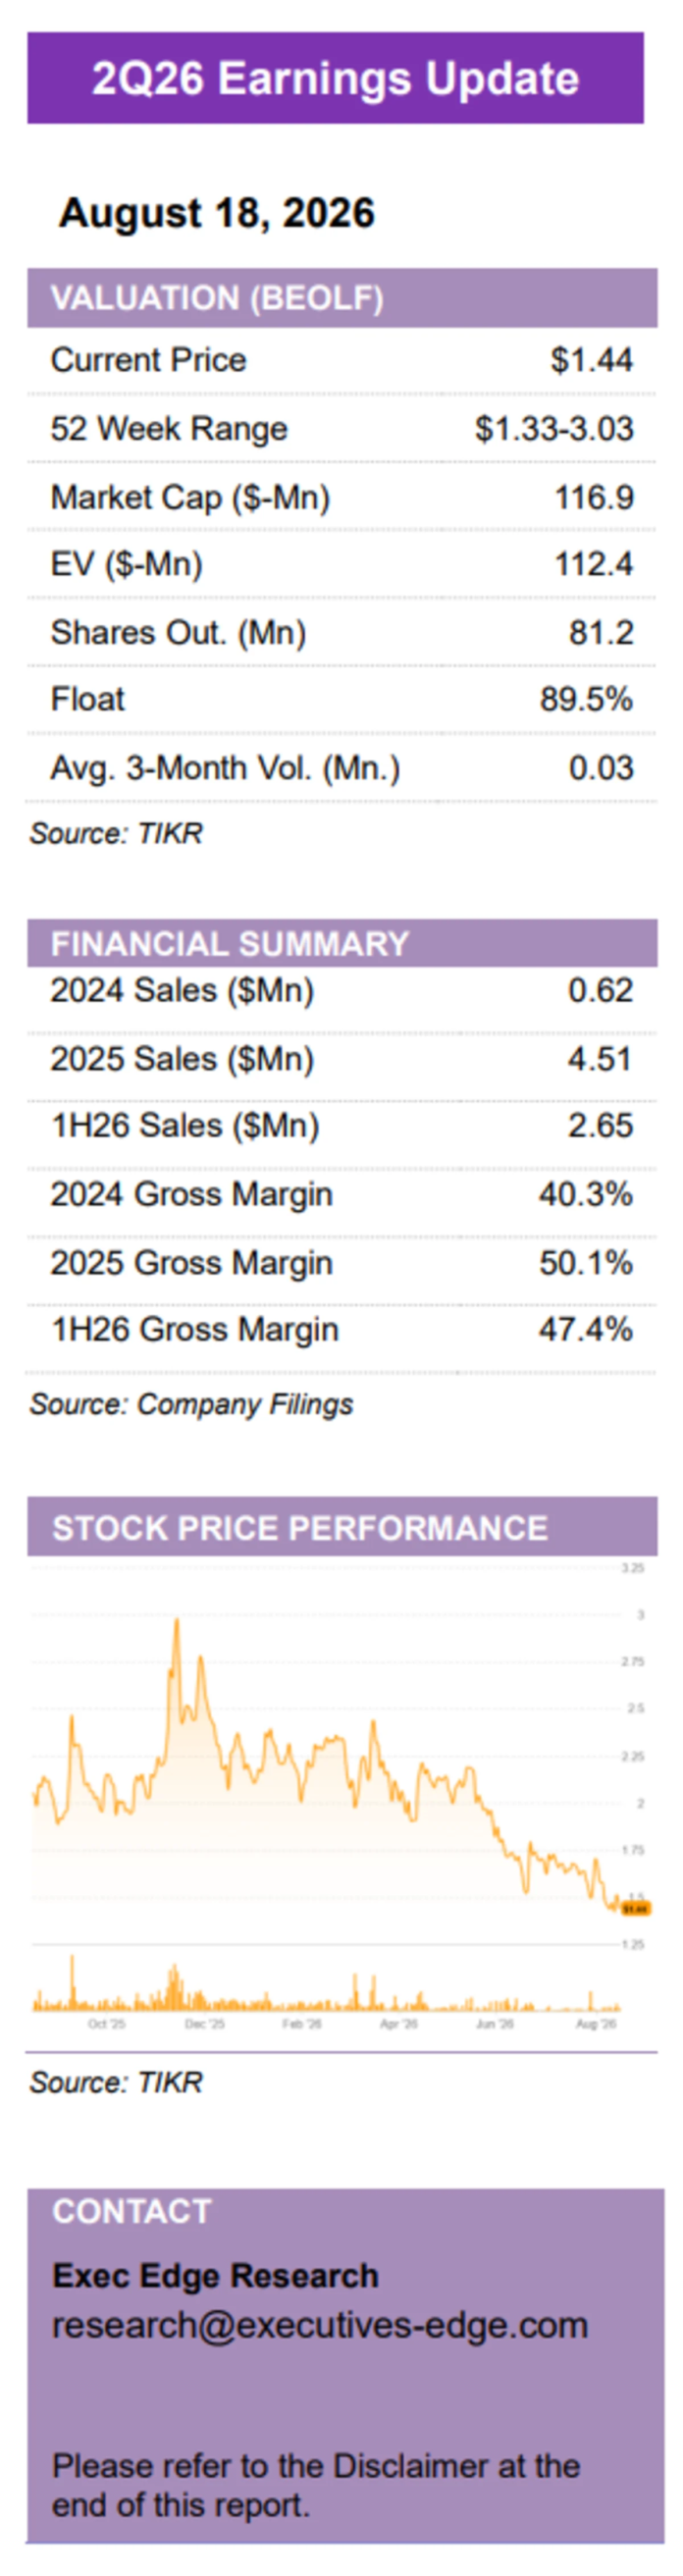
    • 2Q26 revenue of $1.40 million increased 28% y/y and 11% sequentially, lifting first-half revenue 26% to $2.65 million.

    • S. commercial infrastructure is increasingly established, with 100+ validated locations and enterprise opportunities collectively representing thousands of potential customer sites.

    • Gross margin declined to 42.2% from 53.1% q/q, reflecting rollout, inventory and channel-transition costs with improvement expected as direct U.S. sales scale.

    • Supermarket, fast-food, casual-dining and Sysco programs broaden the commercial funnel, while accumulated customer proof points should improve future conversion efficiency and rollout velocity.

    • Valuation upside tied to enterprise conversion, recurring revenue growth and margin recovery.

  • Record revenue and improved sequential growth reinforce BOIL’s transition from commercial platform buildout toward scaled execution. BOIL reported record revenue of $1.4 million in 2Q26, up 28% y/y from $1.1 million and 11% sequentially from $1.3 million in 1Q26, a meaningful acceleration from the ~1% sequential increase reported last quarter. 1H26 revenue reached $2.7 million, up 26% from $2.1 million in 1H25 and equivalent to 59% of full-year 2025 revenue of $4.5 million. The quarter lifts BOIL’s annualized revenue run-rate to ~$5.6 million from roughly $5.0 million entering 2Q26, while BOIL continued to invest in the U.S. direct-sales infrastructure supporting larger strategic customers. We believe the combination of improved sequential revenue growth and broader enterprise activity supports the view that BOIL is moving further into the revenue-execution phase, with broader deployments and recurring consumption representing the next stage of scale.

  • Gross margin moderated as BOIL absorbed early rollout and channel-transition costs, while commercial investment remained focused on supporting U.S. execution. Gross profit was $0.59 million in 2Q26 versus $0.62 million y/y, with gross margin declining to 42.2% from 56.3% in 2Q25 and 53.1% in 1Q26 as inventory and channel mix, early U.S. customer servicing costs, and new-market expansion weighed on profitability. Total operating expenses increased 27% y/y to $3.01 million from $2.37 million, driven primarily by a 63% increase in sales and marketing expense to $1.62 million from $0.99 million as BOIL expanded its U.S. direct-sales team, pilot activity, and customer training. G&A remained relatively stable at $1.16 million versus $1.18 million y/y, while R&D increased modestly to $0.23 million from $0.20 million. The expense mix remains concentrated on commercialization rather than product development, while management expects lower inventory costs and a larger contribution from direct U.S. sales to support gross-profit improvement as deployments scale.


Source link

Jeff Currie: Forget $91 Brent, The Real Crisis Is $170 Diesel

0
Jeff Currie: Forget $91 Brent, The Real Crisis Is $170 Diesel


Brent at $90.94 looks almost civilized. Jeff Currie thinks that is exactly the problem: everyone is staring at crude while the real energy shock is already showing up in the fuels people actually buy.

“Nobody on the planet earth consumes crude oil,” Currie told CNBC. Refineries do. Everyone else consumes gasoline, diesel and jet fuel, and those markets look considerably uglier.

European diesel was trading around $170 per barrel during the interview, Currie said, almost twice Brent’s current $90.94. WTI was trading at $84.94 Tuesday.

Historically, crude and refined-product prices moved closely enough that crude served as a reasonable shorthand for the broader energy market. Currie says that relationship has broken down.

Part of the disconnect came from roughly 100 million to 120 million barrels of crude trapped inside the Strait of Hormuz following a surge in supplies in late June and early July. China then cut refinery runs, which helped keep crude prices softer but made product supplies tighter.

In other words, China did not solve the shortage. It moved it downstream.

Currie also argues governments have spent decades creating an “illusion of abundance” during supply disruptions by releasing strategic reserves and talking markets down. That strategy has worked before. This disruption, he said, is different because of its scale, duration, and the increasingly tight product market.

The inflation implications are considerably less academic. CNBC noted that gasoline prices are about 30% higher than a year ago, while diesel is up 46%. Diesel feeds directly into trucking, shipping and industrial costs.

Currie expects the crude-product dislocation to eventually correct as refiners chase historically high margins and increase runs.

Until then, $91 Brent may be giving investors a comforting picture of an oil market that consumers stopped living in weeks ago.

By Julianne Geiger for Oilprice.com

More Top Reads From Oilprice.com

Oilprice Intelligence brings you the signals before they become front-page news. This is the same expert analysis read by veteran traders and political advisors. Get it free, twice a week, and you’ll always know why the market is moving before everyone else.

You get the geopolitical intelligence, the hidden inventory data, and the market whispers that move billions – and we’ll send you $389 in premium energy intelligence, on us, just for subscribing. Join 400,000+ readers today. Get access immediately by clicking here.


Source link

Centrifuge crypto falls 14% as RWA demand slumps – Can CFG rebound?

0
Centrifuge crypto falls 14% as RWA demand slumps - Can CFG rebound?


Centrifuge [CFG] declined more than 14% in the past 24 hours at press time, extending the double-digit decline in market cap over the past week. The daily trading volume increased, supporting the selling pressure experienced across multiple altcoins.

However, the sharper decline in CFG points to a coin-specific weakness with its real-world asset (RWA) niche.

Centrifuge’s RWA sees negative sentiment

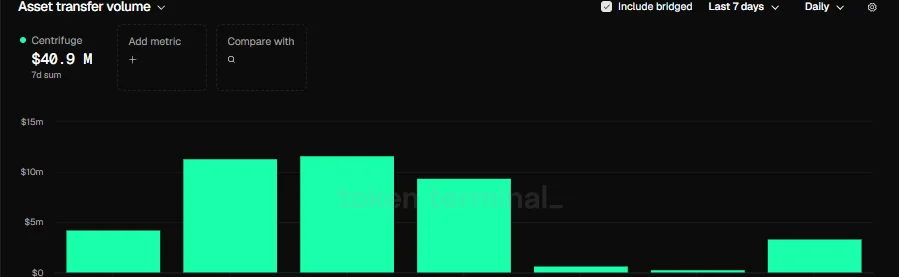
As per data from Token Terminal, Centrifuge’s RWA activity declined on multiple fronts.

For instance, the Monthly Asset Transfer Volume on the chain fell by 10%. This week alone, the metric has decreased from a peak of $11.67 million to $281K, indicating very low usage of the ecosystem in the RWA sector.

Additionally, the Monthly Asset Transfer Count lost more than 58% of its share. Since the start of August, this count has plummeted from 6.7K to 2.2K, representing a 67% loss.

CentrifugeCFG
Source: Token Terminal

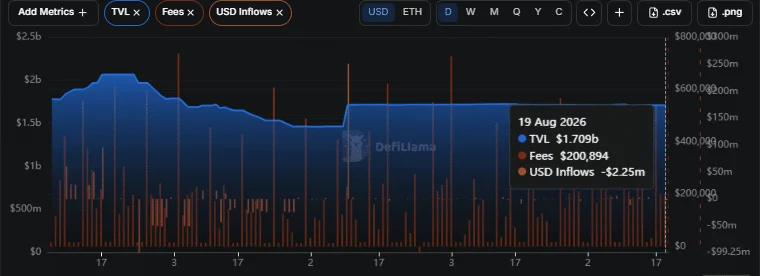
Apart from its RWA niche’s underperformance, CFG faced a broader, weaker altcoin market. To be specific, the Centrifuge ecosystem saw net USD outflows of more than $2.25 million.

CFGCFG
Source: DefiLlama

Moreover, the Total Value Locked (TVL) was flat at around $1.709 billion after a sharp drop from its highs attained when the RWA narrative was thriving. The TVL of CFG in April was above the $2 billion mark.

Furthermore, the activity on the chain was low, evident from the fees generated. As per DefiLlama, the ecosystem generated about $200.9K in the past 24 hours as of writing.

Will CFG price crash lower?

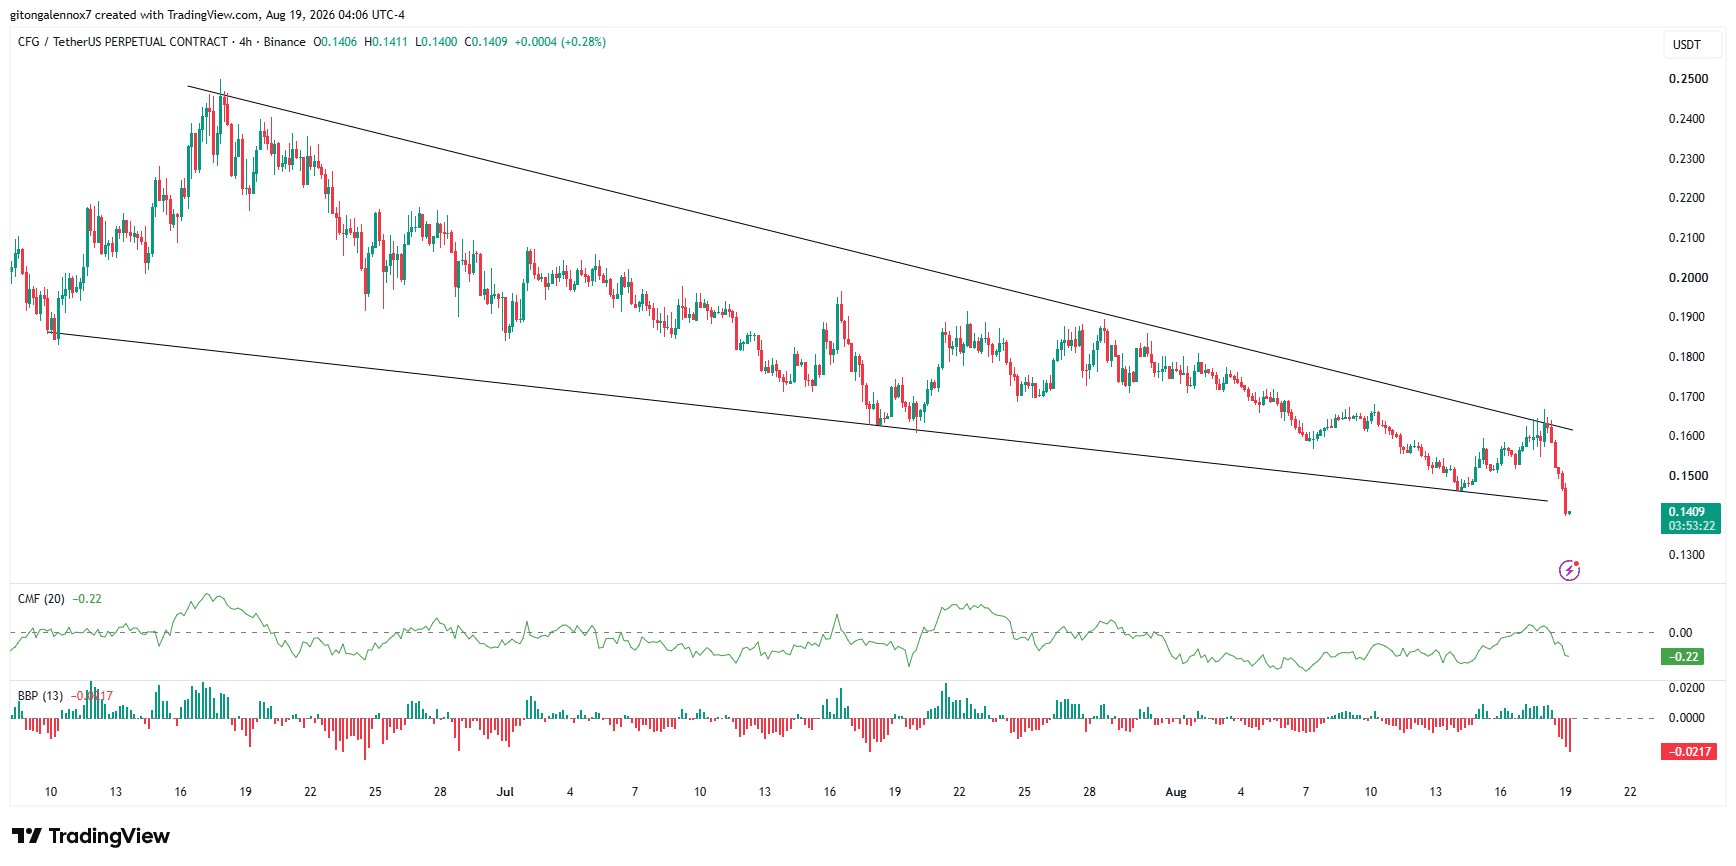
Even the market structure of CFG was bearish since mid-July.

The altcoin was falling inside a wedge pattern and broke below the lower trendline support. Over the past 24 hours, the CFG price has fallen from $0.1672 to $0.1379 as of writing.

Momentum indicators reinforced the bearish control with the reading of Bull Bear Power (BBP) bars at -0.0243. Moreover, Chaikin Money Flow (CMF) crashed to -0.22, indicating capital flight.

CentrifugeCFGCentrifugeCFG
Source: CFG/USDT on TradingView

Looking at the market structure and overall RWA sentiment, CFG may continue dipping. It could even lose its all-time low (ATL) at $0.06712.

However, the altcoin is closer to $0.1257, which is the demand zone that pushed it to a peak value of $0.3497. This level could be the start of a recovery if bulls return.


Final Summary

  • Centrifuge fell by more than 14% in the past 24 hours as multiple fronts affected its RWA niche. 
  • CFG price has been falling inside a wedge pattern, with indicators suggesting it could be just the beginning. 


Source link

Gold prices today, Wednesday, August 19, 2026: Gold strengthens ahead of FOMC minutes release

0
Gold prices today, Wednesday, July 8, 2026: Gold prices falling following U.S.-Iran airstrikes


Gold (GC=F) December futures opened at $4,391.40 per troy ounce on Wednesday, August 19, 2026, down 0.7% from Tuesday’s closing price. The price of gold is up this morning at $4,479.90 per troy ounce as of 8:53 a.m. ET.

Gold opened lower Wednesday morning but rose in early trading as the U.S. dollar and Treasury yields pulled back slightly. The U.S. Dollar Index (DX-Y.NYB) was down 0.2%, while the benchmark CBOE Interest Rate 10 Year T No (^TNX) declined 0.4%. The 10-year yield still remains near its 12-month high, achieved on July 31.

Weakness in the U.S. dollar precedes the release of the FOMC’s minutes from the July meeting. Investors will evaluate the minutes for hints on the Fed’s short-term outlook for interest rates. That outlook is complicated by the ongoing conflict in the Middle East driving inflation risk, coupled with recent softness in retail sales.

CME FedWatch estimates a 67.4% probability that the Fed will not change interest rates at the September meeting. A rate increase pressures the gold price by making yield-bearing assets look more attractive in comparison. The opposite is also true. Gold has gained more than 10% over the last three weeks as rate-hike expectations have declined.

The opening price of gold futures on Wednesday, August 19, 2026, was down 0.7% from Tuesday’s closing price. Here’s a look at how the opening gold price has changed versus last week, month, and year:  

  • One week ago: -0.3%

  • One month ago: +10.5%

  • One year ago: +31.9%

For context, the one-year gain for gold was 95.6% on Jan. 29.

24/7 gold price tracking: Don’t forget you can monitor the current price of gold on Yahoo Finance 24 hours a day, seven days a week. 

Want to learn more about the current top-performing companies in the gold industry? Explore a list of the top-performing companies in the gold industry using the Yahoo Finance Screener. You can create your own screeners with over 150 different screening criteria.

If you’re looking for a gold alternative, Yahoo Finance also tracks the daily price of silver (SI=F) and the daily price of bitcoin (BTC-USD) and ethereum (ETH-USD).

Learn more: Gold alternatives? How to invest in silver, platinum, and palladium.

There are different ways to invest in gold, and each has pros and cons. Four common options are:  

  1. Physical gold

  2. Gold mining stocks

  3. Gold ETFs

  4. Gold futures

Physical gold includes jewelry, gold bars, and gold coins. Some prefer physical gold over other forms because it’s tangible and easy to purchase. You can easily buy a gold necklace at the mall or gold bars at Costco (COST). 

Intrigued by Costco’s precious metals offering? Read more here to learn key considerations for precious metals investing, the details of the Costco selection, and tips for managing your new investment.

Physical gold pros and cons

 The advantages of physical gold include:

  1. Readily accessible for use: If you keep your physical gold at home, it is easily available to use as a medium of exchange in an economic emergency.

  2. No added volatility or ongoing fees: If you hold the gold yourself, “you eliminate counterparty risk and storage fees or expense ratios,” explained Brett Elliott, director of content and SEO at American Precious Metals Exchange (APMEX). You also avoid the added business volatility associated with gold mining stocks, as explained below. 

Learn more: Take a deeper dive into the gold sector

The disadvantages of physical gold include:

  1. Risk of theft or loss: Physical gold must be properly secured. You can store it at home for free, or invest in third-party storage and insurance. Remember that fees associated with storage or insurance dilute your returns.   

  2. Lower liquidity: Physical gold is less liquid — that is, harder to sell quickly — than stocks or ETFs. Also, if you are not using the gold as a medium of exchange, you must find a dealer and pay a markup on the sale.

Learn more: How to invest in gold in 4 steps

Gold mining stocks are equity positions in gold miners. They can be volatile because their profits are tied to gold prices, plus these companies are heavily exposed to “geopolitical risks and management risks” according to Vince Stanzione, CEO and founder at financial publisher First Information. To manage the volatility, many investors prefer diversified gold mining funds over individual mining stocks. 

Gold mining stocks pros and cons

The advantages of gold mining stocks include:

  1. Greater liquidity: Large-cap gold mining stocks like Barrick Gold Corporation (B) and Franco-Nevada Corporation (FNV) generally enjoy a narrow bid-ask spread, which is a sign of liquidity. The bid-ask spread is the difference between what buyers will pay and what sellers will accept.

  2. No storage requirements: Stocks live in your brokerage account and do not consume physical space. In normal times, this is an advantage. In an economic catastrophe, this could be a disadvantage if brokers or the stock market are temporarily shut down.

Learn more: The top-performing companies in the gold industry

The disadvantages of owning gold mining stocks include:

  1. Greater volatility: “Gold investing through gold mining companies adds another layer of risk,” explained Thomas Winmill, portfolio manager at mutual fund company Midas Funds. From 2000 to 2020, gold mining stocks have risen and fallen faster than gold spot prices. In recent years, gold mining stocks have trended down as gold spot prices have gained value.

  2. No utility as a medium of exchange: Gold mining stocks can appreciate, but they have no direct utility as a medium of exchange.

Learn more: Who decides what gold is worth? How gold prices are determined.

Gold ETFs are funds that track the price of gold. They can invest in physical gold stores, gold mining stocks, gold futures, or some combination of these. The largest gold ETF in terms of total assets is SPDR Gold Shares (GLD), which is backed by physical gold stored in vaults. 

Gold ETFs pros and cons

The advantages of Gold ETFs include:

  1. Easy to store: Like gold mining stocks, ETF shares are digital assets with no storage requirements.

  2. Greater liquidity: Shares of the most popular gold ETFs, like SPDR Gold Shares (GLD) and iShares Gold Trust (IAU), are heavily traded. Steady demand makes them easy to sell.  

  3. Tied directly to gold prices: ETFs backed by physical gold track the spot price of gold, which is usually less volatile than gold mining stocks or gold mining ETFs.

Learn more: Gold IRA: Benefits, risks, and how it differs from a traditional IRA

The disadvantages of gold ETFs include:

  1. Fund fees: Funds charge fees, which dilute returns over time. For context, the expense ratio of SPDR Gold Shares is 0.40%. This translates to $4 in fees annually for every $1,000 invested.

  2. No utility as a medium of exchange: As with gold mining stocks, you probably cannot use ETF shares to trade for food in an economic emergency.

Gold futures are standardized contracts to purchase gold on a future date at a specific price. The contracts often represent 100 troy ounces. According to Stanzione, among gold investing options, gold futures carry “the highest risk and are best left to professional traders.” 

Learn more: Gold alternatives? How to invest in silver, platinum, and palladium.

Gold futures pros and cons

The advantages of gold futures are: 

  1. Leverage: You can control a large amount of gold with a low capital outlay. 

  2. Convenience: You don’t need to store physical gold to earn from its price changes.

The disadvantages of investing in gold futures are: 

  1. Risk: Leverage amplifies gains and losses. This is always risky, but especially so with an unpredictable asset like gold.  

  2. Complexity: The complexity of futures contracts can be off-putting to many retail investors. 

Learn more: Thinking of buying gold? Here’s what investors should watch for.

Whether you’re tracking the price of gold since last month or last year, the price-of-gold chart below shows the precious metal’s value journey so far this year. 


Source link