It’s easy to look at the child of a celebrity or power couple and see the leg up their family’s wealth, power, and connections got them in their own separate venture or company. And it’s even easier to label them a nepo baby when they benefit from their parent’s money and clout. But the nepo baby trend may extend beyond Hollywood, touching the lives of everyday Americans.
In other words, it’s increasingly obvious that who your parents are has become a more reliable predictor of your wealth than what you actually do for a living.
According to a new working paper from the National Bureau of Economic Research, there’s a growing rift between income and wealth generation. For decades, the American Dream was predicated on the fact that hard work and a decent income would lead to homeownership. But the research finds that high earnings no longer correlate directly with wealth generation. Rather, it matters more so today what assets your family owns.
“Those that come from wealthier families that are maybe able to achieve those other economic goals—wealth building, homeownership—I think also could play into a sentiment of a sort of unfairness in the economy,” Max Risch, one of the study’s co-authors and an assistant professor at Carnegie Mellon University, told Fortune.
Even as Wall Street hits successive record highs, Americans are feeling worse and worse about the economy. An April Ipsos poll found that 61% of Americans today feel the economy is on the wrong track. Meanwhile, the May consumer sentiment index hit the lowest level since the University of Michigan started tracking the metric in 1952, lower than during the COVID pandemic and aftermath of the Great Recession. And that may be because even when workers secure steady if not high-paying jobs, they’re increasingly locked out of securing assets to generate wealth.
The resilient value of the ‘Bank of Mom and Dad’
The researchers leveraged a dataset of 3.4 million families and their wealth and income records across multiple generations to track how money moves geographically and cross-generationally. One of the most surprising findings, Risch said, was that earnings were only able to explain about half of the intergenerational inequality in housing.
The data shows that even with identical incomes, a child of wealthier parents is substantially more likely to own a home than one without wealthy parents. Of course, there are other ways Americans amass wealth outside of homeownership. But Risch notes that for the bottom 95% of earners, nearly all wealth is tied to housing and pensions.
“It’s very consistent with the parents being able to help overcome these financial barriers,” Risch said, “maybe through direct asset transfers, co-signing a loan, putting a down payment.”
This tracks with the findings of a recent Northwestern Mutual report. More parents today are stepping in, or thinking about helping their kids secure keys to a home. The study also found that some parents are even prioritizing saving for a down payment than for a college degree.
Homeownership becomes a fading dream
Higher incomes simply aren’t able to make the cut. A recent report from Harvard’s Joint Center for Housing Studies found that home prices have surged to five times the median income nationally, nearing historic highs. In some metros, including Los Angeles and San Francisco, home prices are more than 10 times the median income.
Risch looks west to illustrate why, even with a steady income today, it’s harder to climb up the wealth generation ladder. The study found California has some of the highest upward mobility in terms of income, meaning there’s ample opportunity for workers to move up a tax bracket or two thanks to the jobs offered in the state. But it turns out moving west to strike gold has its limitations. The state is one of the worst parts of the country for upward mobility of homeownership. Even with a high-paying job, most are locked out of homeownership in the Golden State, except those with wealthy parents. Americans in other metro hubs face the same barriers in turning a paycheck into property, from New York to Chicago to Houston.
Those stark geographical differences are something Risch said parents may consider when thinking about their kids’ future well-being.
“There are these sort of tradeoffs that families have to make either when they’re thinking about where to live, when they’re thinking about how to set up their children for economic success,” he said.
Bitcoin (BTC-USD) opened at $75,829.41 on Wednesday, down 1.9% from Tuesday’s opening price. The price of bitcoin as of 9:21 a.m. ET fell further to $75,216.
Ethereum (ETH-USD) opened at $2,071.07 on Wednesday, also 1.9% lower than Tuesday’s opening price. Ethereum slid this morning, valued at $2,068 as of 9:21 a.m. ET.
Bitcoin and ethereum prices have opened lower this morning, and values continue to edge downward. Investors are processing the latest developments between the U.S. and Iran, with market observers hopeful that both sides are nearing a resolution and shipping can once again resume in the Strait of Hormuz. Even if the two sides reach an agreement, the consensus is that oil prices (BZ=F) will remain elevated for some time. Crypto investors have clearly been assessing risk levels and holding back for the time being.
The price of bitcoin this morning was 1.9% lower than the day before. Here’s a look at how the opening bitcoin price has changed versus last week, month, and year:
One week ago: -1.2%
One month ago: -3.6%
One year ago: -30.7%
The all-time high for bitcoin was $126,198.07 on Oct. 6, 2025. The all-time low value for bitcoin was $0.04865 on July 14, 2010.
Ethereum
The price of ethereum this morning was 1.9% lower than it was early Tuesday. Here’s a look at how the opening ethereum price has changed versus last week, month, and year:
One week ago: -1.8%
One month ago: -12.6%
One year ago: -19.2%
The all-time high for ethereum was $4,953.73 on Aug. 24, 2025. The all-time low value for ethereum was $0.4209 on Oct. 21, 2015.
You generally owe taxes when you sell cryptocurrency for more than you paid for it. This also applies when you exchange one digital asset for another. Converting bitcoin into ethereum, for example, isn’t “just a trade” in the eyes of the IRS. It’s a taxable event if the value changes.
Crypto taxes aren’t paid at the time of the transaction, but instead, they’re reported on your tax return for the year in which the transaction took place. So, if you sold crypto for a profit at any point during 2025, that activity is reported when you file your 2025 return in early 2026.
How much tax you pay depends on two main factors:
How long you held the asset before selling
Your overall taxable income and filing status
Hold it for less than a year, and you’ll usually face higher rates. Hold it longer, and the rates tend to be lower.
This holding-period distinction matters more than most people realize. A few days can make a difference of as much as 17% or more — so timing matters.
Whether you’re brand new to tracking the value of bitcoin and ethereum or a more seasoned crypto investor, Yahoo Finance’s price-of-bitcoin and price-of-ethereum charts below show a visual history of how the currencies’ value continues to move and evolve.
The GENIUS Act Repriced Bitcoin’s Monetary Premium
– By Ravi Tanuku, managing member & general partner at Natural Capital & Director at Krakacquisition Corp.
Gold has outperformed Bitcoin by nearly 100% since July 18, 2025. Same macro environment. Opposite outcomes.
The usual explanations don’t survive the simplest question: if this is just a cycle top, why is gold still working?
Bitcoin didn’t break because of cycles, sentiment or quantum risk. It broke because the U.S. government built a better version of what Bitcoin provided to millions around the world, and signed it into law on that date. The GENIUS Actregulated stablecoins with 100% reserves in U.S. dollars or Treasuries. In doing so, it created a government-sanctioned alternative to Bitcoin, in effect shifting “digital dollar” demand from Bitcoin to stablecoins.
Chart: Normalized performance of bitcoin (XBTUSD) vs Gold (XAU), in BGN. Source: Bloomberg.
What bitcoin was actually used for
The standard framing is that bitcoin has three use cases: dollar access, digital gold and speculation. Most of the discourse focuses on the latter two. The adoption data points somewhere else.
According to Chainalysis, the top crypto-adopting countries are Nigeria, Vietnam, Turkey, Argentina and Ethiopia. The common thread isn’t speculation or sound money ideology. It’s capital controls and currency depreciation against the dollar.
That pattern suggests bitcoin’s dominant real-world function was as an alternative dollar access point for consumers and businesses whose governments restricted it. Speculative flows and institutional vehicles like ETFs can be larger in dollar terms at any given moment. But dollar access was the most consistent secular demand. It was the structural bid that gave bitcoin its floor and its long-running relationship with global M2 money supply.
Chart: Bitcoin vs global M2 money supply. Source: Bloomberg.
The risk-adjusted data make this concrete. Since the November 2021 cycle peak, a buyer in Nigeria, Turkey, Ethiopia or Vietnam who held bitcoin spent 26 of the next 52 months underwater relative to someone who simply held U.S. dollars. Both delivered strong absolute returns in local currency terms: bitcoin returned 275%, dollars returned 172%. But bitcoin’s annualized volatility was 68% versus 18% for dollars, producing a Sharpe ratio of roughly 0.5 compared to 1.5 for just holding USD. Bitcoin’s maximum drawdown was 66%. The dollar holder’s was 6%.
Chart: Bitcoin vs dollars in emerging markets, indexed from Nov 2021 cycle peak. Source: Bloomberg.
These buyers weren’t making a speculative bet on digital gold. They were trying to hold dollars. bitcoin was the best available wrapper, but the returns accrued to the dollar exposure, not to bitcoin specifically. A regulated stablecoin captures the same currency depreciation tailwind without the drawdowns.
The migration was already underway before the GENIUS Act. According to Artemis, B2B stablecoin payments surged 30x to over $3 billion monthly by early 2025, with cross-border settlement as the primary driver. The Act accelerated a shift that was already visible.
Chart: Gold vs bitcoin (scaled) vs stablecoin supply (market cap), with GENIUS Act passage marked. Source: author chart data from Bloomberg.
Then the macro gave us a clean test of the digital gold thesis. In late 2025, cyclical reacceleration built across the real economy. Commodities rallied. Gold, silver and copper made new highs through January 2026. Bitcoin sold off alongside SAAS stocks and unprofitable tech. By fourth quarter 2025, its quarterly correlation with IGV hit +0.64, the tightest since the 2022 bear market.
In this cycle, the market did not treat bitcoin as a monetary hedge.
The test ahead
The CLARITY Act aims to regulate bitcoin as a commodity. That classification could matter. Right now Bitcoin sits in regulatory limbo that makes it hard for institutional allocators to slot it into commodity portfolios alongside gold and silver. Formal commodity status changes the compliance conversation, creates index inclusion logic and gives pension funds and endowments a framework to allocate.
The GENIUS Act may have impaired the dollar access use case permanently. CLARITY could revive the digital gold thesis under a new regulatory identity.
The test isn’t whether bitcoin rallies post-CLARITY. Any oversold asset can bounce on a catalyst. The test is the correlation regime. Within one to two quarters of CLARITY’s passage, does Bitcoin begin recoupling with gold? Or does it continue trading with long-duration growth?
There’s an irony here. The crypto industry spent years lobbying for regulatory clarity. The first major regulation formalized a competitor that made bitcoin’s core function obsolete. Whether the second major regulation gives it a new structural identity or confirms the old one is gone is the open question.
Watch what bitcoin trades with, not where it trades. The correlation regime will be the signal.
Principled Perspectives
Looped ETH Staking Without Lending Market Exposure
Most leveraged staking strategies on Ethereum follow the same playbook: deposit ETH, receive a liquid staking token, borrow against it on a lending protocol and repeat. It works — until it doesn’t. Liquidation risk, variable borrow rates and smart contract exposure across multiple protocols make the approach fragile at institutional scale.
There is a simpler path. One that captures a comparable yield without ever touching a lending protocol.
The rates and the spread
Native Ethereum validator staking currently yields approximately 2.9% APY. Lido’s stETH — the largest liquid staking token — yields approximately 2.4%. The gap exists because Lido socialises rewards across all stETH holders, including ETH that is sitting idle in entry and exit queues earning nothing. The more queue activity there is, the wider the spread.
That rate differential varies but recently hit 50 basis points. The rate differential is the foundation of this strategy.
How it works
Strategy execution leverages Lido V3 staking vaults and Northstake’s Staking Vault Manager to capture the rate differential and loop it. A vault operator stakes ETH natively on Ethereum validators, earning the full ~2.9% APY. You then mint stETH against that staked position – not by borrowing, but through Lido’s native minting mechanism within the stVault. The minted stETH is exchanged for staked ETH, which can be consolidated back into the vault’s validators via EIP-7251 consolidation. Each loop adds exposure. Minted stETH can also be exchanged for liquid ETH and staked in the stVault, however, this makes it subject to the entry queue.
At ten loops, the strategy delivers approximately 6.6% APY — roughly double the base staking rate. A 6.94% liquidity buffer is maintained as a reserve. The full position can be unwound as fast as the validator exit queue, currently sitting at around eight days, or immediately by depositing stETH back into the vault to bring down vault liability, while ETH is unstaking.
Crucially, no lending protocol is involved. The leverage is structural, created entirely by leveraging the rate differential of stETH within Lido’s vault architecture. There are no liquidation thresholds, no variable borrow costs, and no counterparty dependency on a lending market.
Example: Uses wstETH (non-rebasing version of stETH) and assumes secondary market as opposed to consolidation.
The risks are real but known
Duration risk is the primary consideration. Initial seed capital must pass through the validator entry queue, currently around 56 days. Subsequent scaling uses validator consolidation rather than the queue, but full deployment still takes 60–76 days depending on consolidation cycles.
Validator underperformance or slashing events can erode the spread. If the rate differential compresses, additional loops can be added; if it widens uncomfortably, the position can be reduced by partially unstaking.
Crucially, you can always redeem 1 stETH for 1 ETH with Lido. A depegging of stETH does not create a negative carry, due to the mechanics of how Lido’s stVaults manages vault liability. In the worst case, should the stVault liability become unhealthy, Lido executes a forced rebalance of the stVault where ETH is unstaked bringing down the liability.
Adding downside protection using CESR
One emerging development worth noting: staking risk insurance products now exist that can guarantee a minimum yield benchmarked to the Composite Ether Staking Rate (CESR), representing the average annualised validator yield. Under these policies, if a validator underperforms relative to CESR due to slashing, technical failure or operational error, the insurer covers the shortfall. For institutional allocators who need yield predictability, this converts the strategy’s variable return profile into something closer to a fixed-income instrument — leveraged staking yield with a guaranteed floor.
Who is this for?
Institutional capital is moving into staking structurally, not speculatively. They are looking for strategies that can deliver enhanced yield without introducing lending-market exposure or adding complexity. For asset managers, this strategy can also help reinforce the liquidity management of staked ETH ETFs.
The spread is there. The infrastructure and tooling to capture it exists.
Headlines of the week
– By Francisco Rodrigues
Institutional crypto kept filling in around the edges this past week as the SEC moved toward tokenized stocks on DeFi and cleared cash-settled bitcoin options for Nasdaq, Prometheum staked out broker-dealer distribution for onchain securities, and prediction markets faced a House Oversight insider-trading probe just as Hyperliquid pushed deeper into the same product line.
Congress hits Polymarket and Kalshi with a massive insider trading probe: House Oversight Chair James Comer sent letters to Shayne Coplan and Tarek Mansour demanding records by June 5 on identity verification, geo-restrictions and unusual-trade detection, after Bubblemaps flagged 80 Polymarket bets with a 98% win rate tied to US military operations.
NEAR Intents fee run-rate holds ~$36 million annualized as price recovers off $1 lows
Weekly fees on NEAR Intents annualized to $36 million as of week ending May 24, holding within a $32–58 million band since late February after peaking at $124 million in mid-November — even as NEAR round-tripped from $3.16 in late September down to a $1.06 low in late February, before recovering to $2.7 at the start of this week
Note: The views expressed in this column are those of the author and do not necessarily reflect those of CoinDesk, Inc., CoinDesk Indices or its owners and affiliates.
AVAX recorded over $35 million in exchange outflows during the past week as accumulation activity intensified across the market.
Whale wallet 0x5D2 alone withdrew nearly $2.2 million worth of AVAX from Coinbase before redistributing 12.82K AVAX and 2.56K AVAX into separate personal wallets.
Retail demand also remained active despite Spot AVAX ETF inflows staying at $0 throughout the period.
This divergence reflected cautious institutional positioning while smaller participants continued absorbing supply from exchanges. As a result, circulating exchange liquidity kept shrinking around current price levels.
Such aggressive outflow behavior often reflects growing holding interest rather than immediate sell-side intent across the broader market structure.
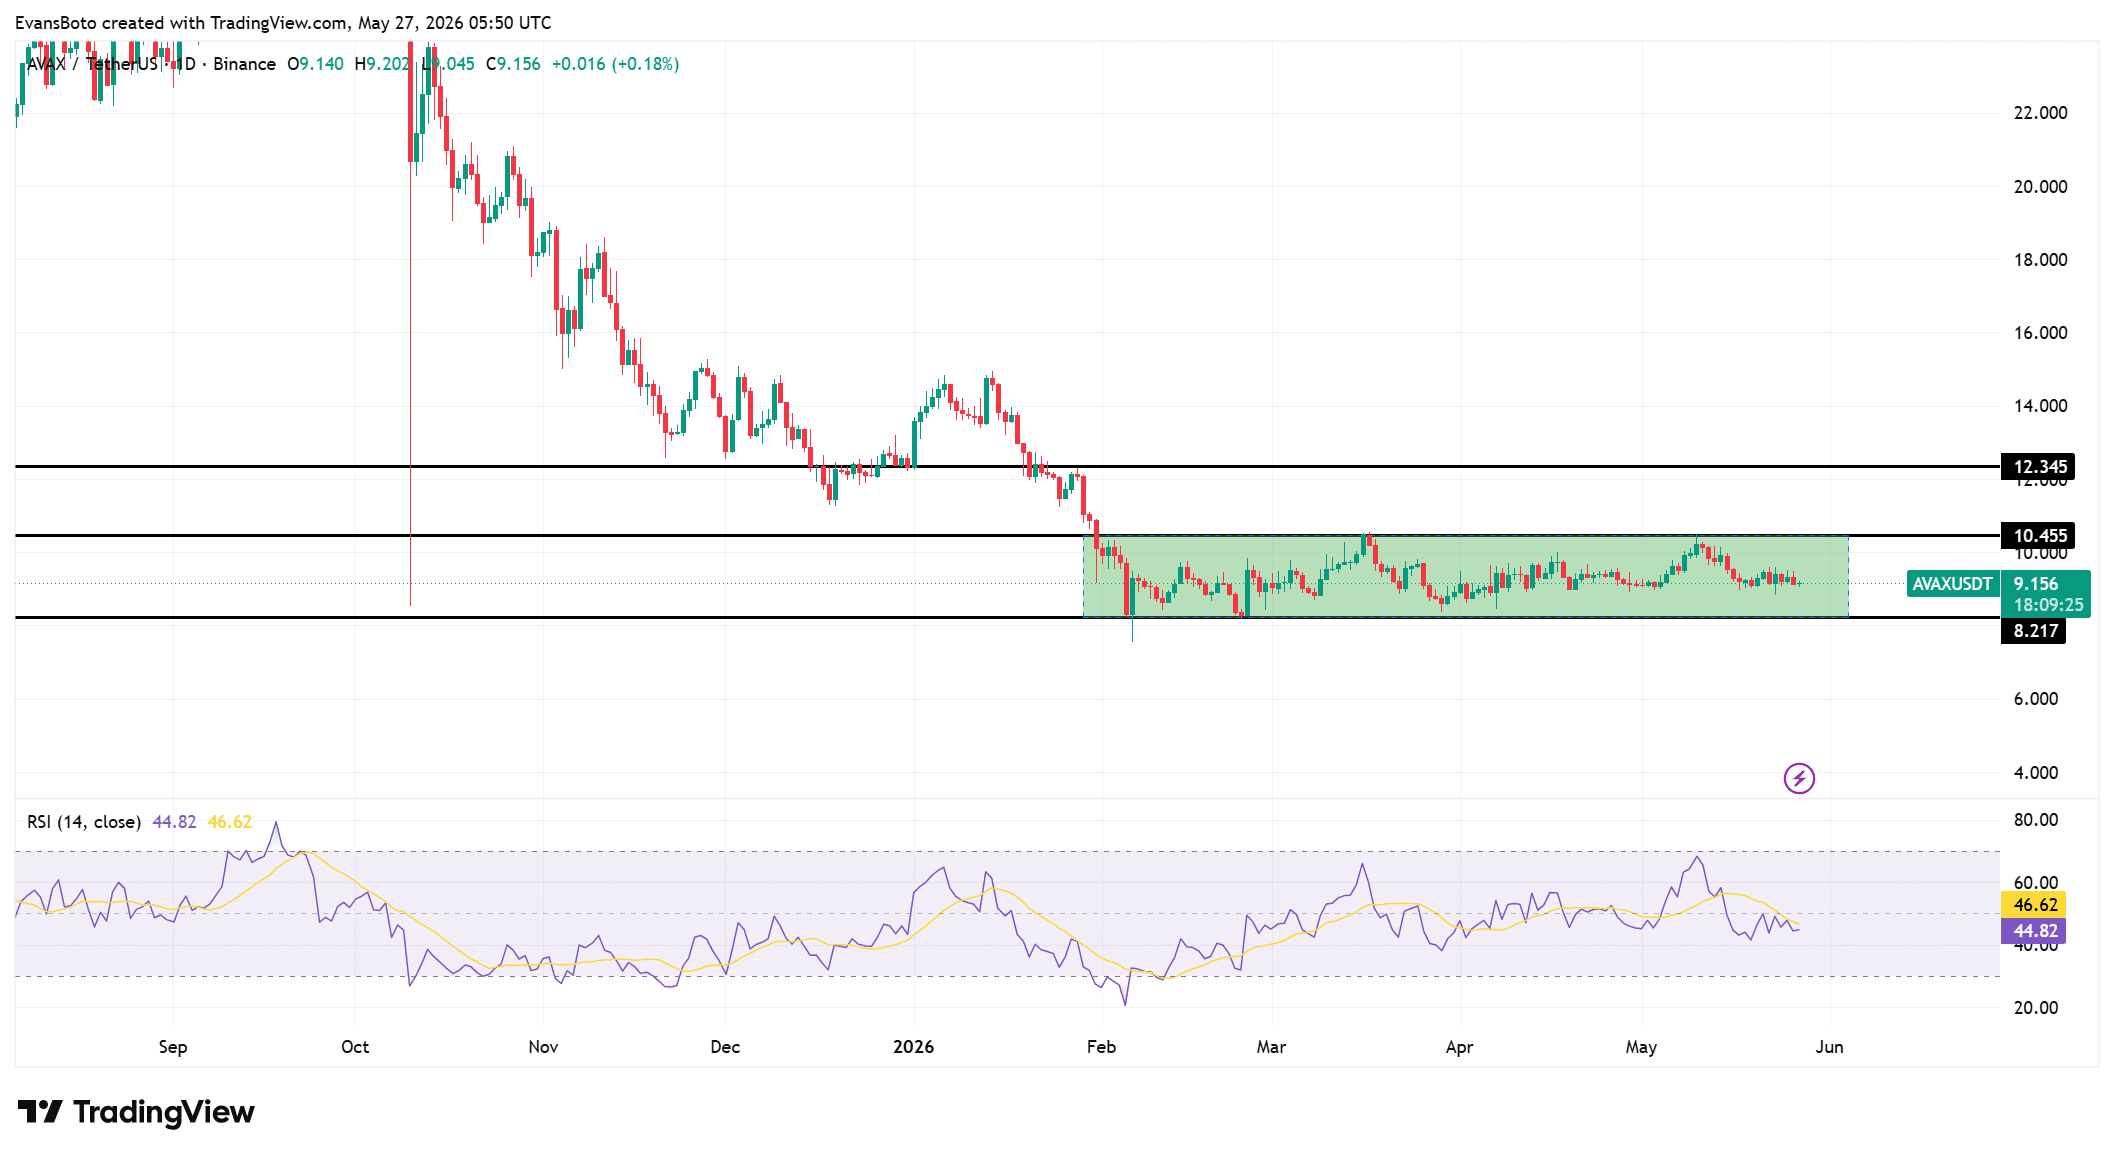
Can AVAX reclaim the $10.45 barrier?
AVAX continued trading inside a broad consolidation range between the $8.21 support and $10.45 resistance zone. Buyers repeatedly defended the lower boundary after price rejected deeper downside moves during February and March.
The daily chart also showed AVAX stabilizing near $9.15 while avoiding another breakdown below the established range floor. However, the asset remained trapped beneath the key $10.45 resistance, preventing bullish continuation from fully developing.
Price structure still reflected compression rather than expansion across higher timeframes. The Relative Strength Index remained below the neutral 50 level while printing 44.82 on the daily timeframe.
This reading showed bullish strength had weakened after several failed recovery attempts near resistance. If buyers reclaim the upper resistance region with stronger participation, AVAX could attempt a move toward the $12.34 macro resistance.
Until then, the ongoing structure continued favoring sideways movement inside the broader consolidation zone.
Source: TradingView
Traders reduce leveraged AVAX exposure
Derivatives activity weakened as Open Interest declined 7.27% to nearly $358.79 million during consolidation. This reduction showed leveraged traders had started reducing exposure while AVAX remained trapped inside its established range.
The decline also reflected lower speculative participation after recent failed breakout attempts near resistance. Unlike aggressive trending phases, the market currently showed hesitation from both bullish and bearish participants across derivatives platforms.
Reduced leverage often decreases volatility temporarily because fewer traders maintain oversized positions.
However, shrinking Open Interest also suggested conviction remained limited near current levels. If prices reclaim higher resistance while OI expands again, stronger directional activity could return across the derivatives market.
Source: CoinGlass
Liquidation clusters build near resistance
Liquidation heatmap data showed dense short liquidation clusters building between the $9.30 and $9.50 levels. These zones represented potential volatility magnets if buyers forced prices higher during upcoming sessions.
The strongest liquidity concentration appeared near $9.50, where large leveraged short positions had accumulated recently.
Meanwhile, downside liquidity continued building around the $9.00 support region as traders positioned around the current consolidation zone.
Such clustered leverage structures often increase sudden price reactions once liquidity begins triggering rapidly.
Although AVAX remained relatively stable near $9.15, nearby liquidation pressure continued expanding on both sides of the market. If buyers push through upper liquidity zones, short liquidations could accelerate upward price movement toward higher resistance areas.
Source: CoinGlass
Final Summary
AVAX exchange supply keeps shrinking as whales continue moving tokens into private wallets.
Traders reduced their leveraged exposure while price stayed trapped below the $10.45 resistance.
A small compressor station for a 12′ liquified natural gas (LNG) pipeline in Spanish Valley, near Moab, Utah. (Photo by: Jon G. Fuller/VW Pics/Universal Images Group via Getty Images)
VW Pics/Universal Images Group via Getty Images
The Mideast turmoil is once again reminding Americans of a hard truth: Energy security is economic security. When the Middle East trembles, Americans at home feel it at the gas pump, in utility bills and throughout the broader economy.
The national average for a gallon of regular gasoline is around $4.50—a painful jump, even if it’s still lower than the prices in many other countries. President Trump has assured Americans that prices will return to normal as the conflict in the Middle East subsides. History suggests that’s likely. But the real lesson is larger than one temporary price spike.
The U.S. must produce more energy. Period. For too long, Washington pursued what can only be described as a policy of energy subtraction: restricting production, slow-walking permits, strangling infrastructure and pretending that bureaucratic mandates could replace abundant supply. That approach doesn’t lower prices; it raises them. It doesn’t strengthen America; it weakens us.
The Trump Administration has wisely moved in the opposite direction. That means unlocking our vast energy resources, expanding production, building pipelines, approving infrastructure and increasing exports to allies who need reliable alternatives to hostile regimes.
Liquefied natural gas (LNG) is a prime example. In just its first decade as a major American industry, LNG has become a remarkable economic success story. It supports tens of thousands of jobs along the Gulf Coast and in nearly 40 states. It generates substantial tax revenue for local communities. It has contributed nearly $500 billion to the American economy.
Just as important, LNG has become a pillar of U.S. national security. During the Iran conflict—and especially as LNG facilities in Qatar came under assault—American LNG helped keep energy flowing to allies overseas. That’s what energy dominance looks like. It’s not a slogan; it’s a strategic asset.
Predictably, opponents of energy abundance continue to claim that LNG exports raise prices for American consumers. This argument has been disproven by a decade of real-world evidence.
Energy prices are shaped by many factors: supply and demand, weather, infrastructure constraints and geopolitical shocks. Temporary spikes can happen, especially during conflicts like Russia’s invasion of Ukraine or turmoil in the Middle East. However, the broader American story is one of abundant, affordable natural gas.
Since the first U.S. LNG cargo was exported a decade ago, American natural gas production has surged. LNG exports have grown by roughly 16 billion cubic feet per day since 2016, but domestic production has grown by about twice that amount. That’s why Americans continue to enjoy some of the lowest residential natural gas prices in the world.
Prices of LNG have remained stable, recently hovering near $2 despite geopolitical turbulence. Over the past decade, average prices have been more than 50% lower than before LNG exports began. That’s not a record of scarcity; It’s a record of abundance. The lesson is simple: Markets work when government gets out of the way.
Those genuinely concerned about affordability should support more U.S. energy production, not less. Burdensome “green” regulations, endless permitting delays and hostility toward pipelines don’t protect consumers. They impose costs on utilities, discourage investment and reduce supply. Inevitably, consumers pay the bill.
The international stakes are just as clear. The U.S. is now the world’s largest exporter of LNG, giving Europe and other allies a vital alternative to Russian energy. If America pulls back, Russia and unstable Middle Eastern suppliers will gladly fill the void. That would raise global energy risks and, ultimately, put upward pressure on prices here at home. Energy weakness invites economic pain and geopolitical danger. Energy abundance delivers jobs, lower costs, stronger allies and a more secure America.
As the midterms approach, lawmakers in both parties should focus on the policies that actually bring down prices: expand energy infrastructure, approve pipelines, streamline permitting, reduce unnecessary restrictions and produce more energy at home while exporting more to our friends abroad.
The answer to volatile global energy markets isn’t to retreat from American energy leadership; it’s to double down on it. The U.S. has the resources, workers and technology to lead. What it needs now is the political will to do so.
WASHINGTON, May 27 (Reuters) – U.S. banks reported a 3.6% increase in their profits in the first quarter of 2026, rising to $80.5 billion as domestic deposits grew again and banks set aside slightly more against potential losses, the Federal Deposit Insurance Corporation reported Wednesday.
The FDIC reported that bank deposits had risen for the seventh consecutive quarter, and while bank provision expenses were up 2.3% in the first quarter, they were lower than a year prior.
The FDIC said asset quality metrics remained favorable, with the level of past due loans falling slightly. However, it noted that past due levels for residential loans and commercial real estate rose slightly, and levels remained elevated for loans for credit cards, autos, and multifamily commercial real estate.
FDIC Chairman Travis Hill said in a statement that bank capital and liquidity levels remained strong.
(Reporting by Pete Schroeder; Editing by Chizu Nomiyama)
Bitcoin [BTC] was trading at $75,879.22 after a drop of 1.1% in the past 24 hours. Even though this seems to be a brief decline, the bigger picture indicates that the leading cryptocurrency has failed to reach the October 2025 ATH in six months.
Remarking on the same, Ecoinometrics noted,
The current Bitcoin drawdown is about 8 months old. History suggests drawdowns of this size typically take around 10 months to fully recover.
Source: Ecoinometrics/X
All about Bitcoin’s drawdown
This indicates that, at least historically, the current decline in the price of Bitcoin is quite normal in comparison to past market cycles.
For context, a 10% correction could be recovered in a few weeks, while a 30% to 40% drawdown could take months. However, it can take years for bear markets to recover from declines of 70% or more.
This is due to a number of factors, including the need for additional time for the recovery of leveraged positions, liquidity, and investor confidence.
What does this mean for Bitcoin?
All things considered, this indicates that BTC has not yet reached its bottom. It may therefore still be in a consolidation phase rather than being on a new uptrend.
So the fact Bitcoin is still deep in this drawdown isn’t a out of line. The deeper the drawdown, the longer the recovery.
This was further validated by an analyst who said,
The Bitcoin volatility has gone down massively.
Considering this, the analyst calls for Bitcoin to break above $80K to gain more strength and liquidity.
Is Bitcoin signaling bullish or bearish sentiment?
A recent analysis by CryptoQuant also indicated that a significant divergence has begun to appear since 2025. Bitcoin’s price fluctuations have been noticeably greater than those of the S&P 500, which has stayed comparatively steady.
This trend was confirmed by the Bitcoin Spot Taker CVD indicator, which shows that aggressive spot buying has not yet established itself as a consistent dominant force, as it did during prior significant rallies.
Source: CryptoQuant
Additionally, AMBcrypto previously stated that Bitcoin faces a $14 billion liquidation risk. While weaker spot demand casts doubt based on dip buying, heavy long positions below price may lead to liquidations.
Yet, despite the escalating tensions in the Middle East, Bitcoin has remained strong, as confirmed by Bitcoin’s monthly returns, which were positive for three consecutive months.
Source: CoinGlass
Final Summary
Bitcoin’s current drawdown, which is eight months old, is strong as compared to past market cycles.
The Spot Taker CVD indicator suggests Bitcoin is weak, but its monthly returns suggest that the overall sentiment remains strong.