Home Blog Page 126

What This Business First Insider Sale Signals After a 34% Stock Run

0
What This Business First Insider Sale Signals After a 34% Stock Run


George W. III Cummings, a director at Business First Bancshares, Inc. (NASDAQ:BFST), reported a sale of 20,000 shares of common stock in a transaction executed on July 30, 2026, and July 31, 2026, according to an SEC Form 4 filing.

Transaction summary

Transaction value based on SEC Form 4 weighted average sale price ($31.79); post-transaction value based on July 31, 2026 market close ($31.82).

Key questions

  • How did this transaction affect the director’s total equity position?
    The sale of 20,000 shares represented an 8% reduction in the director’s holdings. George W. III Cummings remains a significant stakeholder with 225,000 total shares, alongside a small number of direct derivative securities also reported in the Form 4.

  • What is the distribution of the remaining beneficial ownership?
    The remaining equity is largely held directly, with 221,180 shares in the director’s name. The filing also confirms indirect ownership of 3,911 shares held by a spouse.

  • In what market context was this disposition executed?
    The shares were sold at $31.79 per share, slightly below the July 31, 2026 market close of $31.82. The stock was priced at $31.94 as of the July 30, 2026 market close, having achieved a 34% return over the preceding 12-month period.

Company Overview

Company Snapshot

  • Business First Bancshares, Inc. operates as the bank holding company for b1BANK, providing a comprehensive suite of deposit products including checking, demand, money market, time, and savings accounts, along with certificates of deposit, and lending solutions across commercial, industrial, and consumer segments.

  • The company generates revenue through traditional banking operations, including net interest income from lending activities, deposit-based services, and fee-based financial services that leverage its regional banking platform.

  • Business First Bancshares serves commercial and retail customers throughout its markets, targeting small to mid-sized businesses and individual depositors seeking regional banking relationships and personalized financial services.

Business First Bancshares is a regional bank holding company with approximately $1.0 billion in market capitalization and $455.3 million in TTM revenue, operating from its headquarters in Baton Rouge. The company has demonstrated strong performance with a one-year share price appreciation of 34%, reflecting investor confidence in its regional banking operations and profitability metrics, which yielded $93.0 million in net income on a TTM basis.


Source link

Solana has been bearish for 10 months in a row: Can SOL still make a comeback?

0
Solana has been bearish for 10 months in a row: Can SOL still make a comeback?


Solana’s 2026 cycle has, so far, been one of its weakest on record.

From a technical perspective, SOL closed July down 1.1%, printing its 10th consecutive monthly red candle. That means since the October breakdown, SOL hasn’t managed a single strong monthly close, leaving HODLers who bought near the $250 cycle top deep underwater.

As a result, the $60 region is becoming an increasingly critical long-term support level.

On-chain, however, the price weakness still hasn’t translated into weaker fundamentals. As the chart below shows, Solana activated SIMD-0286 on the 29th of July, raising the compute limit from 60 to 100 million.

In other words, the network now has more room to handle demand spikes without affecting network activity. 

Solana
Source: Pine Analytics

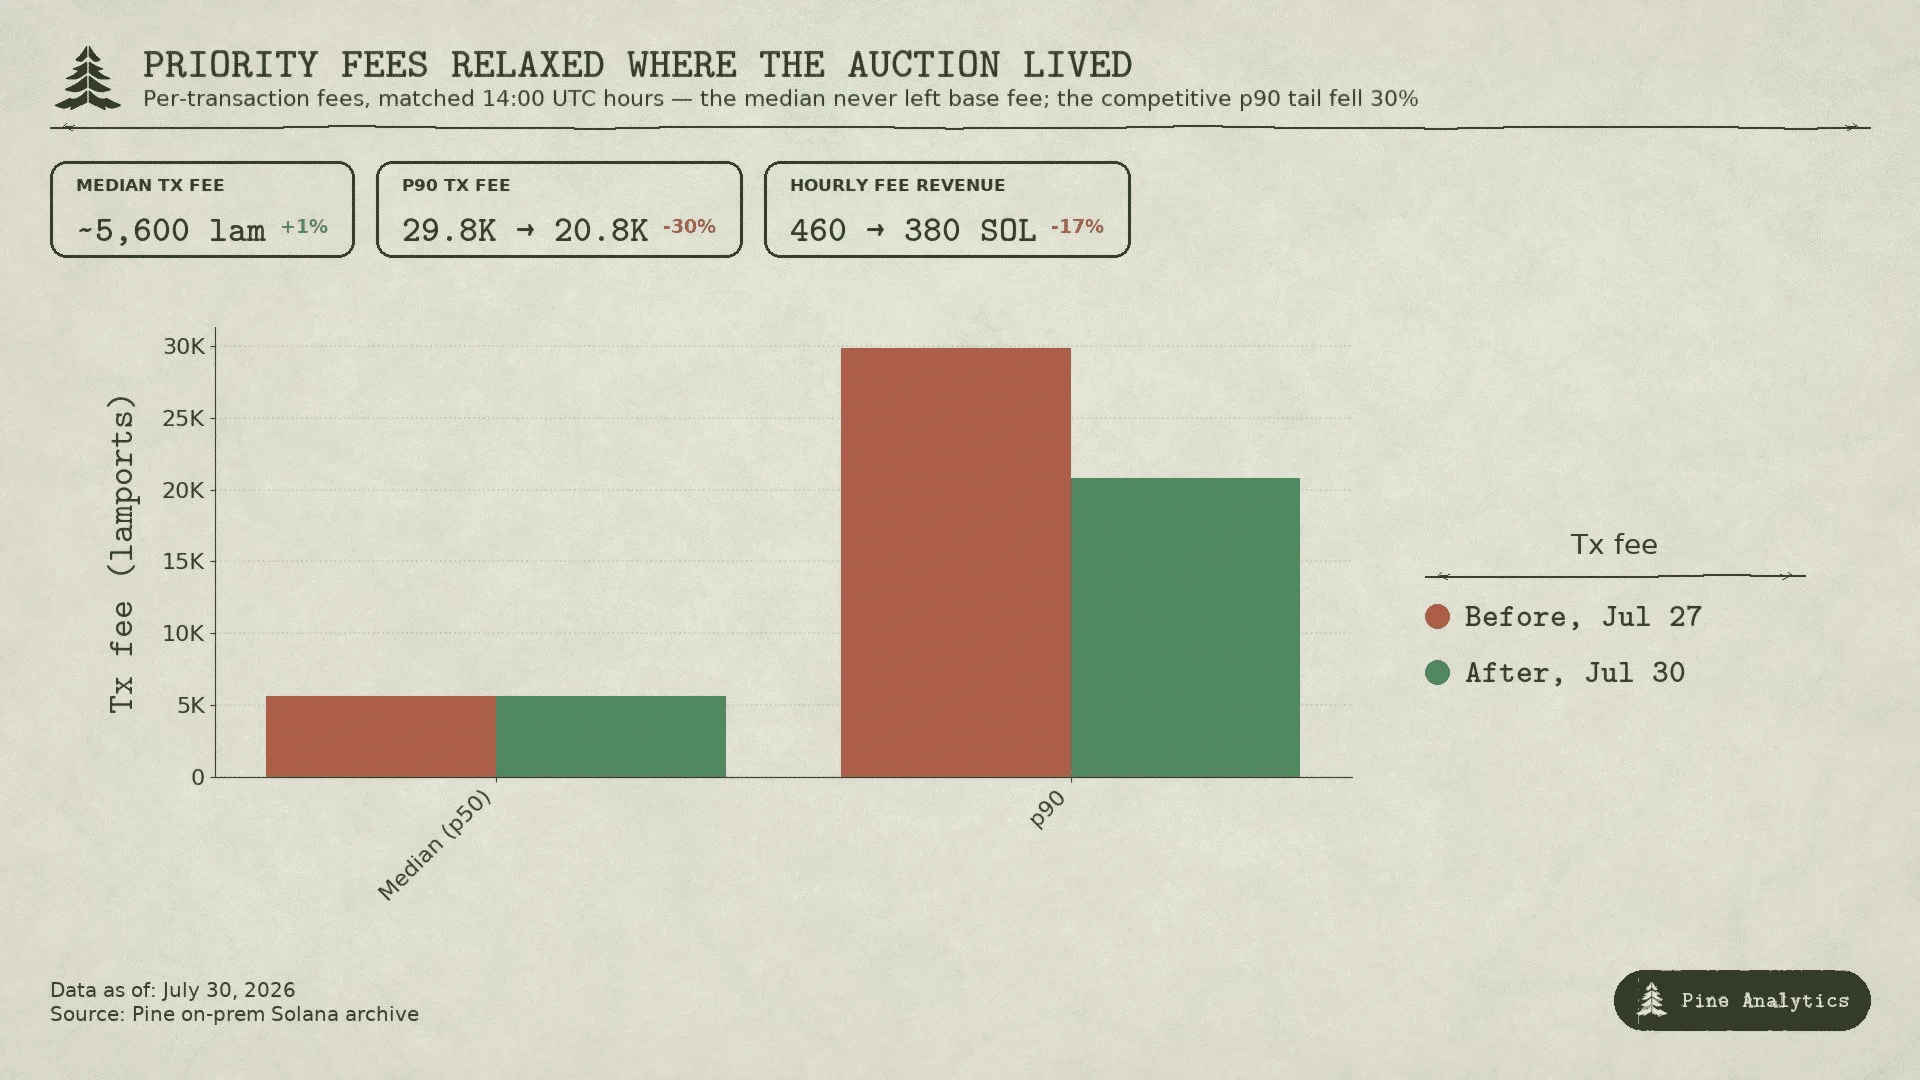
Notably, the upgrade has also eased fee pressure. Since SIMD-0286 was activated, the 90th percentile transaction fee has fallen 30%, from 29,800 to 20,800 lamports, pointing to better throughput and improved capital efficiency across the network. 

Interestingly, Token Terminal data shows Solana processed 8.7 billion transactions in July, its highest monthly transaction count in four months.

In essence, while Solana [SOL] continues to struggle on the price chart, on-chain activity is moving in the opposite direction, suggesting the network is becoming stronger.

According to AMBCrypto, this couldn’t have come at a better time. 

Why Solana’s on-chain strength is hard to ignore 

Solana’s improving fundamentals are now starting to align with a bullish technical setup.

According to one analyst, SOL is forming the same breakout-and-retest structure that has historically preceded its strongest rallies. In 2021, the pattern was followed by a 2,500% move, while the 2023 setup led to a 3,600% rally.

The analyst argues that SOL is once again holding the same high-timeframe support, suggesting the market could be building a similar structure for the 2026-2027 cycle.

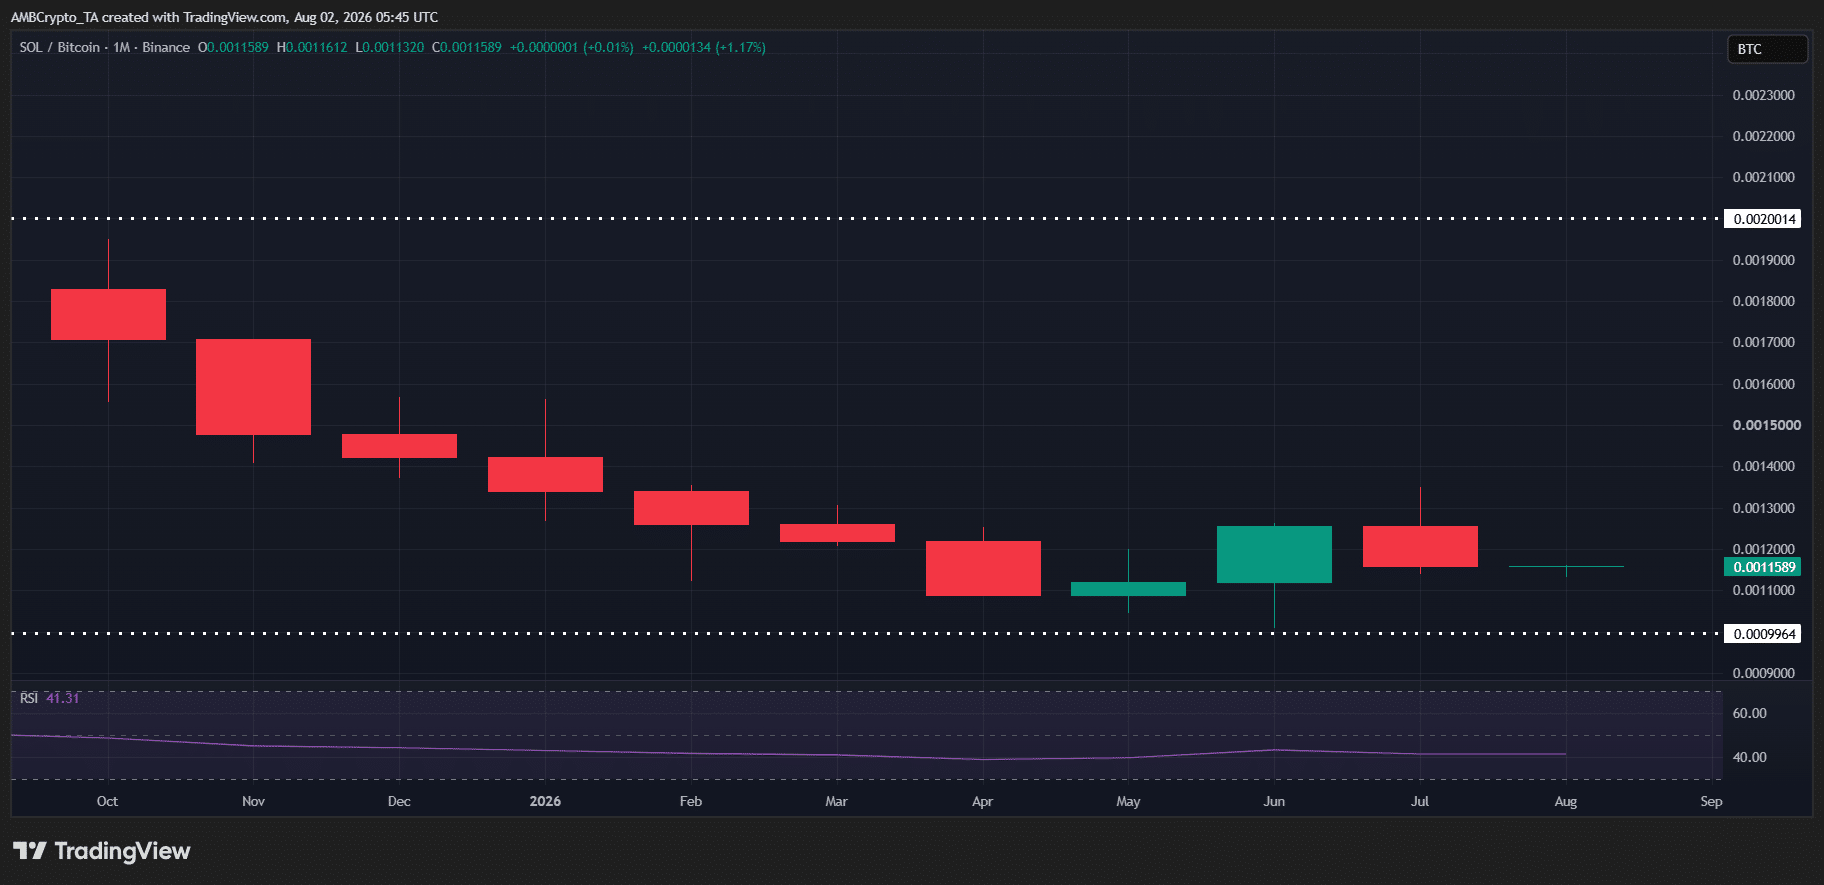
Notably, this is where the chart below becomes important. Historically, August and September have been Bitcoin’s weakest months, increasing the odds of capital rotating into high-beta altcoins.

Against this backdrop, the SOL/BTC pair continues to chop below 0.002. A decisive breakout from this range could mark the beginning of a broader trend reversal.

SOL BTCSOL BTC
Source: TradingView (SOL/USDT)

In that context, Solana’s on-chain fundamentals become difficult to ignore. 

The SIMD-0286 upgrade has improved network efficiency, transaction activity is back at a four-month high, and SOL continues to hold a historically important technical structure. These factors suggest Solana may be quietly building the foundation for its next major move. 

Combined with the ongoing SOL/BTC consolidation and Bitcoin entering its historically weaker August-September period, the setup for a potential rotation cycle is starting to take shape.

If momentum shifts back toward altcoins, SOL/BTC could become a key catalyst for Solana’s trend reversal in the coming months.


Final Summary


Source link

How to Track Your Brand’s AI Visiblity in 2026 

0
How to Track Your Brand’s AI Visiblity in 2026 


Opinions expressed by Entrepreneur contributors are their own.

Key Takeaways

  • Track citations, mentions, and recommendations as three separate metrics — lumping them together lets you celebrate movement that never turns into revenue, because being visible in an AI answer and being recommended by it are not the same thing.
  • Platforms like Peec, Semrush, and Ahrefs are useful monitoring infrastructure but not ground truth; the strongest setup is hybrid — automated tracking for broad patterns paired with monthly manual checks across ChatGPT, Claude and Gemini on the prompts that actually drive pipeline.

According to a recent report, 94% of 250 surveyed enterprise C-level executives plan to ramp up spending on AI visibility efforts in 2026. However, while almost all executives agree that generative engine optimization had a positive impact on their business in the previous year, a HubSpot study showed that 32.5% of marketers have no clue how to monitor AI citations — let alone measure their impact.

Unlike traditional search optimization, tracking a brand’s AI visibility isn’t as easy as opening Search Console. For many businesses, it’s not even as easy as signing up for an Ahrefs subscription — although there are already similarly designed products available. The truth is that the most effective AI visibility tracking requires a layered approach. Here’s the system I’ve been running since the start of 2026.

1. Get clear on what you’re actually tracking

Before you touch a single tool, decide what success looks like. In my experience, most founders lump together several very different signals and then wonder why their reporting tells them nothing useful.

The first is citations. A citation is when an AI engine links to your website or clearly uses your page as a source inside its answer. It is the closest thing AI visibility has to a traditional SEO signal, which is why so many teams start there.

The second is mentions. A mention is when your brand name appears inside the response, whether or not the AI links back to you. Mentions matter because they show your brand is part of the model’s vocabulary on a topic. But mentions can also flatter you. A brand can be mentioned as a passing example and still lose the commercial intent of the query.

That is why I treat recommendations as a third and separate metric. This is the question that matters most: When someone asks for the best option, does the AI actually suggest your product, company or service, or does it just acknowledge that you exist? As I wrote in my previous Entrepreneur piece on how AI recommends local businesses, being visible and being recommended are not the same thing.

If you only track citations, you can end up celebrating movement that never turns into revenue. Track citations, mentions and recommendations separately, or your reporting will blur the thing you actually care about.

2. Build a prompt library that sounds like a real customer

Nothing in AI visibility works without a serious prompt library filled with the questions a real buyer would ask to discover a brand like yours.

I always start manually. Before I ask any AI tool for help, I write the first 10 to 20 prompts myself. That matters because you already know the language your customers use, the objections they have and the competitors they compare you against. Start with the obvious commercial prompts, then expand into comparison queries, pain-point queries, and local variations.

Good prompt libraries also need specifics. Add city names where geography matters. Add competitor names where comparison matters. Add budget, company size, use case or industry where those filters would realistically shape the answer. OpenAI’s own data shows how conversational ChatGPT usage has become, which means generic one-line prompts often miss how people actually search.

Once you have that manual base, use Claude or ChatGPT to generate variants and cluster them by intent.

It’s better to have 50 good prompts than 300 bloated ones. Too few prompts and you miss the long tail. Too many, and you start tracking noise instead of buying intent.

3. Use platforms for scale, but understand their limits

A growing number of tools now cover AI visibility directly, including Peec, Semrush, Ahrefs and DataForSEO. What makes them useful is not just that they collect data. It is that they make the data operational.

A good platform can track multiple engines at once, automate daily checks, visualize trend changes, generate reports for your team and often let you set a location. Some also suggest new prompts to monitor, identify competitors you had not considered and surface content gaps that may be hurting your visibility. Once you spend the time setting them up properly, the maintenance burden is relatively low.

But there is a big catch. A lot of this tracking still depends on search-enabled environments, model snapshots or vendor-specific ways of querying the models. 

That matters because the answer a user gets from a live AI session can look very different depending on whether web search is active, what context is available and how the system decides to compose the response. In other words, platform data can be directionally useful without being a perfect reflection of what every real user sees.

This is where teams get overconfident. They subscribe to a dashboard, see a neat visibility chart and assume they now understand the market. They do not. They understand one layer of it.

That does not make the tools useless. It just means you should treat them as monitoring infrastructure, not ground truth. For a useful overview of how these products fit together, this guide on measuring AI visibility in 2026 is a solid reference point.

4. Keep a manual tracking layer for the prompts that matter most

The most labor-intensive part of AI visibility tracking is also the most revealing. Once a month, I like to take the most commercially important prompts from my library and run them manually across ChatGPT, Claude and Gemini in fresh chats.

The point of doing this is control. You can test the exact prompt phrasing, add the location directly into the query when geography matters and compare outputs side by side. You also get the full richness of the response instead of a summarized score inside a platform dashboard.

From there, I save the responses and use a high-reasoning model to analyze them. I want a clean breakdown of how often my brand was cited, how often it was mentioned, whether it was actively recommended, how prominently competitors appeared and what patterns keep repeating across answers. You can also use this layer to ask for hypotheses about why certain competitors keep outperforming you on specific prompts.

This approach takes more effort, but it gives you something automated tools often flatten: context. You see not just whether your brand showed up, but how it showed up and what narrative surrounded it.

In practice, the best setup is usually hybrid. Use a platform subscription to monitor broader patterns, and use manual checks on the prompts that actually matter to your pipeline.

5. Measure business impact, not just AI visibility

Visibility is interesting. Impact is what pays for the work.

The most obvious place to start is Google Analytics. Track identifiable AI referral traffic where possible and monitor how those visitors behave compared with other channels. That still will not show you the full picture, because some people will discover your brand through an AI answer and come back later through a branded search, direct visit or referral.

That is why I also like simple operational fixes. Add “AI assistant” as an answer option to your “How did you hear about us?” field. If your business uses sales calls, train the team to ask whether the lead first heard about you through ChatGPT, Claude, Gemini or another AI tool. It sounds basic, but this kind of qualitative data becomes surprisingly valuable once patterns start repeating.

Watch for indirect signals too. When your recommendation rate improves on important prompts, do branded search, demo requests and direct traffic rise soon after? If your visibility numbers look better but none of those downstream indicators move, something in the chain is broken.


Key Takeaways

  • Track citations, mentions, and recommendations as three separate metrics — lumping them together lets you celebrate movement that never turns into revenue, because being visible in an AI answer and being recommended by it are not the same thing.
  • Platforms like Peec, Semrush, and Ahrefs are useful monitoring infrastructure but not ground truth; the strongest setup is hybrid — automated tracking for broad patterns paired with monthly manual checks across ChatGPT, Claude and Gemini on the prompts that actually drive pipeline.

According to a recent report, 94% of 250 surveyed enterprise C-level executives plan to ramp up spending on AI visibility efforts in 2026. However, while almost all executives agree that generative engine optimization had a positive impact on their business in the previous year, a HubSpot study showed that 32.5% of marketers have no clue how to monitor AI citations — let alone measure their impact.

Unlike traditional search optimization, tracking a brand’s AI visibility isn’t as easy as opening Search Console. For many businesses, it’s not even as easy as signing up for an Ahrefs subscription — although there are already similarly designed products available. The truth is that the most effective AI visibility tracking requires a layered approach. Here’s the system I’ve been running since the start of 2026.

1. Get clear on what you’re actually tracking

Before you touch a single tool, decide what success looks like. In my experience, most founders lump together several very different signals and then wonder why their reporting tells them nothing useful.


Source link

A massive stablecoin fragmentation war is brewing between tech giants and a startup is aiming to capitalize on it

0
A massive stablecoin fragmentation war is brewing between tech giants and a startup is aiming to capitalize on it

The stablecoin market is fragmenting, and onchain capital allocator Spark is betting it can capitalize on the split.

Fintechs, exchanges and banking groups are increasingly launching their own dollar-linked tokens. Each issuer wants to keep users, reserves and transaction activity inside its own network as competition ramps up.

The stablecoin landscape “is about to fragment more and more,” Sam MacPherson, CEO of Phoenix Labs, said in an interview with CoinDesk.

PayPal has PYUSD, Circle has USDC, and Tether has USDT. Robinhood has joined the Global Dollar (USDG) consortium and is building its own chain, while OpenUSD (OUSD) is another large consortium that includes Stripe and Coinbase.

Beyond these giants, there are hundreds of other stablecoins, including Ethena’s USDe, World Liberty Financial’s USD1 and Sky’s USDS.

The result is liquidity scattered across an expanding number of tokens and networks.

Spark is betting those networks will still need to connect. Its aim is to be the layer that moves money between them.

Spark is an affiliated lending and liquidity unit of Sky, the DeFi ecosystem formerly known as MakerDAO and the issuer of the USDS stablecoin. It is developed by Phoenix Labs and supported through Sky’s governance and capital.


Source link

As Cloud Revenue Soars, Is It Time to Buy Microsoft Stock?

0
As Cloud Revenue Soars, Is It Time to Buy Microsoft Stock?


Once again, Microsoft (NASDAQ: MSFT) delivered a strong quarter, driven by its cloud computing segment and growing adoption of Copilot. And for once, the stock surged higher on the news. However, it is still trading down year-to-date and off more than 10% over the past year.

Let’s take a closer look at the company’s fiscal Q4 results to see if its rally can continue.

Missed Nvidia in 2009? This Rare Signal Is Flashing Again. In 2009, a “Double Down” signal flashed for a little-known chipmaker called Nvidia. For the first time in years, that same “Total Conviction” signal is flashing for a company 1/100th the size of Nvidia. Continue »

Image source: The Motley Fool.

Azure growth continues

Microsoft’s cloud computing unit, Azure, once powered its growth, with revenue soaring 43% year over year. It was the 12th straight quarter in which Azure revenue rose by 30% or more, and it surpassed $100 billion for the fiscal year. Demand continues to outstrip capacity, and Azure revenue is projected to accelerate to 45% constant-currency growth in Q1.

Bookings rose 10% and were up 18% when excluding OpenAI. Remaining performance obligations (RPOs), which include future Azure commitments, surged 84% year over year to $678 billion. The company said about 30% of these commitments will be recognized as revenue over the next 12 months. Notably, it said all of the sequential growth it saw came from non-AI model companies.

Microsoft’s total revenue rose 18% year over year to $90 billion, while adjusted earnings per share (EPS) increased 23% to $4.74. The results topped the analyst consensus for $87.62 billion in revenue and $4.24 in adjusted EPS, as compiled by LSEG.

Overall “intelligent cloud” revenue, which includes Azure and GitHub, climbed by 32% year over year to $39.3 billion. The company introduced a usage-based pricing model for GitHub Copilot in the quarter, which helped drive a 60% sequential increase in GitHub Copilot revenue and seat expansion.

Microsoft’s productivity and business processes segment, home to Microsoft 365 and LinkedIn, saw revenue climb 14% year over year to $37.8 billion. Growth was solid across its four main solutions in the segment (in the table), led by a 24% jump in Microsoft 365 Consumer cloud revenue, helped by an earlier price increase. Meanwhile, it said paid Microsoft 365 Copilot seats reached 30 million, with net adds doubling quarter over quarter.

Data source: Microsoft press release. YOY = Year over year.


Source link

Can XRP stay above KEY support after Ripple’s $1.06B token unlock?

0
Can XRP stay above KEY support after Ripple's $1.06B token unlock?


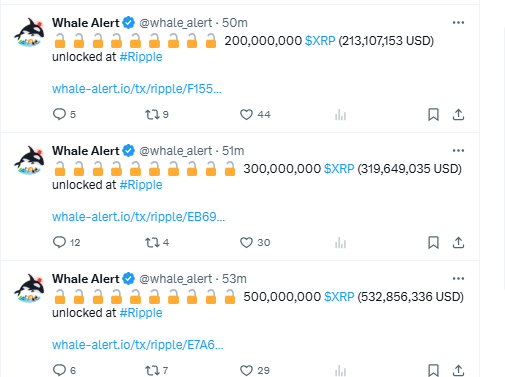
Ripple unlocked one billion XRP worth more than $1.06 billion through three separate releases, placing fresh supply back under market scrutiny. The transaction sequence included 500 million XRP valued at $532.86 million, 300 million XRP worth $319.65 million, and another 200 million XRP valued at $213.11 million. 

However, token unlocks have not always translated into immediate selling pressure because Ripple historically redistributed portions through escrow management. Market participants instead shifted their attention toward whether exchanges would receive a meaningful share of the unlocked tokens. 

As a result, traders closely monitored supporting on-chain metrics for confirmation. Any sustained rise in exchange activity would likely strengthen distribution concerns, whereas limited follow-through could preserve XRP’s current market structure.

Source: X/Whale Alert

Exchange inflows added another layer of concern

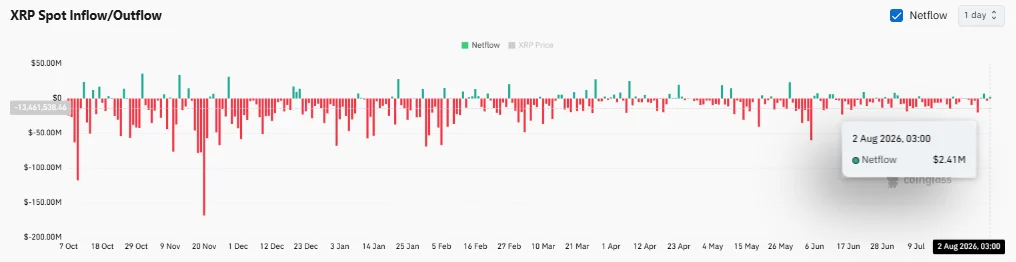
Spot exchange flows shifted direction after months of persistent outflows, introducing another variable into XRP’s outlook. 

At press time, netflows reached +$2.41 million, marking one of the few positive readings after an extended period dominated by negative values. Unlike previous sessions, the latest inflow suggested more XRP entered exchanges than left them, naturally raising the possibility of additional available trading supply. 

Even so, the figure remained relatively modest compared to historical inflow spikes exceeding tens of millions of dollars. Buyers therefore retained an opportunity to absorb incoming liquidity without immediately disrupting market stability. 

Market conviction would likely strengthen if future sessions returned to negative netflows, while consecutive positive readings could reinforce expectations of growing exchange-bound supply.

Source: CoinGlass

Does the falling NVT ratio favor XRP?

On-chain activity improved despite the renewed exchange inflows. 

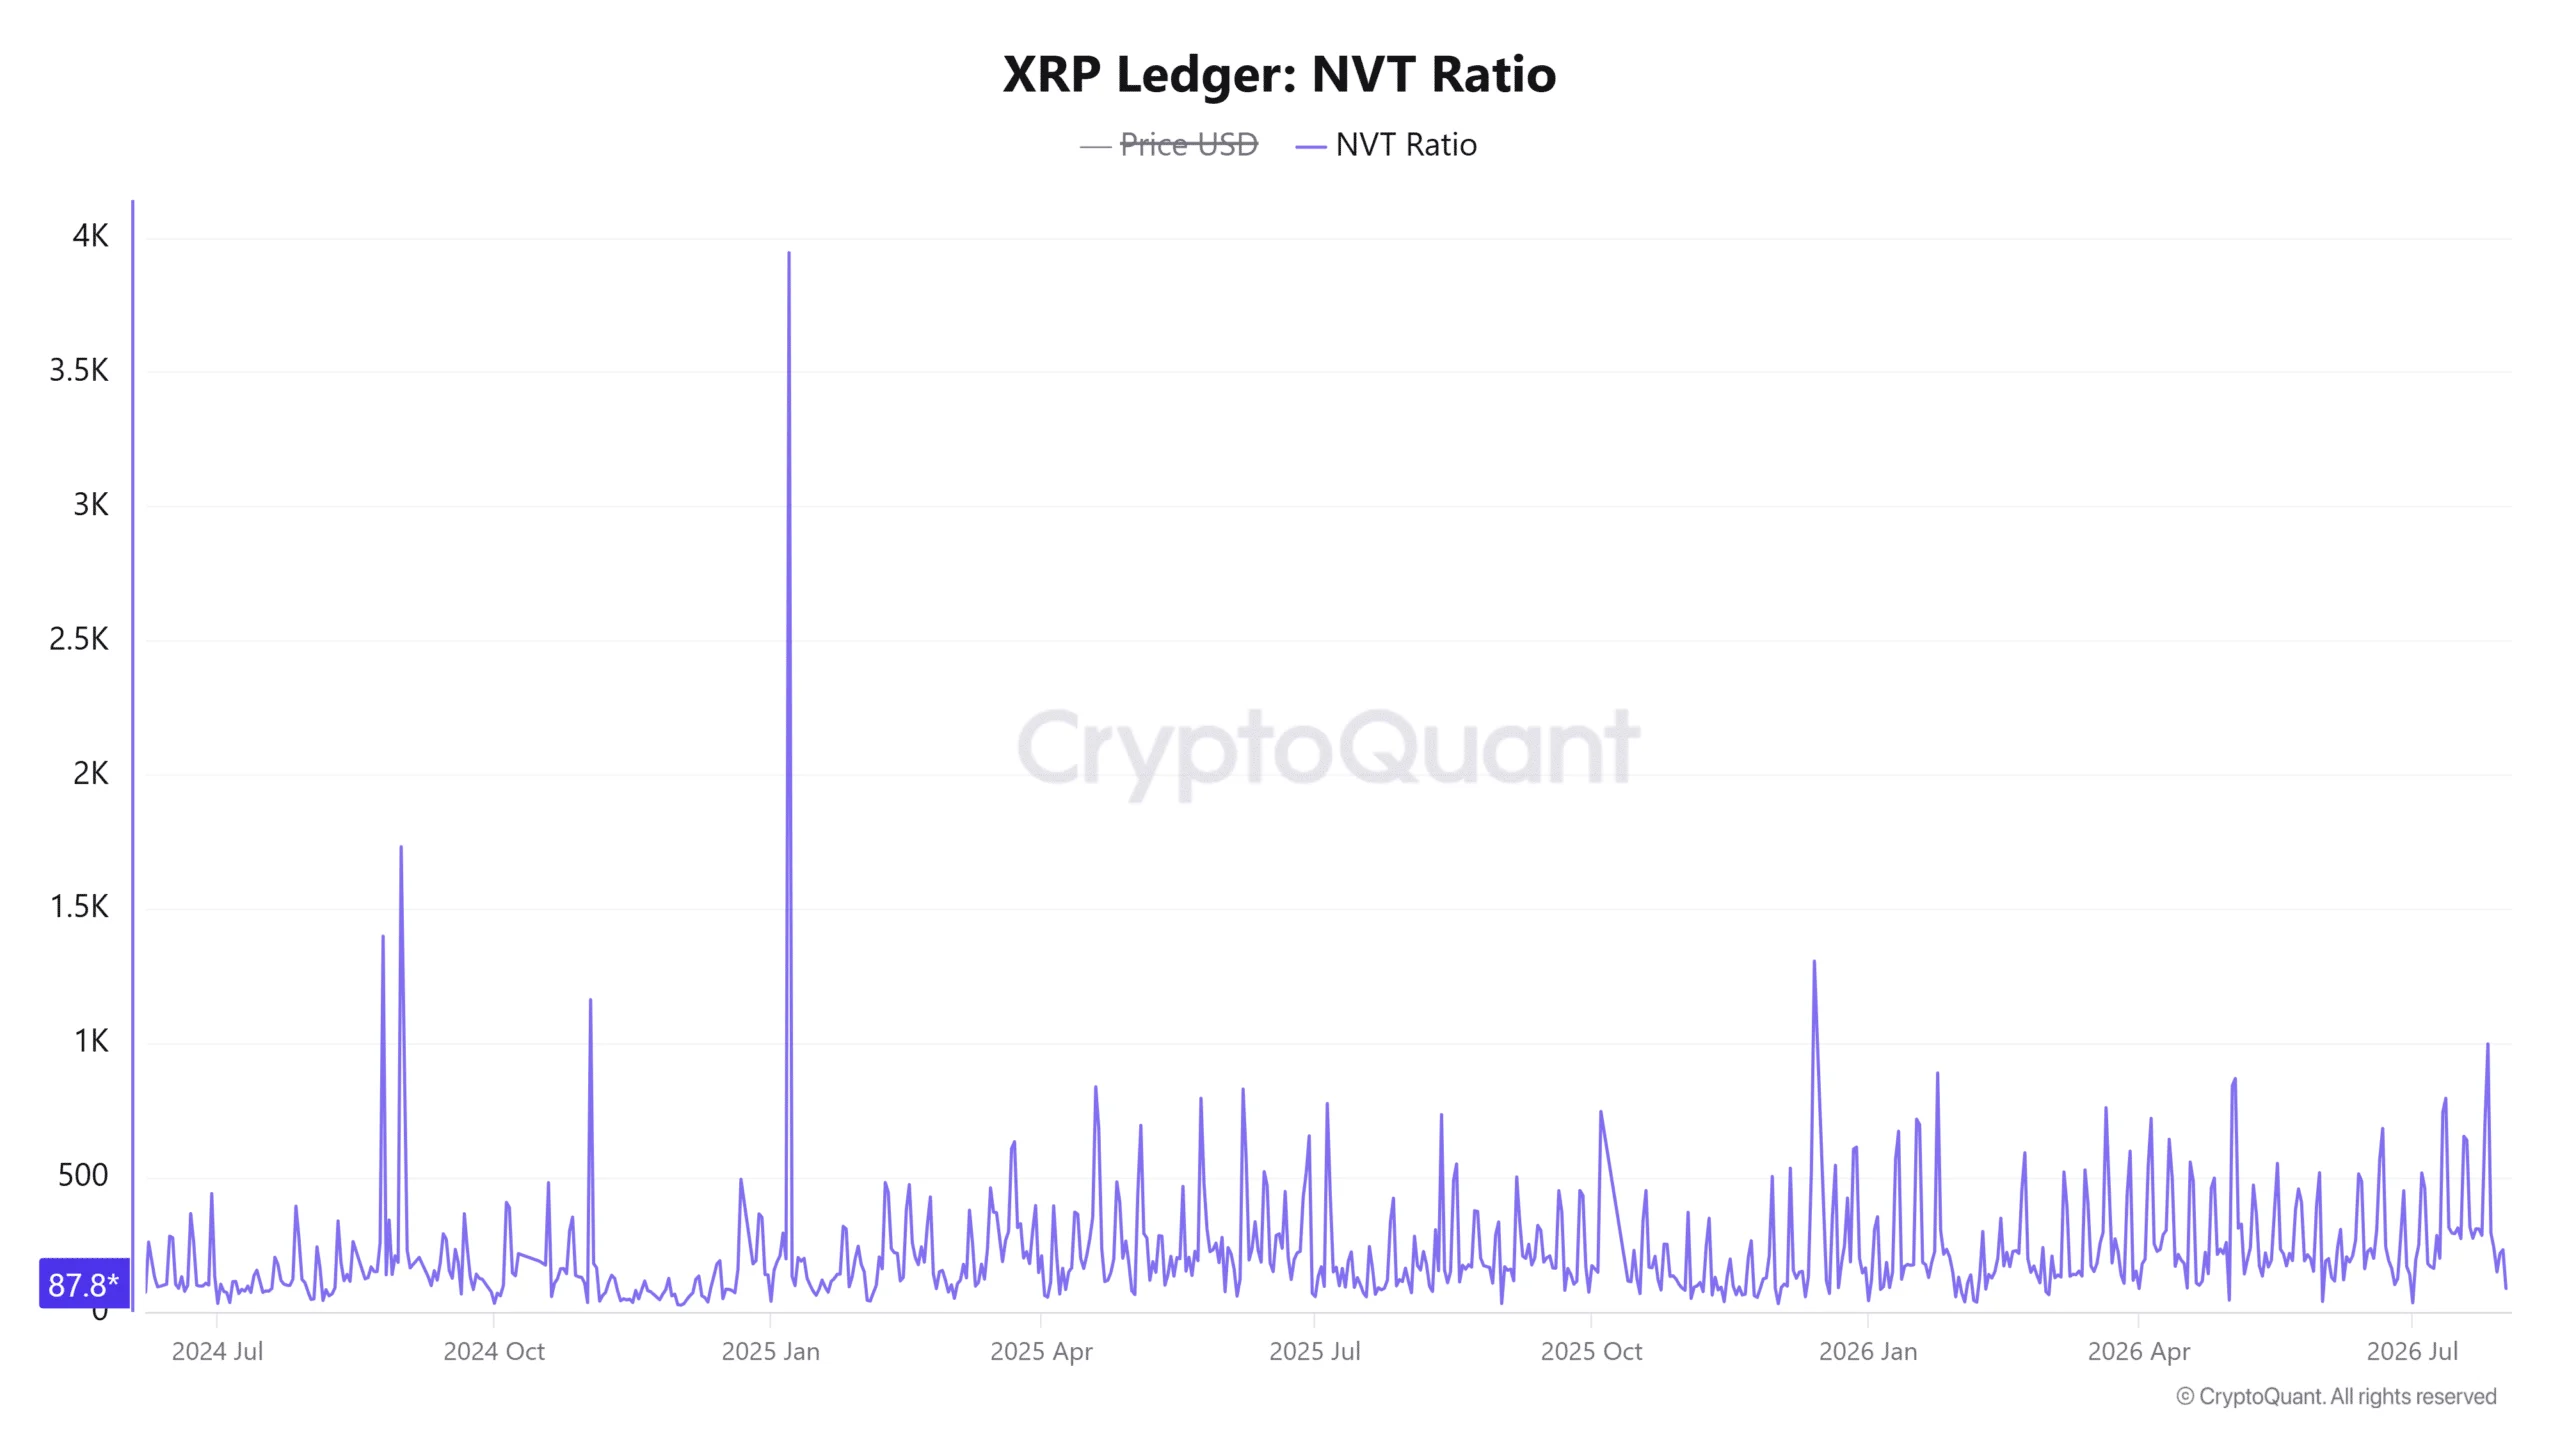
XRP’s Network Value to Transaction (NVT) ratio declined to 87.8584 as of writing, representing a sharp 62.08% daily drop. 

Lower NVT values generally reflected stronger transaction activity relative to market capitalization, indicating that network usage accelerated faster than valuation. Such behavior often supported healthier market conditions because capital circulated more efficiently across the blockchain. 

Nevertheless, stronger network activity alone rarely eliminated concerns surrounding fresh token supply. Investors instead weighed improving utility against the additional XRP entering circulation. 

If transaction activity continues expanding while exchange inflows remain contained, the network’s strengthening fundamentals could offset part of the selling pressure narrative surrounding Ripple’s latest unlock.

Source: CryptoQuant

XRP defended support as selling pressure increased

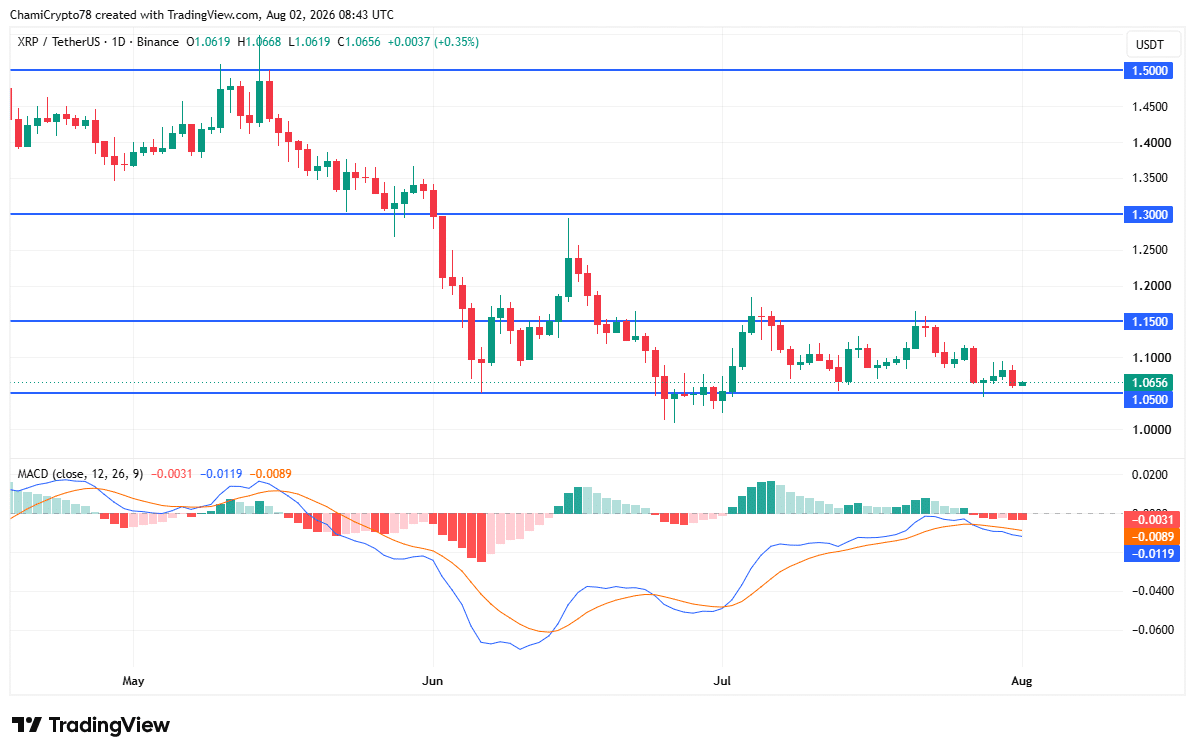
At the time of analysis, XRP traded around $1.0656 after repeatedly defending the $1.05 support zone throughout recent sessions. 

Price rejected lower levels several times, showing buyers continued protecting that area despite persistent overhead resistance near $1.15. Meanwhile, the MACD reflected weakening bullish conditions. The MACD line slipped to -0.0119, while the signal line stood at -0.0089, and both moved beneath the zero line. 

The histogram also remained negative, revealing fading buying interest rather than renewed strength. Despite softer technical conditions, sellers failed to force a decisive breakdown below support. 

If buyers maintain control above $1.05, XRP could attempt another move toward $1.15. However, losing that floor would likely expose $1.00 as the next major downside target.

XRP price actionXRP price action
Source: TradingView

To sum up, Ripple’s billion-token unlock and the return of positive exchange netflows raised legitimate supply concerns, yet stronger network activity softened part of that bearish narrative. 

XRP still defended its key support despite weakening technical indicators. 

Buyers would likely need to preserve the $1.05 floor and absorb additional exchange supply before confidence could shift back toward a broader recovery.


Final Summary

  • XRP defended the $1.05 support despite fresh supply entering exchanges after the latest unlock.
  • Improving network activity offset part of the bearish outlook, but exchange inflows require close monitoring.


Source link

Unlike the FTX collapse, the $89 million Coldcard exploit has investors sending bitcoin back to exchanges

0
Unlike the FTX collapse, the $89 million Coldcard exploit has investors sending bitcoin back to exchanges

“Seems people really moved their Bitcoin out of extreme caution after the coldcard hack,” Moreno said.

Small Bitcoin transactions tell a similar story. According to CryptoQuant, the combined volume of all transfers smaller than 1 BTC reached 39,600 BTC on Friday, just shy of the 39,900 BTC moved on November 16, 2022, the day after FTX filed for bankruptcy.

“The Bitcoin plebs had not moved this amount of BTC in a day since the FTX collapse,” Moreno said, adding that he liked to see people “taking action.”

Blockchain sleuth Timechainindex made a similar observation, noting that total net inflows to exchanges totaled 11,163 BTC on July 31, most of which flowed into major exchanges and firms like Binance, River, Kraken, and OKX.

“These are plebs who are scared,” the handle said on X, explaining the nature of the BTC inflow.

The total number of BTC held in wallets tied to centralized exchanges has increased to 2.715 million from 2.703837 million before the Coldcard exploit.

Reverse of FTX

Following FTX’s failure, the dominant risk was exchange insolvency and withdrawal freezes. Holders responded by moving bitcoin into self-custody, reducing exchange balances.

The current episode centers on self-custody risk associated with a single hardware wallet. The vulnerability has prompted some holders to temporarily shift smaller balances onto exchanges.


Source link