The golf simulator showroom at the PGA Superstore location in Atlanta’s Buckhead neighborhood.
PGA Tour Superstore
In addition to its wide variety of equipment, apparel and other golf gear and technology, PGA Tour Superstore now has dedicated indoor simulator showrooms in all 82 of its stores nationwide.
The experiential component of PGATSS simulator showrooms enables customers to demo and compare residential, outdoor, and commercial systems — from high-end setups with premium launch monitors, enclosures, and projectors to entry-level options with little more than a net and mat.
These showrooms, which are in addition to the indoor simulators where customers can test clubs or play in leagues, further underscore PGA Tour Superstore’s focus on ways to help customers better learn, practice and engage with the game.
“We are committed to helping our customers improve and get dialed into their game,” said PGA Tour Superstore CEO Troy Rice. “Simulator technology has become an incredibly powerful tool for that, giving players real data and feedback to practice more effectively and play better.
“At the same time, it has evolved into something much broader, a fun, social way for people to experience the game and, for many, a gateway into traditional on-course golf.”
Simulator and screen golf engagement is up 154% since 2019, according to the National Golf Foundation, with more than 9 million participants in 2025. Approximately 38 million Americans play off-course forms of golf, none of which have grown more in recent years than the indoor simulator space, where golfers and non-golfers alike are able to practice, compete and/or socialize.
PGA Tour Superstore recently opened its 82nd U.S. location.
PGA Tour Superstore
PGA Tour Superstore customers can connect with expert associates to get information on simulator packages that are based on space, budget, performance futures and intended use. They can compare a variety of brands in the simulator showrooms, including names such as Bushnell, Foresight, Full Swing, Garmin, Rapsodo, SkyTrak, Trackman and Uneekor.
Whether customers are looking to build a dedicated or temporary simulator space in their home or business, the showroom features launch monitor technology in addition to hitting mats, impact screens, projectors and a range of other accessories. And these locations help further position the nation’s biggest golf retailer as an increasingly popular experiential hub for the top pay-to-play U.S. participation sport.
Crypto tried to solve this with its own version of yield. We tried staking rewards, liquidity mining, and levered DeFi strategies. At first glance, they looked productive. But too much of that yield was circular. It depended on token emissions and fresh inflows, not real economic activity. That story is a much harder sell now. What investors want is yield that is durable, transparent, and tied to something real.
The next step is not more crypto-native yield. It is putting onchain dollars into real assets. The opportunity is not to build better wrappers for cash, but to connect onchain dollars to assets investors already know how to price: money market funds, U.S. treasuries, corporate bonds, and credit. This is not about chasing the hottest yield on the screen this week, but about making dollars onchain work harder without making them less useful.
This shift has already started. Tokenized real-world assets are now a meaningful onchain category beyond stablecoins, and tokenized treasuries alone are already worth billions. But treasury tokens by themselves do not fully solve the problem. In most cases, they remain separate investment products. The bigger opportunity is a dollar you can still use across crypto, while it quietly earns from real assets underneath.
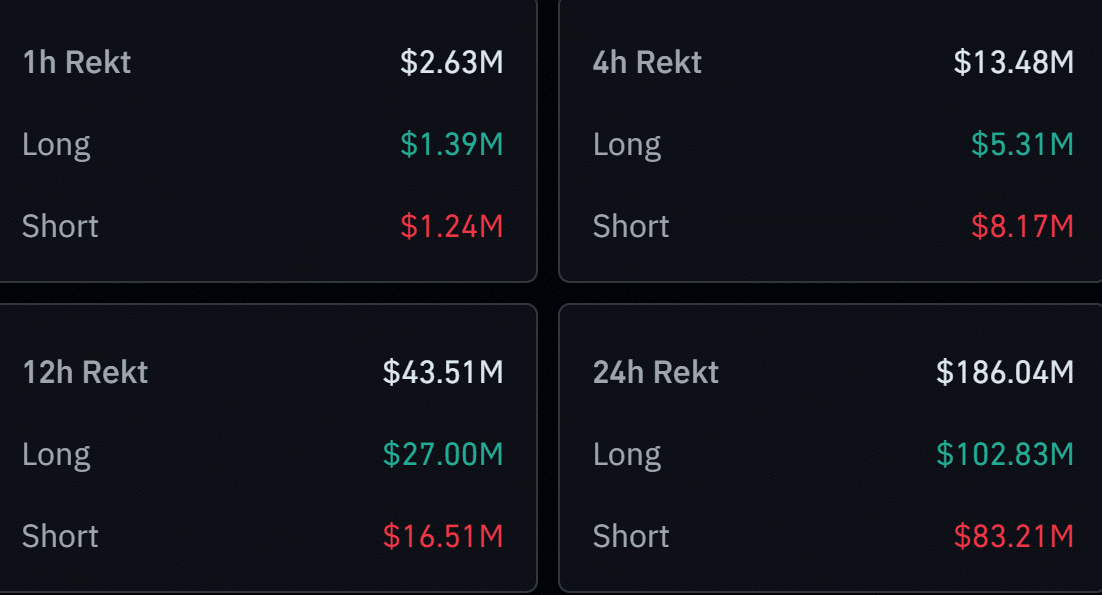
Volatility returned to crypto markets as shifting sentiment triggered another round of forced liquidations. As prices moved aggressively, leveraged positions began unwinding, leading to roughly $186 million in liquidations over the past 24 hours.
Long positions absorbed $102.8 million of the losses, while shorts accounted for $83.2 million, showing that traders were caught on both sides of the move.
Source: CoinGlass
Bitcoin [BTC] led the wipeout with $34.97 million liquidated, followed by Ethereum [ETH] at $24.65 million. The balanced distribution suggests uncertainty rather than conviction, leaving markets vulnerable to further volatility if macro conditions continue tightening.
Whale distribution meets ETF demand
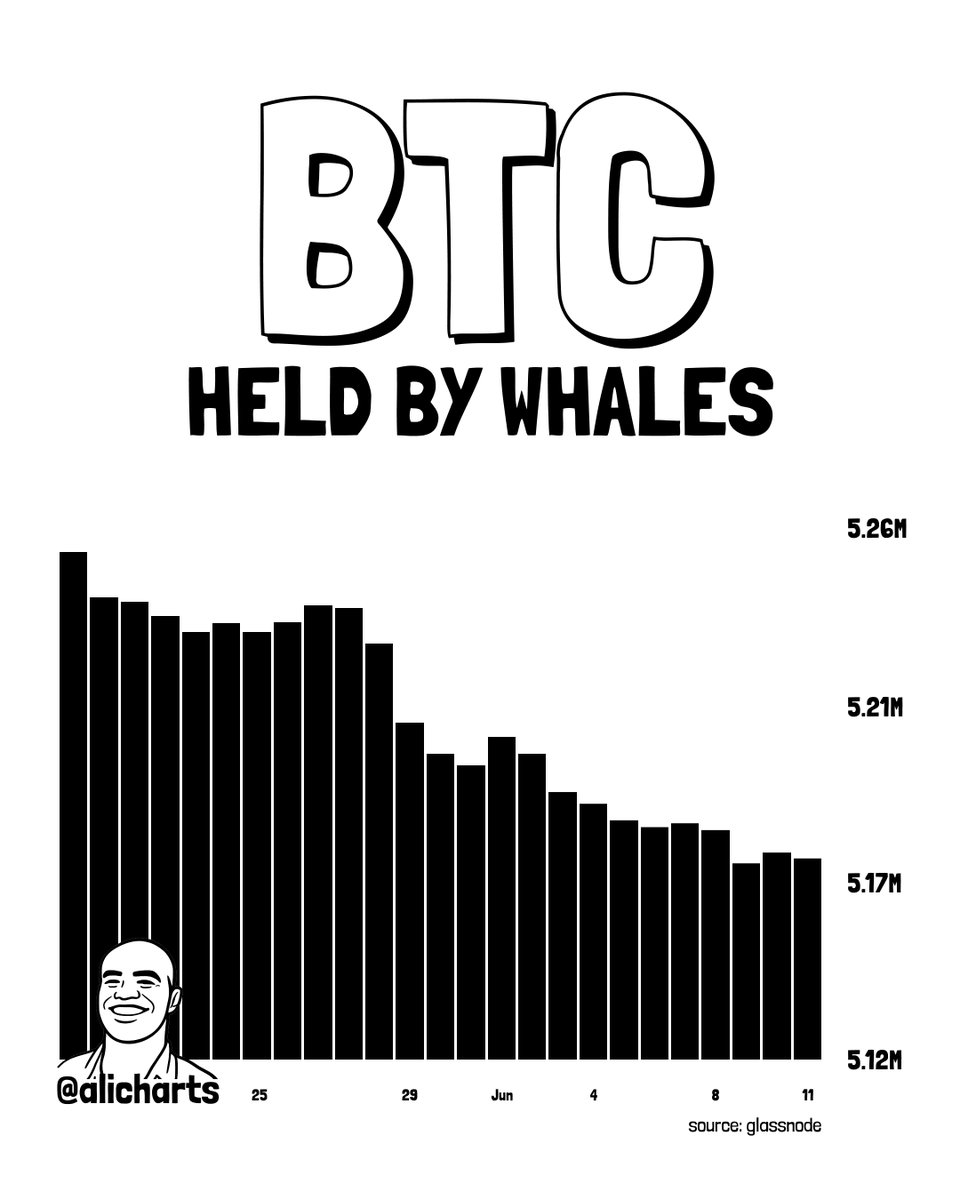
While derivatives traders reacted to volatility, activity in the Spot market continued moving in opposite directions. Over the past month, whales distributed more than 70,000 BTC, increasing available supply as Bitcoin traded below previous highs.
Source: X
The selling suggests some large holders remain cautious amid uncertain liquidity conditions and shifting macro expectations. Yet the additional supply has not overwhelmed demand.
U.S. Spot Bitcoin ETFs attracted $85.85 million in net inflows on the 12th of June, indicating institutions continue allocating capital despite recent weakness.
The divergence helps explain why Bitcoin has weakened without entering a broader capitulation phase. Price remains caught between persistent distribution and steady ETF demand, leaving neither side in clear control.
Ethereum supply continues tightening
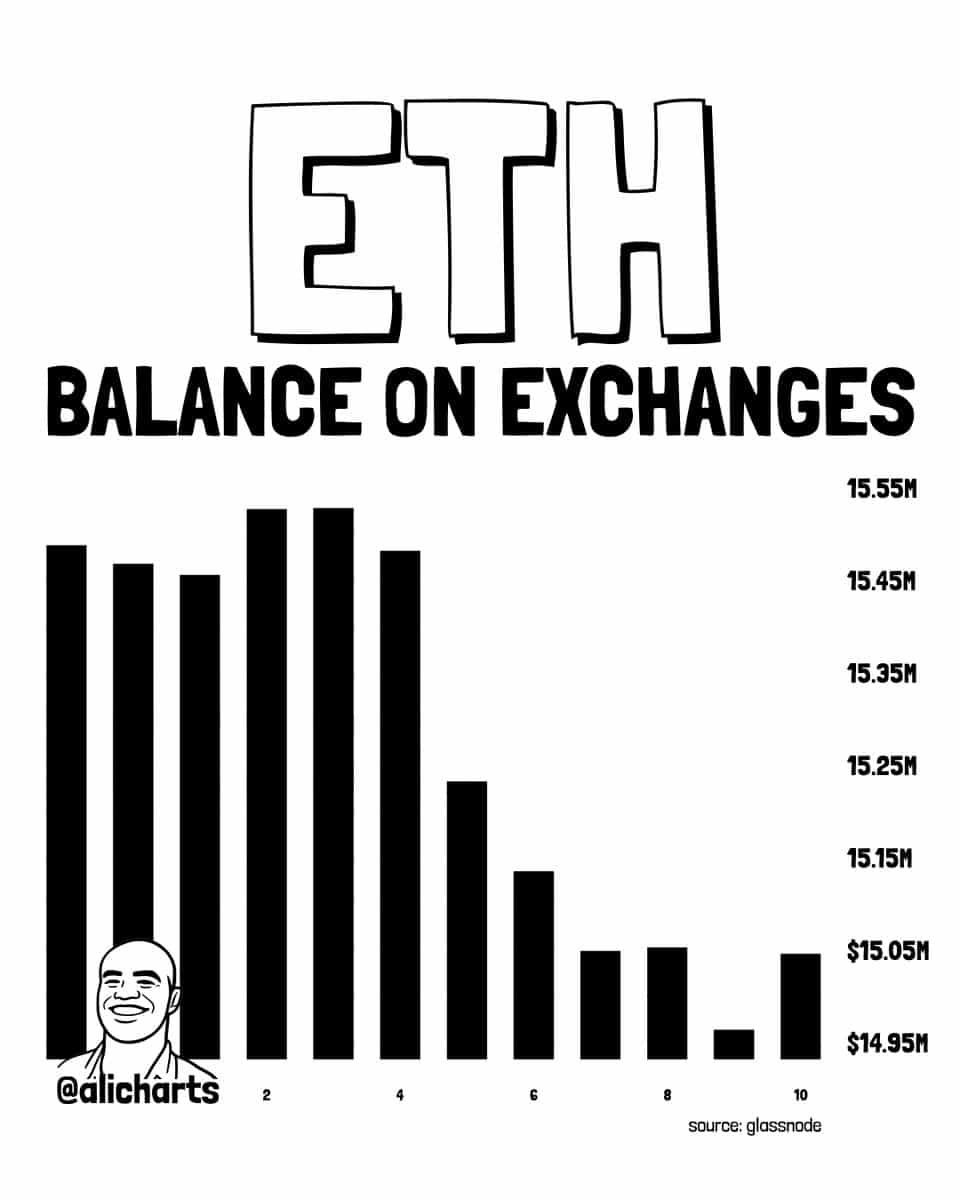
While Bitcoin absorbed fresh supply from whale distribution, Ethereum’s supply moved in the opposite direction. Exchange balances held near 15.5 million ETH early in the period before dropping toward 15.0 million ETH.
The decline coincided with nearly 500,000 ETH, worth roughly $800 million, leaving trading platforms within a week. That shift reduced the amount of ETH immediately available for sale, even as broader market conditions remained fragile.
Source: X
The timing is notable because Bitcoin whales distributed more than 70,000 BTC during the same period. As additional BTC entered circulation, Ethereum’s exchange supply continued contracting.
The divergence suggests selling pressure remains more visible in Bitcoin, whereas Ethereum’s market structure continues tightening beneath the surface.
All in all, persistent Bitcoin selling and Ethereum accumulation leave crypto markets caught between stabilization and further weakness.
Final Summary
Bitcoin and Ethereum liquidations exposed a market still driven by leverage and macro uncertainty.
Memory specialist Micron Technology (NASDAQ: MU) is scheduled to report its fiscal third-quarter results on Wednesday, June 24, after the market closes. And expectations heading into the report are about as high as they get. Shares have surged 244% in 2026, crossing a $1 trillion market capitalization along the way — a milestone only two other memory companies have reached.
That run has been powered by an artificial intelligence (AI) build-out that has turned memory chips into one of the most sought-after components in the data center, and Micron into one of its biggest beneficiaries. But a stock that has climbed this far, this fast, leaves little room for a stumble.
Missed Nvidia in 2009? This Rare Signal Is Flashing Again. In 2009, a “Double Down” signal flashed for a little-known chipmaker called Nvidia. For the first time in years, that same “Total Conviction” signal is flashing for a company 1/100th the size of Nvidia. Continue »
Put another way, the stakes are high. And when the company reports later this month, a single number may tell investors more about whether the story is still intact than any other line in the release.
That number is gross margin.
Here’s a closer look at why this one metric carries so much weight — and what to watch as the report approaches.
Image source: Getty Images.
Why gross margin is the number that matters
When Micron last reported, in March, its results were staggering across the board. Fiscal second-quarter revenue (the period ended Feb. 26, 2026) nearly tripled year over year to $23.86 billion, marking a company record. But the figure that best captured what’s happening inside the business was gross margin, which expanded to about 75% from roughly 37% a year earlier. That is an enormous swing for a memory company, and it speaks directly to pricing.
Memory has historically been a brutal, commodity-like business, with prices swinging sharply as supply and demand fall in and out of balance. What’s different now is that AI demand has collided with tight industry supply, sending prices higher and lifting margins along with them. In the fiscal second quarter, Micron said DRAM prices sequentially rose in the mid-60% range, and NAND prices climbed in the high-70% range.
For the fiscal third quarter, management guided for gross margin to reach about 81%. That would mark yet another step up. And it explains why this is the make-or-break figure: revenue can grow on volume alone, but a gross margin approaching 81% is a direct readout of how much pricing power Micron still holds.
If that number comes in at or above guidance, it confirms the favorable pricing environment is holding. If it slips, it could signal that the best of the pricing cycle is already behind the company.
“We expect higher price, lower cost and favorable mix to all contribute to gross margin expansion in Q3,” said Micron chief financial officer Mark Murphy in the company’s fiscal second-quarter earnings call.
That is the bar the report will be measured against.
The bull and bear cases
The bull case rests on supply that simply can’t keep up. High-bandwidth memory (HBM), a specialized type of DRAM that sits alongside AI processors, has become the tightest part of the chain — and Micron has said its entire 2026 HBM supply is already sold out. That kind of visibility is rare for a chipmaker, and it suggests pricing could stay firm well into next year. And management has even gone further, saying it expects supply and demand for both DRAM and NAND to remain tight beyond calendar 2026.
There’s also a structural argument. As AI models grow larger and lean more heavily on memory, the demand for Micron’s chips may prove more durable than in past cycles.
“In the AI era, memory has become a strategic asset for our customers,” said Micron CEO Sanjay Mehrotra when the company reported in March, pointing to the same dynamic that has reshaped the business.
The bear case is the one that has repeatedly plagued memory stocks: cyclicality. Micron has lived through painful downturns before — most recently in 2023, when oversupply cratered prices and the company posted losses. And rivals Samsung and SK Hynix are notably racing to expand their own HBM output, and Micron itself is projecting more than $25 billion in capital spending this fiscal year. Should that supply arrive faster than AI demand can absorb it, the same pricing leverage now lifting margins could just as easily work in reverse.
So, what should investors make of all this heading into June 24?
With shares trading at a trailing price-to-earnings ratio in the mid-40s after their enormous run, a lot of good news is already baked in. I think the smartest approach is to keep your eyes on that gross margin line rather than the headline revenue number. It may be the best signal of whether Micron’s pricing power — and the thesis behind the stock’s remarkable climb — is still intact.
Should you buy stock in Micron Technology right now?
Before you buy stock in Micron Technology, consider this:
The Motley Fool Stock Advisor analyst team just identified what they believe are the 10 best stocks for investors to buy now… and Micron Technology wasn’t one of them. The 10 stocks that made the cut are built for long-term growth and could produce monster returns in the coming years.
Consider when Netflix made this list on December 17, 2004… if you invested $1,000 at the time of our recommendation, you’d have $433,268!* Or when Nvidia made this list on April 15, 2005… if you invested $1,000 at the time of our recommendation, you’d have $1,259,391!*
That performance is why people listen. With a track record of beating the S&P 500 by nearly 5x, Stock Advisor offers a distinct advantage. Don’t miss the latest top 10 list, available with Stock Advisor, and join an investing community built for the long haul.
Daniel Sparks and his clients have no position in any of the stocks mentioned. The Motley Fool has positions in and recommends Micron Technology. The Motley Fool has a disclosure policy.
For Elon Musk’s company, it’s a rounding error against a valuation of over $1.8 trillion: small enough that the stock will never trade on it, yet large enough to normalize the asset in a way no dedicated vehicle can.
For years, onchain analysts estimated SpaceX held about 8,300 bitcoin. The S-1 then revealed the real number was more than twice that, meaning one of the most scrutinized private companies in the world held a billion-dollar bitcoin position, and the public’s best guess was off by half until securities law forced the answer.
Now the position lives under public company rules.
Fair-value accounting means every quarterly report marks bitcoin to market, recording gains and losses whether or not SpaceX trades the coin. Tesla showed how that looks in a drawdown, booking hundreds of millions in paper losses on a position it wasn’t selling.
SpaceX arrives with bitcoin 37% already below its January high, though its roughly $35,000 cost basis means the stake is still up about 80% from its initial buys.
Neither Tesla nor SpaceX — both Elon Musk-owned firms — have ever shown an appetite for trading its stack. These companies continue to hold (at least for now) bitcoin through public earnings cycles and analyst questions, while the position swings, hands every Fortune 500 finance chief a working example of a mega-caps that treat bitcoin as a reserve asset, absorbs the earnings noise and moves on.
Selling $1.36 million in embedded gains all in one year triggers the 20% federal LTCG rate, 3.8% NIIT, and state taxes, representing a swing of over $400,000 compared to smarter paths.
Spreading sales across four retirement years keeps most gains in the 15% federal bracket, typically saving six figures in taxes versus a single-year liquidation.
The NUA election lets 401(k)-held employer stock’s $1.36 million in appreciation be taxed at long-term capital gains rates instead of ordinary income rates, provided the mechanics are executed correctly.
Are you ahead, or behind on retirement? SmartAsset’s free tool can match you with a financial advisor in minutes to help you answer that today. Each advisor has been carefully vetted, and must act in your best interests. Don’t waste another minute; learn more here.
A 64-year-old software executive walks out of the office on her last day with $1.6 million sitting in a single employer stock. Her cost basis is $240,000, meaning roughly $1.36 million is embedded long-term capital gain waiting to be triggered. She has no W-2 income starting next January, a paid-off house, and a 401(k) she has not touched. The real question is how to unwind the position without handing the IRS, her state, and Medicare a tax bill that could swing by more than $400,000 depending on the path she picks.
XiXinXing / Shutterstock.com
This situation is common in late-career tech, finance, and pharma. Concentrated stock built through grants, options, and an employee stock purchase plan can become the largest line item on the balance sheet. SEC filings show executives at Coca-Cola (NYSE:KO), Seagate Technology (NASDAQ:STX), and Republic Services (NYSE:RSG) unwinding positions through Rule 10b5-1 plans and option exercises. Done poorly, the tax drag can erase a decade of compounding.
The single biggest financial tension is bracket management. Federal long-term capital gains are taxed at 0%, 15%, or 20%, with the top rate hitting once taxable income clears roughly the upper-middle bracket. The Net Investment Income Tax of 3.8% kicks in at $200,000 of modified adjusted gross income for a single filer and $250,000 for a joint filer. Those NIIT thresholds were set by statute in 2013 and have never been indexed for inflation, so almost any large one-year sale crosses them. State tax then stacks on, ranging from 0% in Florida or Texas to north of 10% in California or New York.
For context on the reinvestment side, the 10-year Treasury is yielding about 4.5%, near the upper end of its 12-month range, and the Fed funds upper bound has held at 3.75% since December. Proceeds reinvested today earn a real return, which makes the after-tax dollar that survives liquidation worth defending.
Path A: Sell Everything in One Year
Selling the entire $1.36 million gain in 2026 pushes her into the 20% federal LTCG bracket on most of the gain, adds the 3.8% NIIT on the portion above the threshold, and stacks state tax on top. In a mid-tax state, the combined hit easily lands in the high-20% range on the gain.
Path B: Spread Sales Across Four Retirement Years
With no wage income, her taxable income in 2027 starts near zero. By harvesting roughly a quarter of the position each year for four years, she can keep the bulk of each year’s gain inside the 15% federal LTCG bracket and stay under or just at the NIIT threshold. The 0% bracket can absorb a sliver before Social Security and 401(k) withdrawals begin. For most retirees in this profile, this is the default choice. The arithmetic typically saves six figures versus Path A, and the only real risk is the stock falling materially before she finishes selling.
Are you ahead, or behind on retirement? SmartAsset’s free tool can match you with a financial advisor in minutes to help you answer that today. Each advisor has been carefully vetted, and must act in your best interests. Don’t waste another minute; learn more here.
Path C: The NUA Election If Shares Sit Inside the 401(k)
If any of the $1.6 million is held inside her employer 401(k), Net Unrealized Appreciation is an underused move in the code. She takes a lump-sum distribution of the shares in kind. The $240,000 basis is taxed as ordinary income today. The $1.36 million of appreciation is taxed at long-term capital gains rates only when she sells, even if she sells the next day. Anything she does not sell during her lifetime passes to heirs with a step-up in basis at death. NUA usually wins when the basis is low relative to the position.
Path D: A Charitable Remainder Trust
If she already plans to leave money to charity, contributing the shares to a Charitable Remainder Trust lets the trust sell the stock with no immediate capital gains tax, pay her a lifetime income stream (typically 5% to 7% of the trust value annually), and direct the remainder to charity at death. She also gets a partial income tax deduction in the year of the gift. The tradeoff is irrevocability and lower lifetime cash flow than an outright sale would produce. This path only makes sense if charitable intent already exists.
What to Do First
Two concrete next steps:
Find out where the shares actually live. Brokerage account, ESPP, RSU vesting account, and 401(k) shares are taxed under different rules. NUA is only available for employer stock inside the qualified plan, and the election must happen as part of a lump-sum distribution in a single tax year. Miss the mechanics and the option disappears forever.
Model 2027 through 2030 taxable income before selling a single share in 2026. The window between retirement and the start of Social Security and required minimum distributions (currently age 73) is the lowest-bracket stretch most retirees will ever see. Filling that window with gains taxed at 0% and 15% is where the $400,000 swing comes from.
The common mistake is selling everything in the retirement year itself, when severance, deferred compensation, final RSU vests, and bonus payouts often push ordinary income to a career high. Pairing peak ordinary income with a fully realized concentrated position is how a six-figure tax bill becomes a seven-figure one.
If You’ve Been Thinking About Retirement, Pay Attention (sponsor)
Retirement planning doesn’t have to feel overwhelming. The key is finding expert guidance, and SmartAsset’s simple quiz makes it easier than ever for you to connect with a vetted financial advisor. Here’s how:
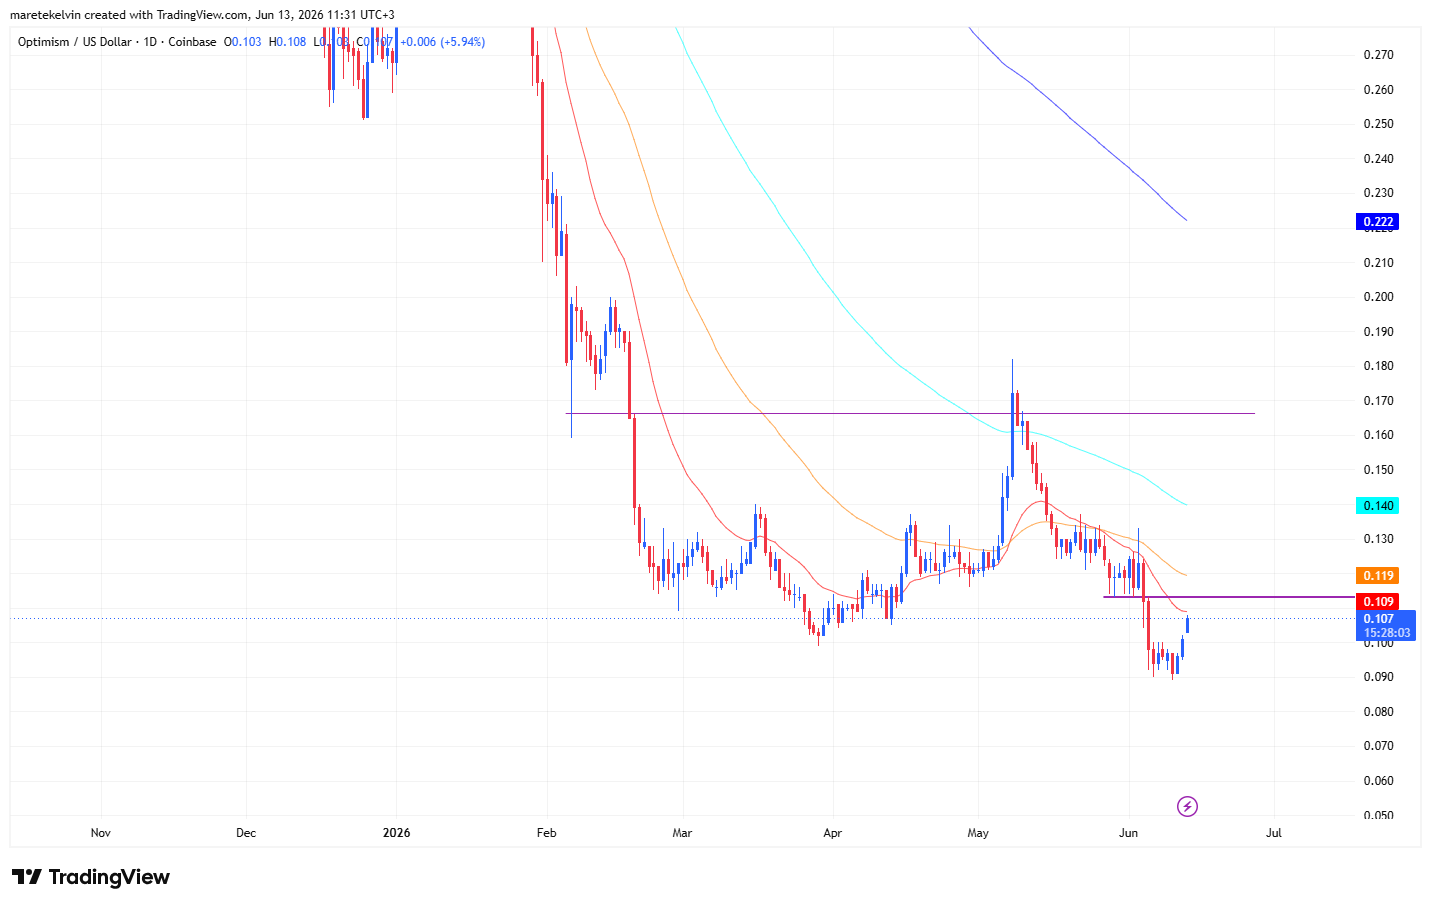
Optimism may finally be showing signs of life after weeks of bearish run.
The token has started to stabilize as buyers attempt to regain control of the trend. Investors and buyers’ attention is now shifting toward the $0.113 imbalance zone, a key area that could act as the next major target if the current recovery continues.
What’s more intriguing is the improving price action is being accompanied by a noticeable increase in network activity.
Source: TradingView
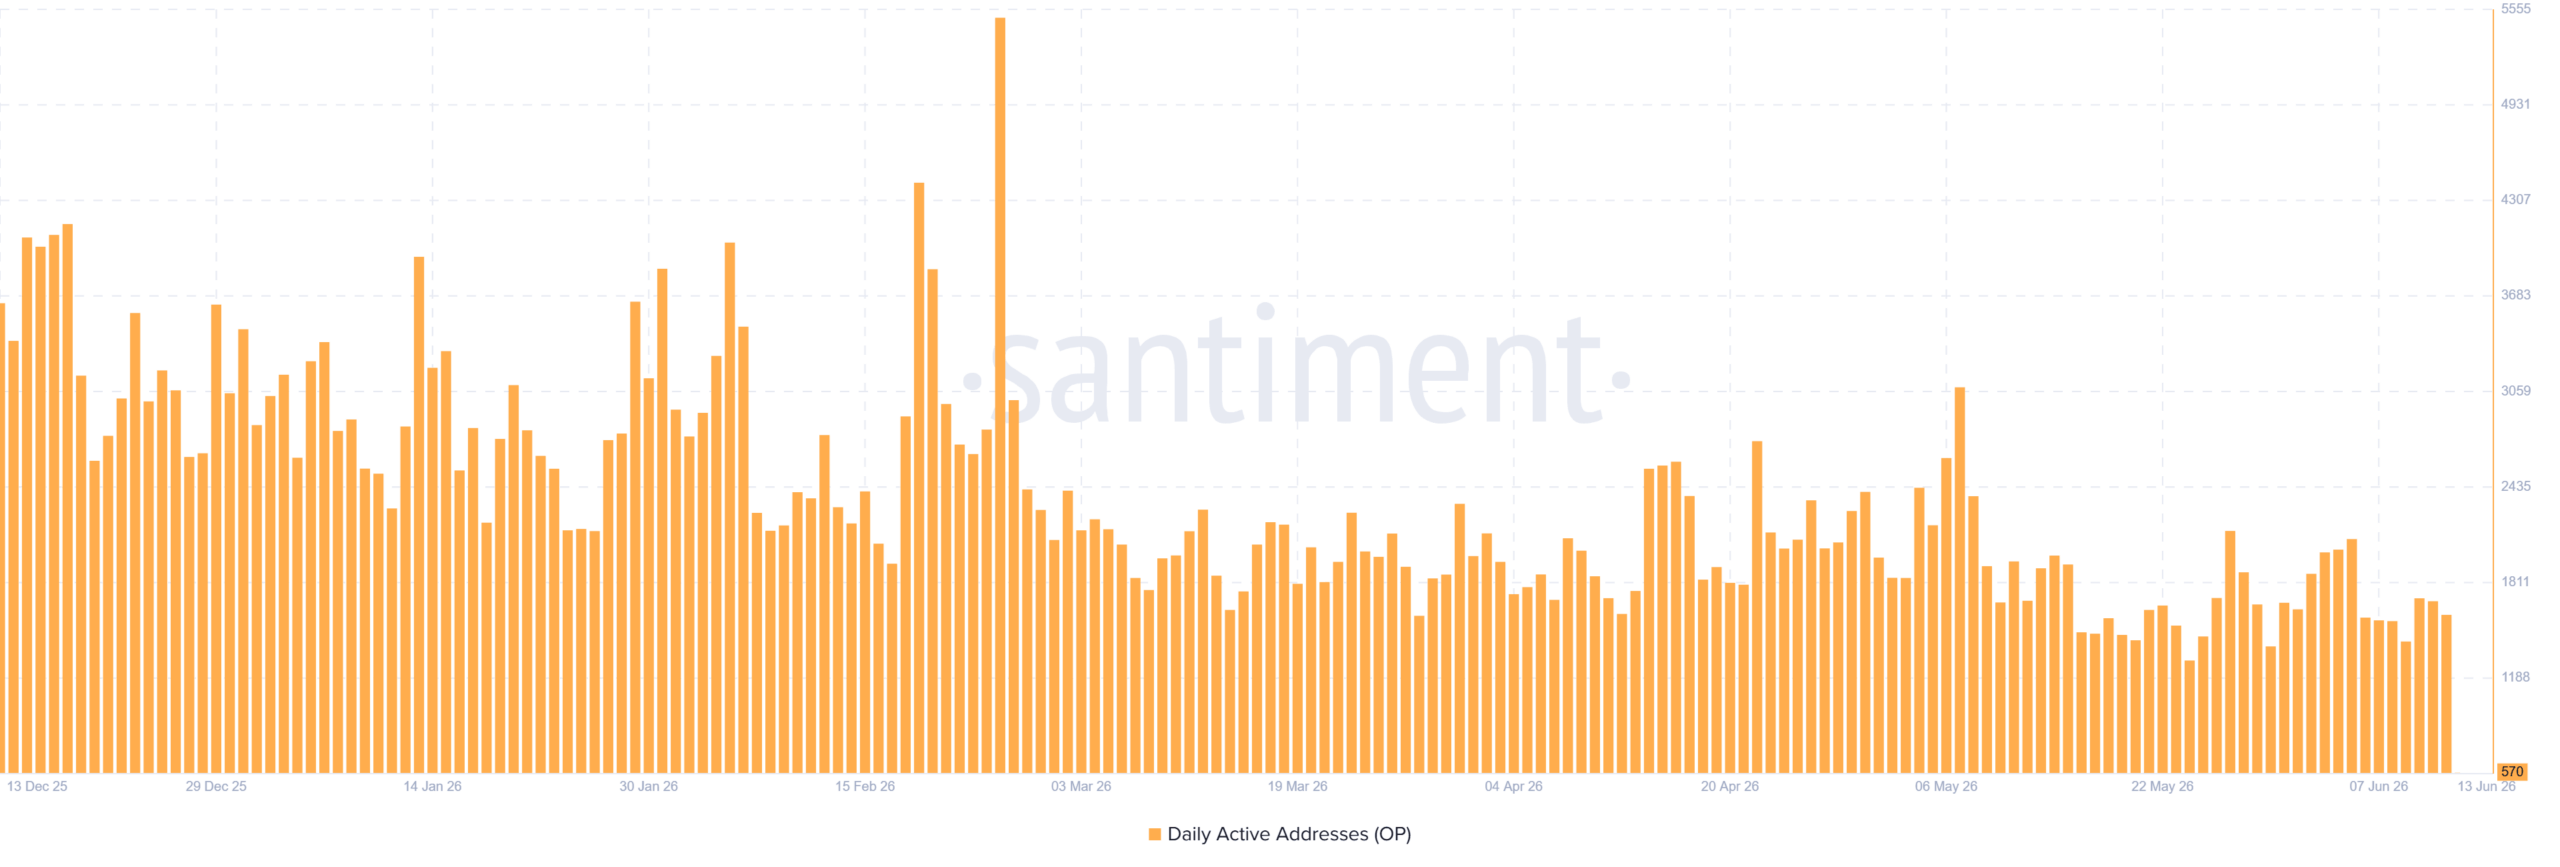
Activity returns to the network
Recent derivative data shows network activity has climbed back to levels last seen at the beginning of the month’s correction. The number of active addresses has surged to new levels witnessed in the earlier correction back in the beginning of the month.
That suggests users and traders are becoming active again after a period of reduced participation. Historically, rising activity has often coincided with stronger market interest, especially when it appears alongside improving price action.
For Optimism, it’s one of the first signs that sentiment may be starting to shift.
Source: Santiment
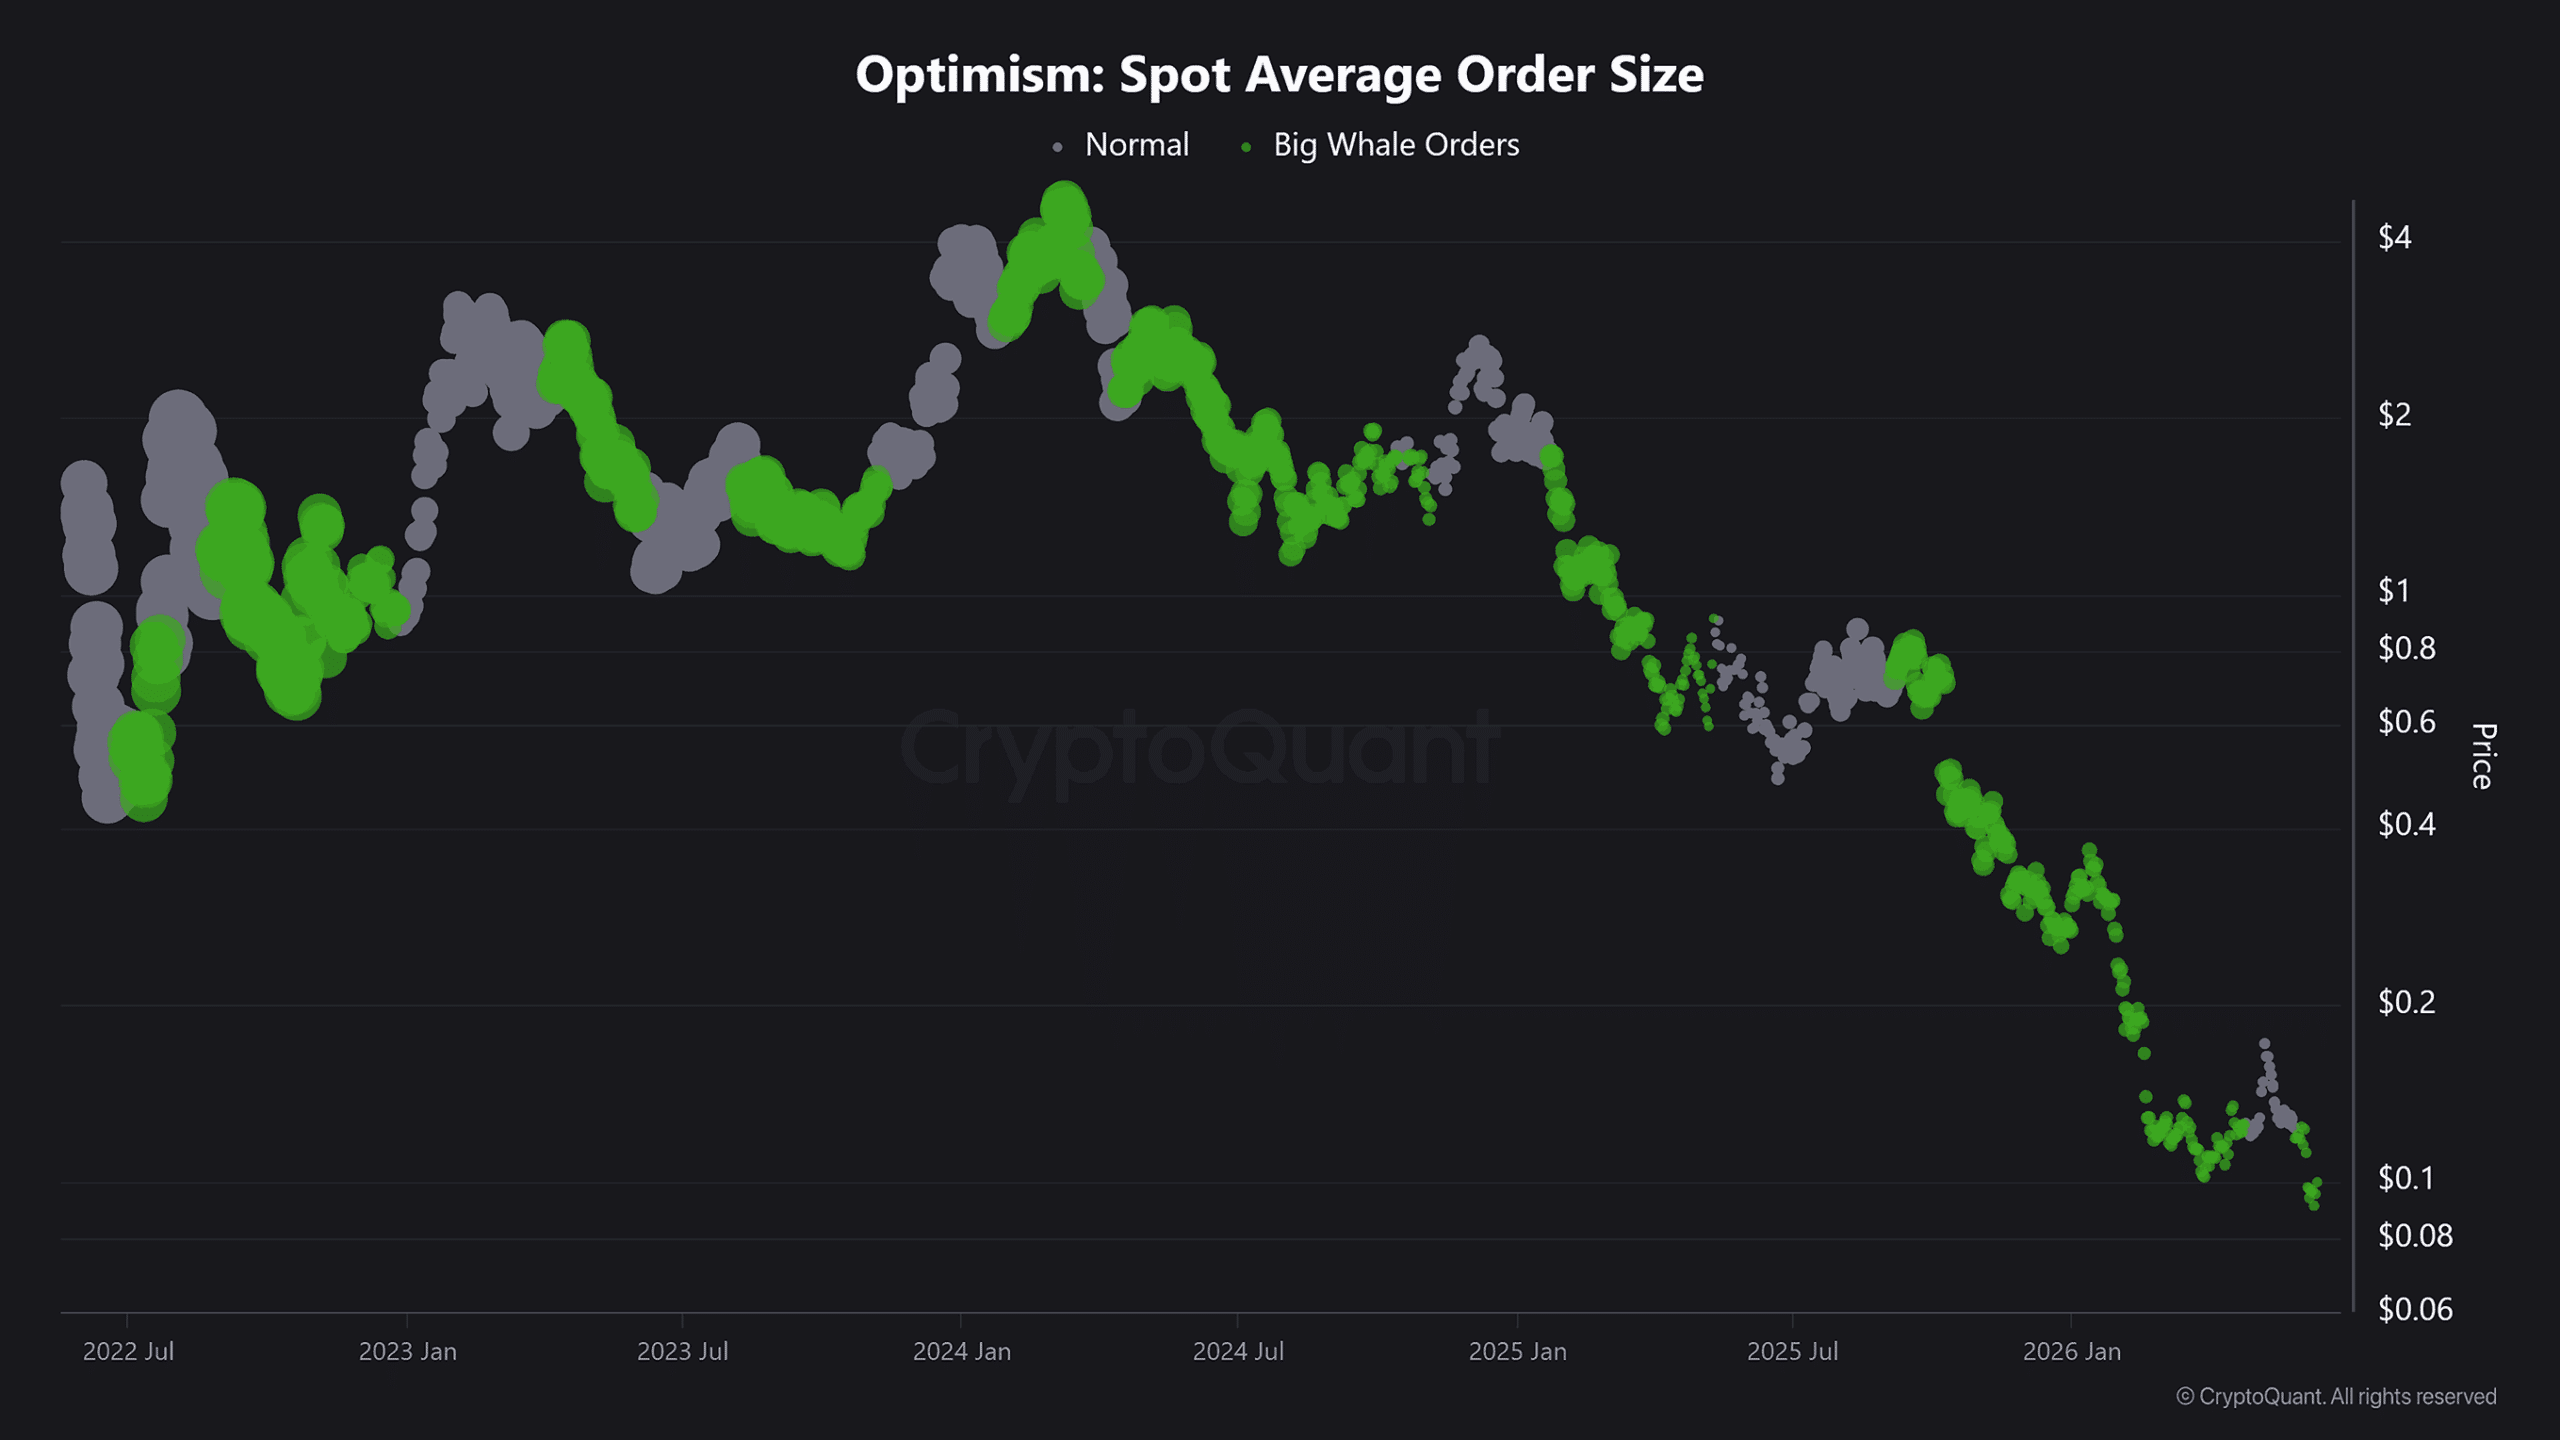
Whales continue to accumulate
Large holders also appear to be positioning for higher prices.
The number of large orders on the network has increased significantly, suggesting that some investors are using recent weakness as an opportunity to build exposure. That’s a notable development given that broader market sentiment remains cautious.
The growing whale presence could provide the buying support needed for OP to push toward higher levels. The last time whale orders were at this level, the token rallied aggressively.
Source: CryptoQuant
Can OP reach the imbalance zone?
One factor worth watching is Open Interest.
Unlike activity and whale accumulation, Open Interest has largely flattened. That suggests traders are not yet aggressively increasing leveraged positions despite the improving outlook.
For now, bulls have a clear objective. If network activity remains elevated and whale accumulation continues, Optimism could have a realistic path toward reclaiming the $0.113 imbalance zone. The question is whether buyers can maintain the momentum long enough to get there.
Final Summary
OP is showing signs of recovery, with the $0.113 imbalance zone emerging as the next key target level for the network’s bulls.
Network activity has rebounded sharply, while whale accumulation continues to increase.