Home Blog Page 50

Russia is suffering from a slow-motion bank run as the Kremlin scavenges for war funding

0
Russia is suffering from a slow-motion bank run as the Kremlin scavenges for war funding

A financial crisis that has long been predicted by Russia experts and Kremlin insiders appears to have finally arrived as banks see depositors scramble to pull out their money amid fears it may be seized.

In the first half of August, Russians withdrew $3.4 billion (286.4 billion rubles), according to central bank data cited by the Washington Post. That’s after $7.3 billion was withdrawn in July and $4.5 billion in June.

“Drones are flying. Things are burning down. Nervousness is growing. And people’s everyday wisdom may be kicking in that they need to have cash under their pillow and not somewhere in banks where it may never be returned,” a former finance official told the Post, adding that banks have much of their capital tied in loans elsewhere.

The situation echoes the iconic scene from the movie It’s a Wonderful Life, when panicked depositors show up at the Bailey Bros. Building & Loan demanding their cash, only to learn that it’s not all there.

The bank run in Russia may not be as dramatic or precipitous. But the stampede out of lenders this year is on track to nearly double the $24.7 billion pace that was seen in 2022, when Vladimir Putin launched his invasion of Ukraine.

Back then, Russia was flush with cash and expected to pay for a short war. But more than four years later, the invasion has turned into a quagmire that has crushed the Kremlin’s finances.

The budget is sinking into deeper deficits, the sovereign wealth fund has been nearly depleted, and tax hikes are straining consumers who are already struggling with high inflation.

Moscow has directed banks to offer capital to the defense industry, but many of those loans turned into bad debts. Now, the financial sector’s loss of deposits has created a liquidity crunch so severe that it’s threatening Russia’s ability to fund its war.

Taras Skvortsov, a senior executive at top retail lender Sberbank, told Russian radio that many banks don’t have cash on hand to buy government bonds.

In fact, the finance ministry halted bond auctions indefinitely last month amid higher borrowing costs and weak investor demand. The auctions are the Kremlin’s main source of domestic borrowing to fill its budget deficit, which hit $76 billion at the end of July.

As the government’s sources of funding dry up, ordinary Russians fear their money may be next. The leader of Russia’s Communist Party told parliament recently that 130 trillion rubles held in bank accounts should be “mobilized” to address the country’s economic and budget woes.

Meanwhile, the finance ministry is preparing legislation that could let it gain access to $40 billion in pension savings held in privately managed funds.

That’s after Russian oligarchs have seen their businesses nationalized, with $51.5 billion in assets seized for the state last year.

“If the government needs cash, Putin will just do a grab for assets. He doesn’t care,” an associate of a Russian billionaire told the Post. “And that’s where I think it’s heading.”

Warnings about Russia’s finances have been building for months. In June 2025, Russian banks raised red flags on a potential debt crisis as high interest rates weighed on borrowers’ ability to pay off loans. Also that month, the head of the Russian Union of Industrialists and Entrepreneurs warned many companies were in “a pre-default situation.”

The Center for Macroeconomic Analysis and Short-Term Forecasting, a state-backed Russian think tank, said in December the country could face a banking crisis by October if loan troubles worsen and depositors pull out their funds.

Earlier this year, Russian officials told Putin that a financial crisis could hit by the summer amid spiraling inflation. 

In May, sources told the Russian newspaper Izvestia that nearly 25% of the bond market is now at risk of default as businesses that borrowed at low rates must refinance at much higher ones. The volume of debt that needs to be rolled over this year is about double from last year, adding pressure on cash flows and raising competition for liquidity.

And according to a European intelligence report this past June, Russian lenders are vulnerable due to soaring indebtedness and deteriorating loans. It said the number of Russians who declared bankruptcy last year jumped by almost a third to more than 500,000.

“The situation creates the illusion of a dynamic economy ⁠that, in reality, conceals an explosive situation which an economic shock, such as an ambitious package of sanctions against banks … could trigger,” the report added, according to Reuters.

The worsening state of Russia’s financial sector mirrors its performance on the battlefield. New Ukrainian tactics and drones have halted Russia’s advance, decimated the country’s oil infrastructure, and pushed casualties above the replacement rate.

And just like Russia’s search for money to seize, reports indicate the military is preparing to ramp up the number of men it seizes to fill the ranks.

Authorities have already been using coercive tactics to find fresh troops. Now, sources told the Wall Street Journal that the military is preparing plans and procedures for a wider mobilization.

But because of an expected political backlash, the Kremlin may wait until after parliamentary elections next month to announce it.

An earlier mobilization in September 2022 set off a mass exodus of hundreds of thousands of men, who fled to neighboring countries like Georgia and Kazakhstan.

Rumors of a new one have already sent cross-border traffic soaring. In addition, property prices have jumped recently in Georgia and Armenia in anticipation of another exodus, real estate agents told the Journal.

Source link

Mohamed El-Erian says 30-year Treasury yield at 5.27% signals a structural shift that will make America more expensive

0
Mohamed El-Erian says 30-year Treasury yield at 5.27% signals a structural shift that will make America more expensive


For economist Mohamed El-Erian, sky-high interest rates on U.S. bonds are the harbinger of an even greater affordability crisis.​

“This is no ordinary bond-market sell-off,” El-Erian announced in his latest opinion piece for The New York Times. The former PIMCO CEO argued that, if selling pressure on bonds continues, “it could mark the beginning of a structural economic shift more enduring and more globally consequential than most previous episodes of market volatility.”

Must Read

Despite the U.S. Treasury’s announcement to ramp up its long-term bond buyback sizes to $4 billion, selling hasn’t abated. Currently, the U.S. 30-year Treasury has a yield of 5.27%, a level El-Erian notes was last seen in 2007. The 10-year and five-year bonds are also both climbing, currently at 4.736% and 4.426%, respectively.

With the national debt crossing the $40 trillion threshold, those high percentages translate to humungous piles of money.

According to the latest data from the Congressional Budget Office (CBO), net interest on public debt for fiscal year 2026 is now $963 billion. That makes paying off interest second only to Social Security in yearly government spending.​

El-Erian added: “That means more federal revenue goes to service the debt — nearly 20% — leaving less available for, say, defense or health care.” The longer this issue festers, the more likely there will be “considerable risks to our well-being.”

An “unsettling” environment

​It’s not just the size of bond yields and the national debt that has El-Erian worried. In his post, he walks through the unique causes driving the current bond chaos — causes he feels make it nearly impossible for policymakers to offer a quick fix.

Unlike bond yield spikes in the past, El-Erian doesn’t believe “runaway inflation” is the key cause. In El-Erian’s mind, “what has surged is the real yield, or the extra, inflation-adjusted compensation that investors demand to bear the risk of buying debt in a more volatile world.” Because of that, he believes that “it’s unsettling out there right now.”​

On the one hand, El-Erian pointed to intense borrowing from hyperscalers furiously building their AI data centers. Citing stats from Goldman Sachs, El-Erian writes these Big Tech companies have “already sold almost $500 billion in bonds this year and will probably borrow a minimum of another $300 billion by year’s end.”​

Although El-Erian hopes “the investment in artificial intelligence will deliver higher productivity that generates significant income growth,” he advises that “any profound transition needs to be managed carefully,” and restraining corporations with rate hikes probably won’t be enough as the “FOMO is palpable” in AI.

Along with the intense capital demand from tech corporations, traditional U.S. bond buyers aren’t showing up due to their own internal issues.

El-Erian pointed to Japan as a prime example. As the yen dipped to lows not seen since the 1990s, fears grew that the country would start selling off U.S. bonds to keep its currency afloat. As The Financial Times reported, the U.S. Treasury got involved in the FX market, buying yen with euros, to help Japan while avoiding an even nastier bond selloff.

Read More: Vanguard reveals what’s coming for U.S. stocks — and it could be bad news for this group of investors

Who will feel the bond market’s bite?

​The melt-up in U.S. bond yields has already triggered a lot of crazy moves throughout global markets.

Notably, the U.S. dollar’s strength is now waning, falling to roughly 98.84 versus 101.53 just a few months ago.

At the other extreme, traders are pouring billions into assets traditionally seen as “inflation hedges.” For instance, gold and Bitcoin are both up in the past month.

But what does all this mean for Main Street?

Although Freddie Mac reported a slight decline in the 30-year mortgage rate to 6.65%, El-Erian says housing — along with auto and credit card balances — are in the “cross hairs” of these bond market woes.

El-Erian said he believes that “low-income households” are about to feel the brunt of the bond chaos, adding that higher rates “will sideline even more prospective first-time home buyers and inflate the everyday cost of transportation.”

Or, as El-Erian put it in his title: “America is about to get more expensive.”

What To Read Next

Join 250,000+ readers and get Moneywise’s best stories and exclusive interviews first — clear insights curated and delivered weekly. Subscribe now.

This article originally appeared on Moneywise.com under the title: Mohamed El-Erian says 30-year Treasury yield at 5.27% signals a structural shift that will make America more expensive

This article provides information only and should not be construed as advice. It is provided without warranty of any kind.


Source link

Crypto market’s weekly winners and losers – PEPE, PUMP, WLFI, HTX

0
Crypto market’s weekly winners and losers - PEPE, PUMP, WLFI, HTX


Crypto was up big this week.

Bitcoin [BTC] climbed over 20%, nearing $80k. A wave of ETF inflows, liquidity improvements, and a risk-on mood contributed to the rally. The bullish trend was accompanied by the strong performance of altcoins. 

Large-cap and mid-cap coins saw considerable gains, while smaller ones recorded minor losses of 1-2%. This development is yet another sign of the risk-on scenario that has been unfolding recently.

Weekly winners

Ethena [ENA] sees a FOMO-driven rally

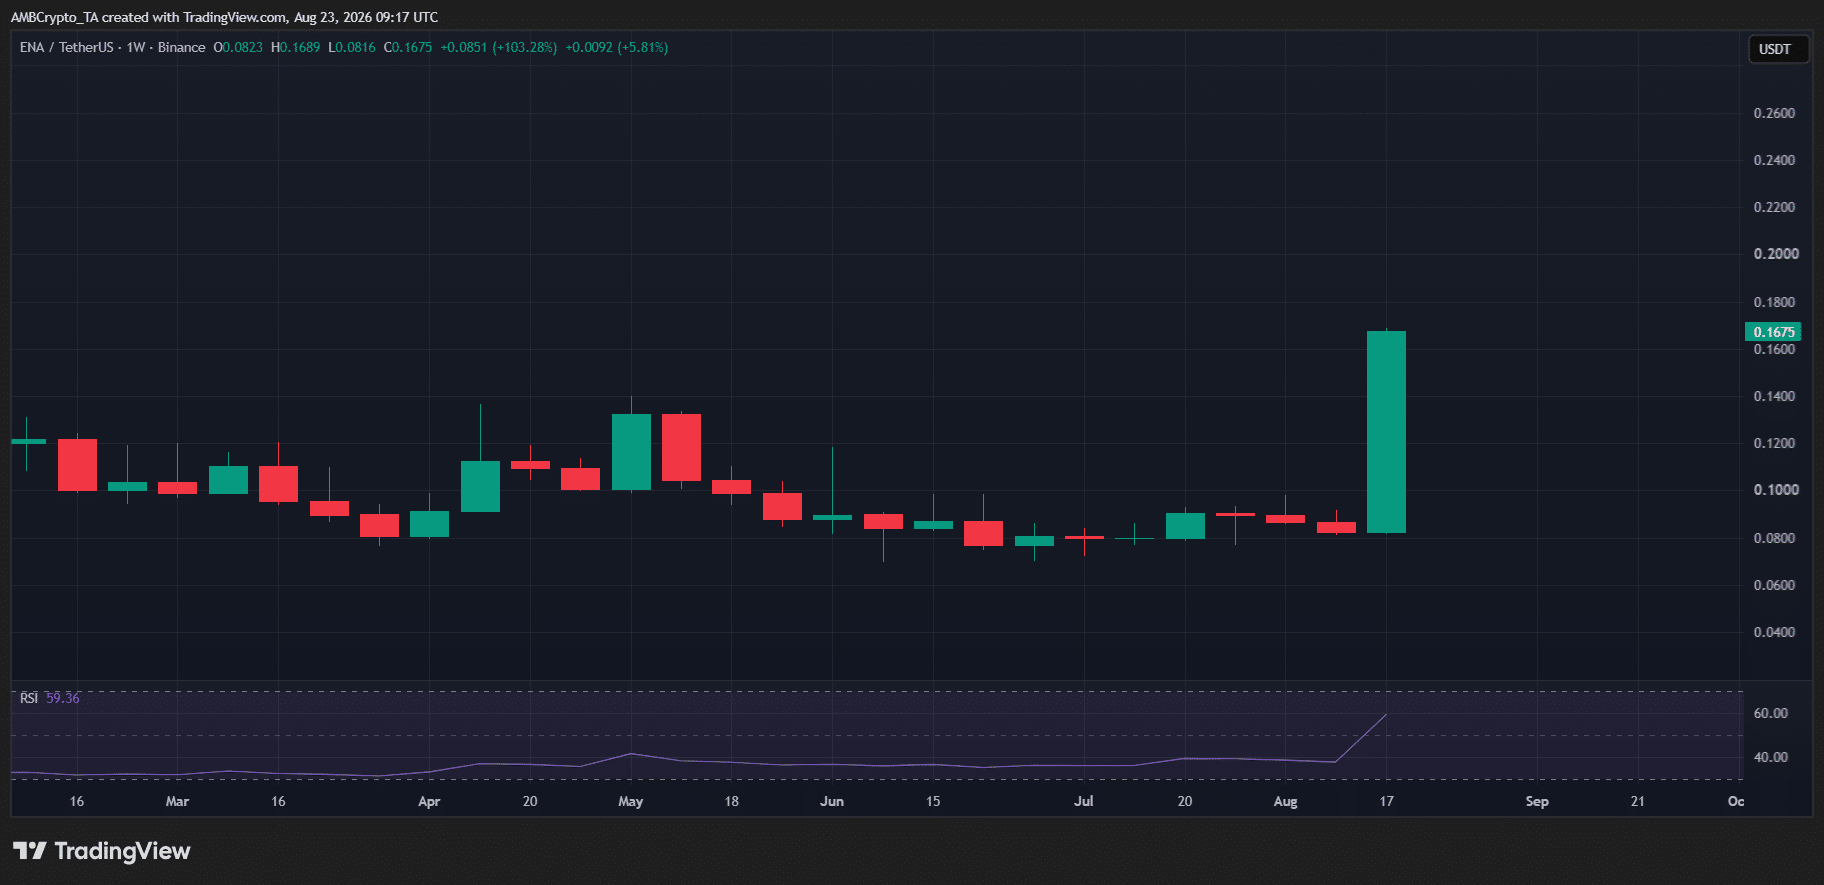
Ethena’s [ENA] price is up more than 100% on the week, topping the rankings in terms of performance. But what’s next for the token? Can ENA sustain its bullish run through September?

Well, the setup suggests that not only is this possible but likely, considering the confluence of favorable factors for the cryptocurrency at the macro level. ENA is seeing a powerful bullish trend following the risk-on rally on the broader market, which is a positive sign for the token. The improving risk appetite usually sends the traders into higher-beta assets, and the FOMO effect can propel even more gains.

Furthermore, the good news is that ENA’s technicals don’t show any sign of entering overbought territory just yet, suggesting additional room for gains. The token broke above the $0.15 level for the first time since Q1, so the bulls have reason to believe that the next round of moves higher is possible.

ENA
Source: TradignView (ENA/USDT)

Taken together, these factors suggest ENA could stay on a bullish track and keep the momentum going into next week. If buyers continue to hold control, a move toward $0.20 in the near term looks possible.

Pump.fun [PUMP] continues its bullish momentum

Pump.fun [PUMP] took the second place, being recognized for its outstanding 95% increase. Unlike ENA, which remains to approach the overbought area, PUMP’s RSI shows a tendency to reach overbought levels.

From a technical perspective, it is worth noting that PUMP is approaching the critical level of $0.006 resistance once again. This level was previously identified as a strong barrier following the October crash. Therefore, the next strong move to the upside should be watched closely as bears may take profits after PUMP’s RSI reaches overbought territory.

As a result, it is essential to monitor this memecoin launchpad closely, as there is a possibility of liquidations taking place in the coming week. Afterward, Pump.fun [PUMP] is expected to enter a short consolidation phase, taking profits from the speculative longs.

PEPE [Pepe] reaches a KEY resistance level

PEPE [PEPE] surged to the third position on the memecoins’ charts this week after recording a total gain of 55%. In an interesting turn, the memecoin appears to be on the verge of breaking out above the $0.000004 resistance with several factors supporting this scenario.

First, the overall market environment shifted to a risk-on mode, creating favorable conditions for memecoins to benefit from the inflows. Another positive sign is PEPE’s relatively low RSI, suggesting that the asset could attract significant attention from investors. 

Finally, on-chain data show that PEPE is one of the top three memecoins in terms of inflows, alongside PUMP and TRUMP. Therefore, with the risk-on sentiment dominating the market, it is reasonable to expect that PEPE will be able to surpass $0.000004 and potentially continue its upward move next week.

Other notable winners

Outside of the majors, altcoins also saw their share of activity this week.

Tutorial [TUT] was the clear winner, surging 103%, followed by NockChain [NOCK], which climbed 101%, and Octra [OCT], which jumped 89% in the weekly performance roundup.

Weekly losers

World Liberty Financial [WLFI] bears regain control

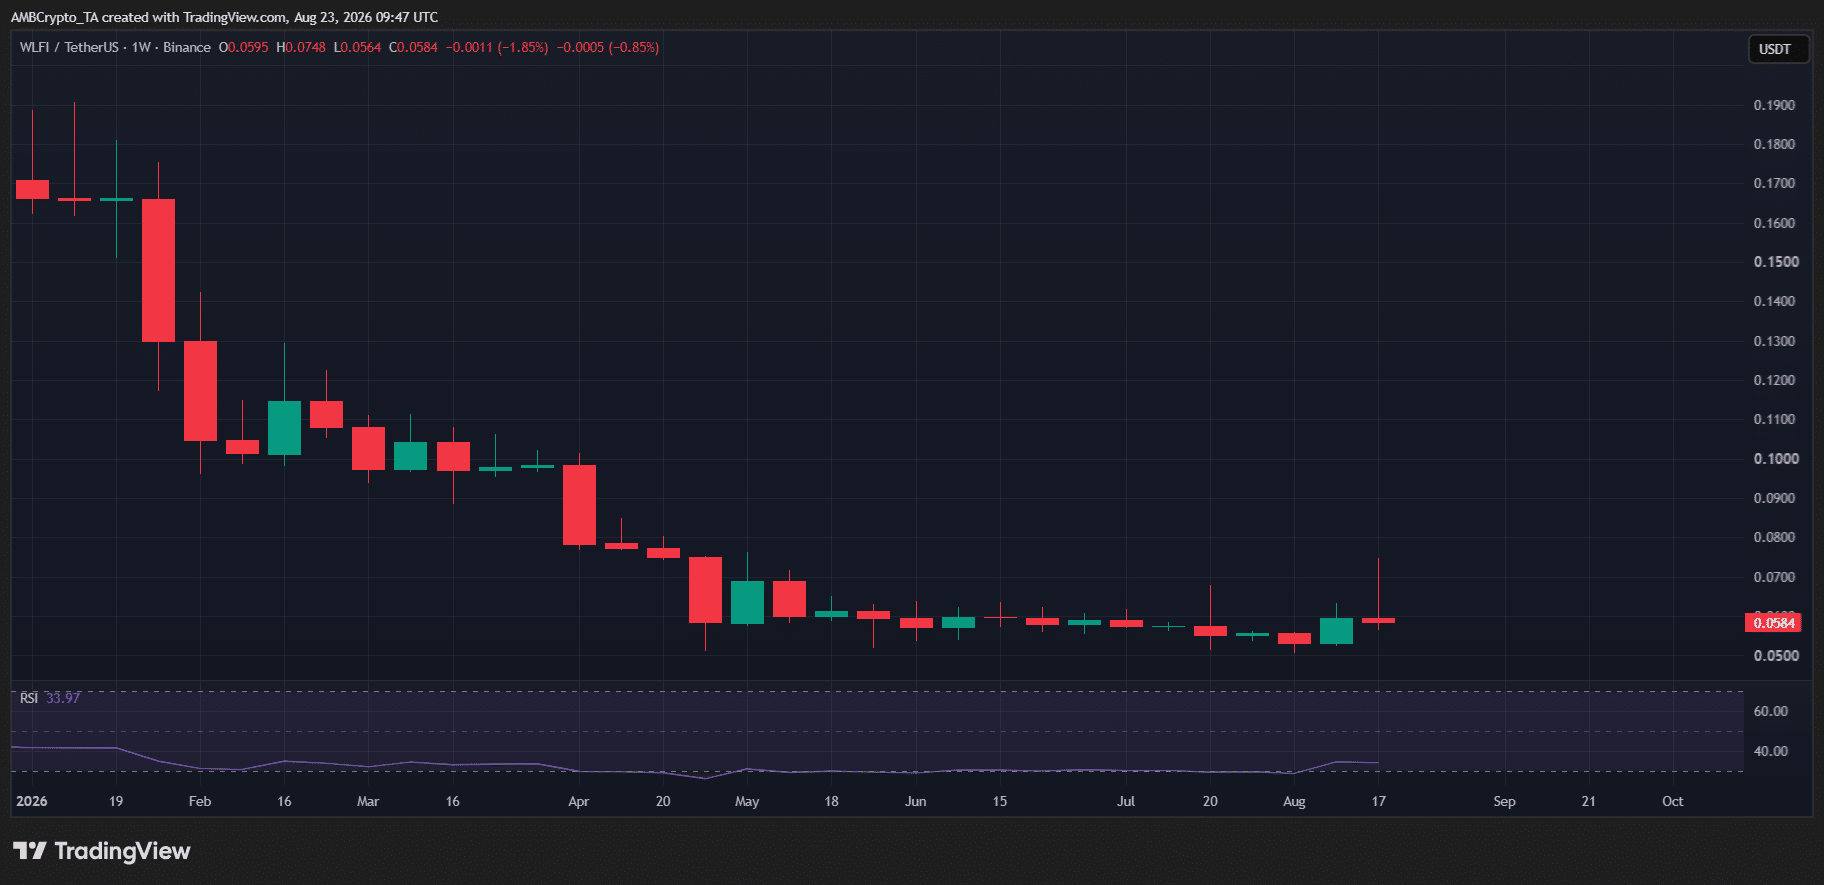
World Liberty Financial’s [WLFI] token has recorded the biggest weekly loss this week, registering a 2% drop in price. While the decline may appear insignificant on the surface, it is noteworthy.

To put the technicals in perspective, last week’s token price surged by 11%. The market environment has equally shifted from risk-off to risk-on this week. Considering the dynamics, it was expected that WLFI would experience an uptick in buying flow as the broader market sentiment turned positive.

The fact that the RSI indicator had entered the oversold territory and bears had failed to capitalize on the short-selling opportunity is also a major concern. Typically, the situation should have allowed room for bulls to initiate fresh long positions.

wlfiwlfi
Source: TradingView

However, WLFI has continued to struggle in the short term, failing to hold on to the gains recorded last week. The bears’ inability to build on their winning streak adds credibility to the bears’ short-term dominance in the WLFI token.

Consequently, the WLFI token is highly unlikely to reverse its downward trajectory without a significant buying intervention in the near future. For starters, the bulls need to regain control and test the next level of resistance before the situation stabilizes.

HTX DAO’s [HTX] trajectory turns bearish 

HTX DAO [HTX] recorded the second-largest loss on the weekly loser chart this week, registering a 1.5% correction. Although the adjustment is relatively modest, it could prompt a more significant sell-off, particularly given that HTX has broken below the tight consolidation pattern. 

This development indicates that the bulls are losing control over the price action. Most crucially, RSI is also declining, albeit remaining well above the oversold threshold. This bearish momentum could propel the HTX price to the next support level if the buying interest fails to emerge soon enough.

In conclusion, there are plenty of reasons for concern among HTX holders. The combination of a bearish breakout and RSI contraction suggests that the bears may soon send the price lower.

MemeCore [M] continues to consolidate

MemeCore [M] emerged as the third-biggest loser this week, with a minor 1% correction. Unlike HTX’s bearish structure, M has shown more resilience, with price action staying range-bound around the $1 level.

In this setup, the RSI being in the oversold zone could actually be a positive sign. The fact that bulls are still stepping in around the range-bottom area suggests buyers are defending this zone, rather than allowing the correction to deepen.

If this trend holds, M could continue consolidating around the $1 support before making its next move.

Other notable losers

In the broader market, the downtrend was dominant.

Audiera (BEAT) was the biggest loser with a drop of 65%, followed by Humanity (H) down 59% and Secret (SCRT) shedding 40% as traders rapidly unwound their positions.

Conclusion

This week was a rollercoaster. Big pumps, sharp dips, and nonstop action. As always, stay sharp, do your own research, and trade smart.


Final Summary

  • Ethena [ENA], Pump.fun [PUMP], and PEPE [Pepe] led the week in gains.

  • World Liberty Financial [WLFI], HTX DAO [HTX],  and Memecore [M] saw significant declines.


Source link

The next big oil trade may have nothing to do with oil stocks

0
The next big oil trade may have nothing to do with oil stocks


Consumers typically encounter oil pricing in one apparent place: at the gas pump.

And rarely does it end there.

Oil and natural gas are the building blocks of plastics, paints, varnishes, fertilizers, and countless other things that Americans see and use every day. That link has taken on added significance as warfare around Iran has hindered shipments through the Strait of Hormuz.

A new Bank of America note finds that oil prices are now explaining a fairly big share of daily fluctuations in several chemical equities.

For LyondellBasell Industries (LYB), Dow (DOW) and CF Industries (CF), roughly 35% of daily share-price variation has been statistically tied to crude since the conflict intensified, up from about 12% beforehand. For LyondellBasell, the figure reached 40%.

That’s not just Wall Street statistical mumbo jumbo.

The U.S. Energy Information Administration said 20.9 million barrels a day of oil and petroleum liquids traveled through Hormuz in the first half of 2025, or nearly 20% of global petroleum consumption and a quarter of global seaborne oil trade.

When that artery is pinched, the ripple can affect everything from a gallon of paint to the plastic wrap over food.

The Strait of Hormuz disruption changed the oil equation

It is difficult to overestimate the scale of this year’s disruption.

Hormuz oil flows averaged barely 4.9 million barrels per day in the second quarter of 2026, down from 21.6 million barrels per day in the fourth quarter of 2025, the EIA said.

That helped push crude prices considerably up and made them much more volatile.

Brent crude hit $105 a barrel on July 23 as attacks on tankers resumed and supplies through Hormuz fell, the EIA reported.

Higher oil prices aren’t necessarily a bad thing for makers of commodity chemicals.

U.S. firms are more reliant on comparatively low-cost natural gas liquids as raw materials, whereas many foreign companies are more dependent on oil-linked inputs. When the price of crude rises, the global cost curve can shift in favor of U.S. producers.

That’s one reason BofA found LyondellBasell’s post-conflict correlation with oil went from 0.38 to 0.63, Dow’s from 0.32 to 0.58.

More Oil & Gas:

On days when crude swings more than 2%, oil could account for over half of LyondellBasell’s stock fluctuations, BofA found.

Paint stocks are reacting in the opposite direction

Paint may be the more intriguing consumer tale.

Before the Hormuz disruption, oil prices explained less than 1% of daily moves in Sherwin-Williams (SHW), according to BofA.

Then that number rose up to about 39%, and the link was really negative.

Why?

Paint producers purchase solvents, resins, and other petroleum-derived ingredients. Oil prices are rising, but it takes time to raise prices when companies’ costs are rising.

Such conditions can momentarily squeeze margins.

The pattern has also appeared in PPG Industries (PPG), RPM International (RPM), Axalta Coating Systems (AXTA) and Ecolab (ECL).

And the raw-material link is no longer hypothetical.

S&P Global says the Middle East accounts for roughly 15% of global polyethylene capacity and 9% of polypropylene capacity. At the beginning of the conflict, the disturbances in Hormuz led to delays in the polymer and much higher freight prices.

Polyethylene is everywhere: in bottles, packaging, pipes, household goods, and industrial materials.

And that’s how a disruption in an oil market thousands of miles away may ripple through to ordinary products.

Oil is suddenly driving companies that barely look like oil playsImages By Tang Ming Tung / Getty Images

China helped prevent an even bigger plastics crunch

The supply shock has not yet been as bad as predicted.

BofA believes Chinese polyethylene inventories are down by about 26% from usual early August levels as the country drew on stockpiled material to help maintain production and markets were fed.

The broader energy figures show a similar picture.

In the second quarter, China’s crude imports fell to 8.1 million barrels a day, a 32% decline from the previous quarter, the EIA said. Imports in May and June fell below 8 million barrels a day for the first time since 2016.

U.S. producers, however, stepped in to fill the gap.

US exports of crude oil and petroleum products touched a record 13.6 million barrels a day in April, up 15% from the previous high just a month earlier.

The same phenomenon also occurred in plastics.

S&P Global said bookings for U.S. resin exports rose as Middle Eastern supplies were less accessible, with daily bookings hitting 6,191 on March 16 vs. the more typical 3,500-to-4,500 range earlier in 2026. U.S. resin exporters get boost from disruption.

BofA sees opportunity in 4 stocks getting caught in the oil trade

This is where it gets more interesting for investors.

BofA does not see today’s raw-material inflation as necessarily systemic.

In three months, the bank’s investigation found its coatings companies were able to pass through about 90% or more of inflation through price.

Its latest raw-material model also leads to around 6% year-over-year inflation in the second half, below its earlier 7.6% forecast.

That might be a formidable mix.

If raw-material inflation continues to ease and price increases already put in by paint and coatings industries stick, margins could improve sooner than anticipated.

BofA’s preferred stocks in the oil-driven selloff

  • Axalta: Buy; $42 price objective versus $36.11 in BofA’s report.

  • Ecolab: Buy; $342 objective versus $275.84.

  • PPG Industries: Buy; $137 objective versus $113.44.

  • RPM International: Buy; $130 objective versus $112.23.

There is still a lot of risk.

Hormuz is not a conventional shipping waterway that could just be substituted. The EIA believes that Saudi Arabian and UAE pipelines together can transit the strait with around 4.7 million barrels per day of capacity, just a tenth of average Hormuz flows.

Reuters also reported this week that real oil flows are still severely affected, with shipments recently running at approximately 8 million barrels per day, compared with more than 20 million before the fighting.

But that’s what makes BofA’s finding unusual, too.

Despite some companies effectively passing on higher costs to clients and underlying chemical prices retreating from their early-conflict levels, oil is having a huge impact on chemical and coatings equities.

For consumers the effect may eventually show up as yet another price hike on paint, plastics or household products.

For investors, the more intriguing possibility is the opposite:

Some stocks may already be pricing in more oil pain than their businesses ultimately have to absorb.

Related: The Red Sea just got more dangerous for Saudi oil

This story was originally published by TheStreet on Aug 23, 2026, where it first appeared in the Economy section. Add TheStreet as a Preferred Source by clicking here.


Source link

If a Bear Market Is Coming, Here’s What All of the Smartest Investors Are Doing Right Now

0
If a Bear Market Is Coming, Here's What All of the Smartest Investors Are Doing Right Now


With great certainty, I can say there will be a bear market. What I can’t tell you is when, though I expect one sooner than later. Right now, with the market trading near all-time highs, investors appear to be shrugging off a lot of bad news. Even JPMorgan Chase (NYSE: JPM) CEO Jamie Dimon has been offering warnings about the increasing risk of a downturn, so I’m not going out on a limb here. But if there is a bear market ahead, now or in a more distant future, the smartest investors prepare before the inevitable downturn.

Fear is your biggest enemy

I’ve lived through numerous bear markets, including the very deep dot-com crash and the Great Recession, when there were legitimate concerns about the stability of the global financial system. When stock prices fall day after day, week after week, month after month, and year after year, it is hard not to panic. You are watching your wealth slip away little by little and, at some point, you feel like you need to stop the bleeding before you lose it all.

Missed Nvidia in 2009? This Rare Signal Is Flashing Again. In 2009, a “Double Down” signal flashed for a little-known chipmaker called Nvidia. For the first time in years, that same “Total Conviction” signal is flashing for a company 1/100th the size of Nvidia. Continue »

Image source: Getty Images.

There are no free lunches on Wall Street, as the old saying goes. You have to take the good with the bad. And bear markets are part of that story, but, historically, they’ve always been followed by new bull markets. You may feel like the bleeding will never stop, but history says it will. And that the market will eventually post even higher highs.

^SPX Chart
^SPX data by YCharts

So the big thing you need to do is remember the history, so you have the wherewithal not to panic and follow the crowd. A really simple approach is to buy a low-cost S&P 500 index fund, such as Vanguard S&P 500 ETF (NYSEMKT: VOO) and its 0.03% expense ratio, and just keep buying. Right through the downturn, as well, since you’ll be able to buy more shares of the exchange-traded fund (ETF) while they are cheap. That’s known as dollar-cost averaging, and it can be a very powerful wealth-creation tool.

Step back on the risk

Another smart move is to reduce the risks you are carrying if you prefer to buy individual stocks. For example, you could trim your stake in a high-flying technology stock like Nvidia (NASDAQ: NVDA) and use the proceeds to diversify into a boring consumer-staples Dividend King like Procter & Gamble (NYSE: PG) or a utility Dividend King like Black Hills (NYSE: BKH). With over 50 annual dividend increases, these companies have proven that their reliable businesses can survive tough times. And you can watch your dividend checks roll in instead of focusing on the falling market.

Should you buy stock in Vanguard S&P 500 ETF right now?

Before you buy stock in Vanguard S&P 500 ETF, consider this:

The Motley Fool Stock Advisor analyst team just identified what they believe are the 10 best stocks for investors to buy now… and Vanguard S&P 500 ETF wasn’t one of them. The 10 stocks that made the cut could produce monster returns in the coming years.

Consider when Netflix made this list on December 17, 2004… if you invested $1,000 at the time of our recommendation, you’d have $429,223!* Or when Nvidia made this list on April 15, 2005… if you invested $1,000 at the time of our recommendation, you’d have $1,317,883!*

Now, it’s worth noting Stock Advisor’s total average return is 965% — a market-crushing outperformance compared to 212% for the S&P 500. Don’t miss the latest top 10 list, available with Stock Advisor, and join an investing community built by individual investors for individual investors.

See the 10 stocks »

*Stock Advisor returns as of August 23, 2026.

JPMorgan Chase is an advertising partner of Motley Fool Money. Reuben Gregg Brewer has positions in Black Hills and Procter & Gamble. The Motley Fool has positions in and recommends JPMorgan Chase, Nvidia, and Vanguard S&P 500 ETF. The Motley Fool has a disclosure policy.

If a Bear Market Is Coming, Here’s What All of the Smartest Investors Are Doing Right Now was originally published by The Motley Fool


Source link

Nike to Host NYC Race Where Winners Receive ‘1 Month of Free Rent’

0
Nike to Host NYC Race Where Winners Receive '1 Month of Free Rent'


It might be possible to outrun your next rent payment — if you live with roommates.

Nike is offering a unique — and highly relevant — prize to two winners of a street race in New York City on August 29: “1 month of free rent.”

“Step to the starting line on Orchard Street for a chance to win one month of rent paid,” the company says.

Participants, who will be chosen by a random drawing, will race in a series of 100-meter dashes, advancing through an undisclosed number of heats before racing in a final round.

At the end of it all, the two fastest participants will each earn up to $4,000, which Nike is marketing as enough for a month’s rent.

For many New Yorkers, though, that might not cover it.

The median Manhattan rental price for a market-rate apartment, where the race is set to occur, soared to $5,000 last month, according to an August report from The Real Deal and appraisal firm Samuel Miller.

Should the winners of the races hail from Queens or Brooklyn, the $4,000 prize will likely be enough, but not by much. According to data from Apartments.com, the average rent for a one-bedroom in Queens is $3,605. In Brooklyn, it’s $3,082.

Mayor Zohran Mamdani has made lowering the city’s astronomical housing costs a centerpiece of his administration. His signature rent freeze for roughly 1 million rent-stabilized apartments takes effect this fall, while City Hall is pursuing a broader plan to build and preserve 200,000 affordable homes over the next decade.

Representatives for Mamdani did not immediately respond to a request for comment Sunday.

The race comes as Nike tries to recapture some of the cultural cachet it’s lost in recent years. CEO Elliott Hill, a Nike veteran who returned to lead the company in 2024, has been working to refocus the brand on sports, rebuild relationships with retailers, and revive product innovation after years of losing ground to competitors like Hoka and On.

The turnaround has shown signs of progress in North America, but it’s been slow going. Nike’s shares remain well below their 2021 peak, while weakness in China and other challenges continue to weigh on the company.


Source link

LayerZero price reclaims $1 – But ZRO’s 14% rally faces THIS test

0
LayerZero price reclaims $1 - But ZRO’s 14% rally faces THIS test


LayerZero’s [ZRO] price surged by 14.42%, as trading volumes picked up, further bolstering demand as ZRO closed in on the $1.20 key resistance level. At the time of writing, ZRO was trading around $1.16, and volume rose 15.46% to about $115.9 million. 

The simultaneous increases in price and volume strengthened the recovery’s participation profile during the latest price rally. Buyers, therefore, supported the move with expanding activity rather than relying solely on the thin-market price appreciation.

More importantly, the volume surge coincided with the highest movement of ZRO off its recent lower trading range. This participation helped to expand market participation as price neared the technically significant zones. 

Rising leverage adds fuel to ZRO

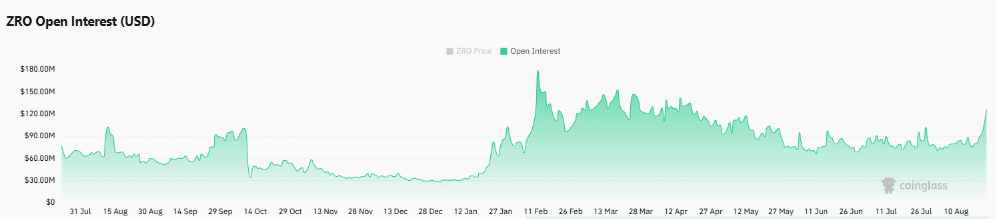
Derivatives traders increased their exposure as ZRO rallied, with Open Interest (OI) climbing 15.75% to $126.33 million at press time. 

The rise mirrored a token’s price rally and also brought leveraged involvement behind the recovery. Fresh positioning, therefore, accompanied the rally rather than declining as traders reduced their  exposure. 

Historically, a rising OI during rising prices generally strengthens the bullish derivatives backdrop across the provided data. Moreover, with increasing leverage, the markets become more sensitive to price reversals.

A sharp rejection may cause leveraged traders to rethink their positions taken in the most recent expansion. Currently, however, increased participation is in line with the overall recovery process. 

Therefore, continued OI expansion alongside stable prices would keep derivatives support firmly behind ZRO’s recovery attempt.

Source: CoinGlass

Top traders lean heavily toward longs

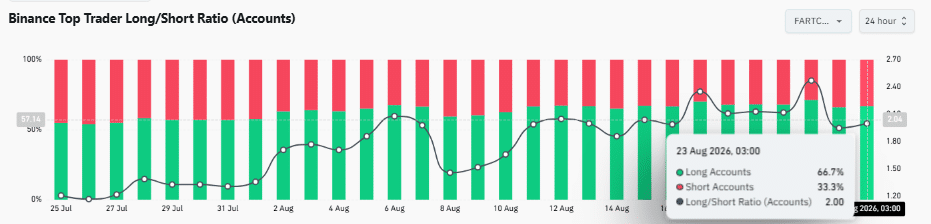
Binance top traders added to the bullish sentiment by showing a clear bias towards long positions. Among the traders tracked, 79.75% were long and 20.25% were short as of writing.

The Long/Short Ratio extended to 3.94, indicating significant bullish sentiment. Such positioning also supported the rising OI while providing a solid derivatives base for ZRO’s 14% gains. 

However, the heavy, long concentration introduced another consideration as the price extended sharply higher. When buyers lose the upper hand in the current advance, crowded positioning could add risk to the downside. 

However, traders kept a clear bullish stance, and did not sell off during the rally. Hence, positioning in derivatives was supportive, but further gains would become more dependent on price confirmation of their conviction.

Source: CoinGlass

Channel breakout changes ZRO’s technical picture

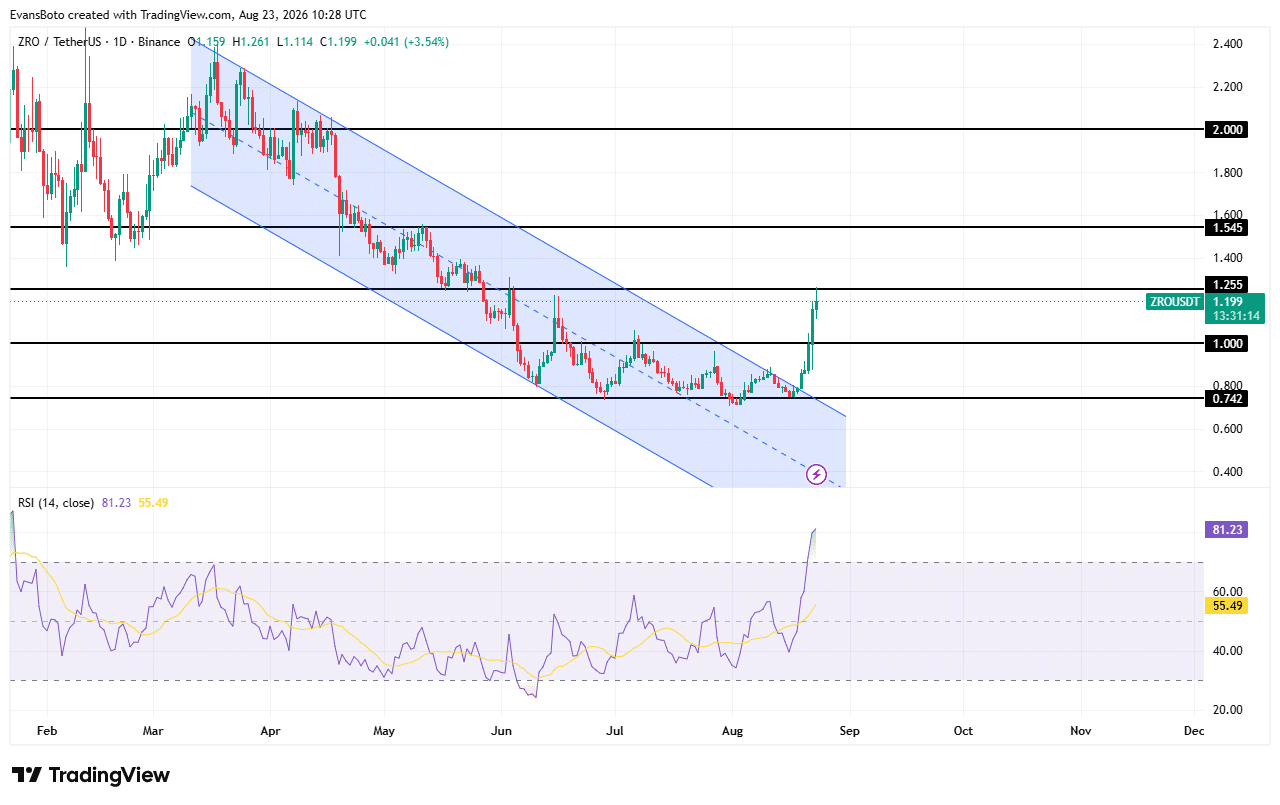
ZRO’s price structure delivered the clearest confirmation after breaking above the descending channel that had guided its prolonged decline since March. 

The price also broke back above the $1.00 level, marking a previous resistance point as a support level. The breakout pushed ZRO higher to $1.255, the immediate resistance level on the daily timeframe chart. 

Beyond there, the $1.545 level represents another significant area of action before the larger $2.00 supply zone. Notably, the RSI, however, had already surged to 81.23, indicating the indicator was well inside the overbought zone.

The high reading raised the likelihood of exhaustion in the near future after the breakout. Still, overbought conditions alone cannot invalidate the newly improved technical price structure. 

Holding above the $1.00 support level would preserve the breakout, while $1.255 would determine whether buyers could extend the recovery further.

ZRO price actionZRO price action
Source: TradingView

Final Summary 

  • ZRO’s channel breakout strengthened its recovery as trading and leveraged participation expanded.
  • Overbought RSI raises pullback risks, but $1.00 remains crucial for the breakout.


Source link