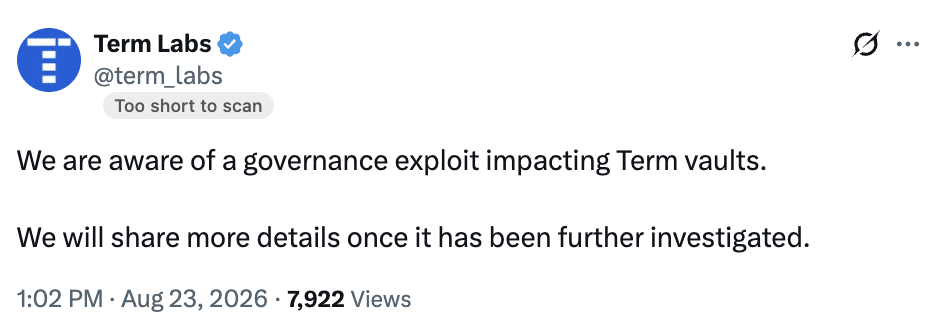
Another day and yet another blow to crypto security. On the 23rd of August, Term Finance, a DeFi lending & borrowing protocol on Ethereum [ETH], was attacked.
Rather than directly breaking into the protocol through a smart contract bug, the illicit actor took advantage of the weakness in Term Finance’s DAO governance system.
Source: Term Finance/X
How did the hacker drain millions in ETH?
A relatively small amount of Term’s governance token was actively available in the market. Using this as an opportunity, the wrongdoer bought a large enough portion of the governance tokens at a low cost to gain majority voting power.
Soon after the attacker got enough votes for approval, they simply went ahead and submitted and approved malicious governance proposals. This, in turn, gave the attacker control over Term Finance’s vaults, which hold users’ assets.
But before that, the attacker reportedly funded the operation with 2 ETH sourced through Tornado Cash. This caused a drain of approximately $8.5 million from Ethereum. 2,843 ETH, worth $6.87 million, alongside 1.68 million USDC were compromised. The attacker swapped those tokens for roughly 1.68 million DAI.
2026 becomes the worst year for Ethereum
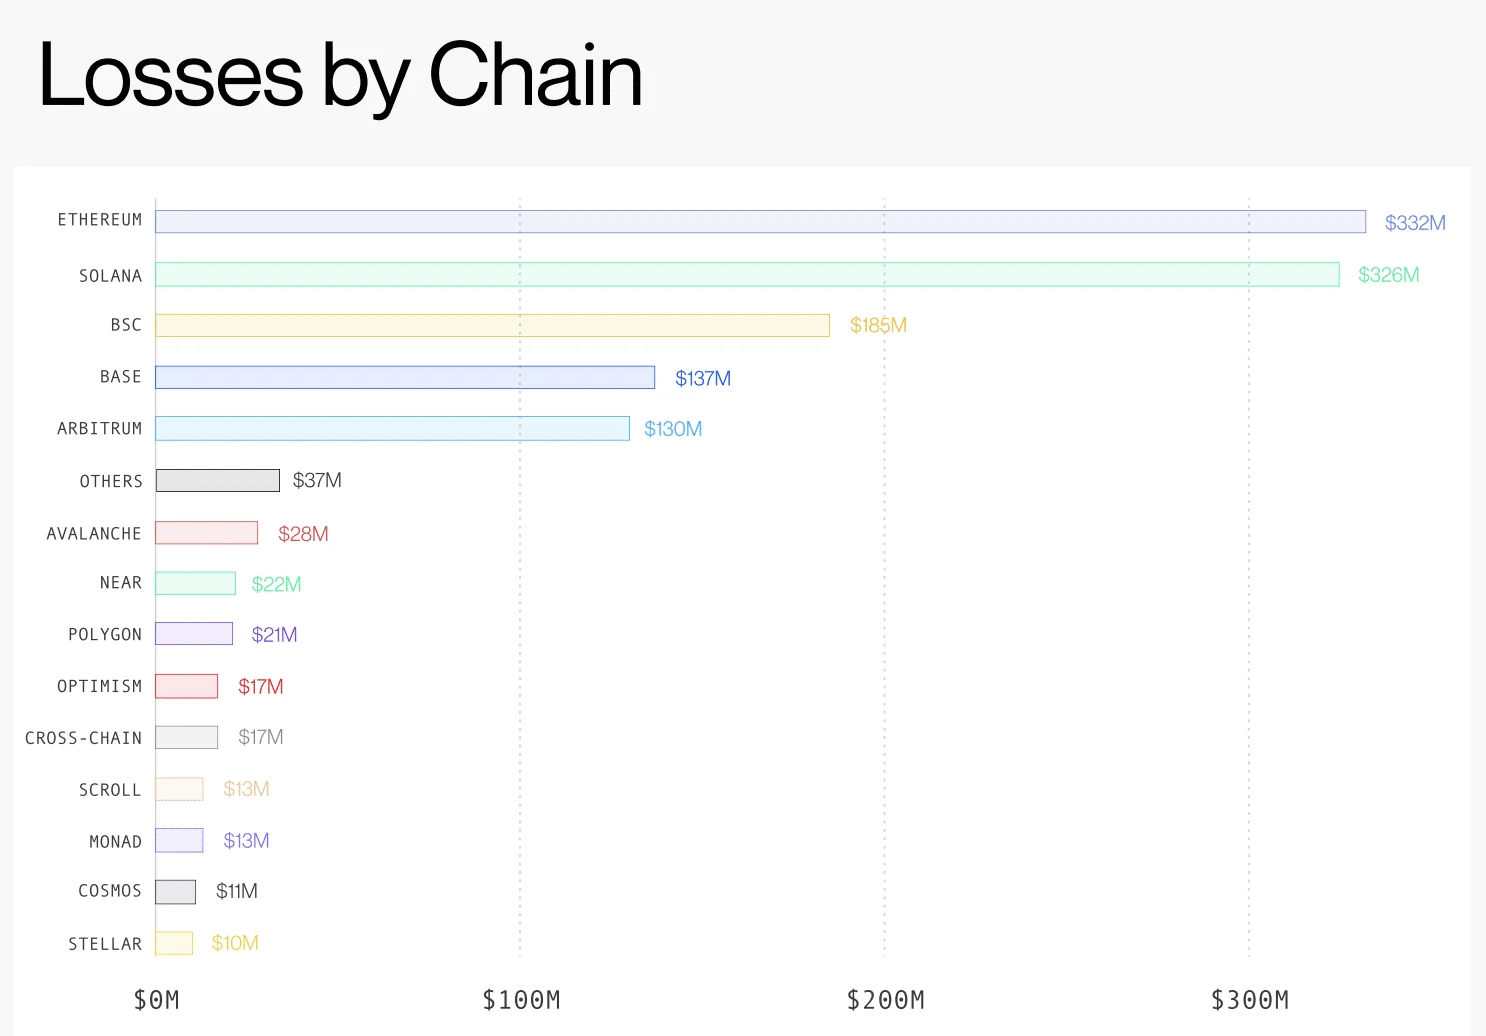
A recent security report from Blockaid uncovered that in H1 2026, crypto theft and fraud losses exceeded $1 billion. Wherein, Ethereum accounted for the largest share of losses, worth approximately $332 million.
Source: Blockaid
Ethereum’s losses were largely driven by smart contract and application-layer exploits, including vulnerabilities in bridges, privileged accounts, and protocol logic.
ETH was not spared
This was in line with AMBCrypto’s recent report on the Verus-Ethereum Bridge hack, which was attacked for the second time in July, with attackers draining approximately $7.54 million.
Back in May, nearly $11.58 million was compromised in a similar attack. This repeated attack has further raised questions about whether the earlier vulnerability was fully fixed.
All this happened as the price of Ethereum, which was trading around $4k in the middle of January, was down to $2412 at press time.
In a year, ETH has declined by 48.9% as per CoinGecko’s yearly data, thanks to attacks, regulatory uncertainty, geopolitical tensions, Fed rate cuts, and a lot more.
Final Summary
The offender bought a large enough portion of the governance tokens at a low cost and got access to majority voting power.
In H1 2026, Ethereum accounted for the largest share of funds lost in crypto frauds, with $332 million.
Just a few years ago, most people may not have even known what a natural gas power turbine was, or what they’re used for. Today, investors keeping tabs on the artificial intelligence (AI) revolution are almost certainly familiar with them, and the AI industry’s lack of them.
See, gas turbines generate onsite electricity that AI data centers need, but utility companies aren’t in a position to deliver. Anywhere from the size of a delivery truck to a train car, these massive machines can put out watts to power a small city, or — obviously — an AI data center. They just need a supply of natural gas, which is now proving easier to get than an institutional-scale hookup to a power grid.
Missed Nvidia in 2009? This Rare Signal Is Flashing Again. In 2009, a “Double Down” signal flashed for a little-known chipmaker called Nvidia. For the first time in years, that same “Total Conviction” signal is flashing for a company 1/100th the size of Nvidia. Continue »
And the AI industry is most definitely embracing the solution. Although the majority of them aren’t yet operational, BloombergNEF reports that there are nearly 100 data centers with, or building, on-site natural gas turbine power infrastructure. Although they come with a higher upfront cost, owners/operators like their long-term cost-effectiveness and the self-sufficiency they enable. To this end, PwC expect the AI industry’s consumption of natural gas to more than quintuple by 2035, with power turbines accounting for much of this growth.
Image source: Getty Images.
There’s just one not-so-small problem with the idea. That is, with demand greatly exceeding supply, prices of natural gas power turbines are soaring. As energy industry consulting and research firm Wood Mackenzie noted earlier this year, by the end of next year, the per-kilowatt cost of gas-powered turbines could be 195% higher than where it was in 2019.
What’s frustrating for AI data center owners, however, is a boon for the few companies capable of making such heavy equipment. To this end, here’s a closer look at the publicly traded companies already cashing in on the craze and likely to continue doing so for at least several more years.
Stocks being driven higher by insatiable demand for natural gas power turbines
It’s not necessarily a complete list. It is, however, a look at the names leading the business, as well as at the pure-play natural gas turbine companies most accessible to investors.
GE Vernova
If there’s one single-best way to capitalize on the swell of demand for gas turbines, it’s GE Vernova (NYSE: GEV). Although GE Vernova makes everything from wind turbines to power grid solutions to hydropower equipment, natural gas power turbines for AI data centers are its leading profit center right now and for the foreseeable future. Last quarter’s organic revenue growth of 12% was led by 14% growth in the power division, which includes gas turbines.
That’s not huge, but it’s also not the whole story. This unit’s total orders jumped 134% year over year in Q2, beefing up its backlog by $13 billion, to $176 billion. For perspective, that’s more than four years’ worth of revenue at the company’s current level of annualized sales, and the backlog is sure to continue growing in the meantime.
Siemens Energy
While North America’s natural gas turbine needs are largely met by GE Vernova, Germany’s heavy equipment maker Siemens Energy (OTC: SMERY) (OTC: SMEGF) is its counterpart in Europe. Last quarter’s revenue was up 18.5% year over year largely thanks to AI data center demand.
Yet, this still only scratches the surface of the opportunity. While it delivered 6 gigawatts’ worth of gas-powered turbines during the three-month stretch, it received 15 gigawatts’ worth of new orders, growing its backlog to 69 gigawatts’ worth of gas-power equipment.
Mitsubishi Heavy Industries
Finally, add Japan’s Mitsubishi Heavy Industries (OTC: MHVYF) to the list of major, investment-worthy names in the natural gas power turbine industry.
Like Siemens and GE Vernova, it’s doing well enough right now, reporting revenue growth of 13.3% in its most recently completed quarter, with comparable growth in the cards for the remainder of the year. Also, like Siemens and GE Vernova, it’s still adding capacity to meet demand it can’t yet meet.
Don’t sweat Mitsubishi’s or Siemens’ OTC listings either, by the way. These aren’t micro caps or penny stocks that are frequently listed as OTC stocks. These are major companies with conventional exchange listings in their home countries. They’ve simply chosen to not pursue a conventional U.S. exchange listing due to the unjustified hassle or cost of doing so.
Honorable mentions
These aren’t the only names in the gas turbine business that are experiencing strong, AI-driven growth at this time, nor are they necessarily the biggest. They’re just the biggest direct beneficiaries of soaring turbine prices. Two other outfits are also worth a look, even if natural gas power turbines aren’t a major profit center for either right now.
Caterpillar
You likely know Caterpillar (NYSE: CAT) best as a maker of bulldozers and other heavy construction equipment, but you may also be aware that its conventional, diesel-powered generators are also now in use as a source of primary or secondary power for a few AI data centers. Perhaps most notably, Microsoft‘s planned Monarch Compute Campus in West Virginia will initially depend on Caterpillar’s G3500-series of natural gas generators for electricity. This is mostly just a stop-gap though. This facility will ultimately be powered by two gigawatts’ worth of Caterpillar-made — through its wholly owned subsidiary Solar Turbines — natural gas turbines, underscoring that the company is capable of competing outside of the construction arena.
To this end, a large share of last year’s 24% year-over-year sales growth was driven by data center demand.
Woodward
Finally, add Woodward (NASDAQ: WWD) to your list of stocks in the natural gas power turbine business that are benefiting from the rising price of this machinery. It could have earned a spot on the primary list alongside GE Vernova, Siemens, or Mitsubishi Heavy Industries, but the company’s reporting doesn’t offer as much transparency as most investors would like. All we know for sure is that Woodward serves the on-site power production market.
Nevertheless, investors willing to keep it on their watch list for a while or dig deeper into the company’s inner workings might eventually access some more specific information. In the meantime, GE Vernova arguably remains your best bet, on the notion that its rising price won’t actually crimp the artificial intelligence industry’s growing demand for natural-gas power turbines anytime soon.
Should you buy stock in GE Vernova right now?
Before you buy stock in GE Vernova, consider this:
The Motley Fool Stock Advisor analyst team just identified what they believe are the 10 best stocks for investors to buy now… and GE Vernova wasn’t one of them. The 10 stocks that made the cut could produce monster returns in the coming years.
Consider when Netflix made this list on December 17, 2004… if you invested $1,000 at the time of our recommendation, you’d have $429,223!* Or when Nvidia made this list on April 15, 2005… if you invested $1,000 at the time of our recommendation, you’d have $1,317,883!*
Now, it’s worth noting Stock Advisor’s total average return is 965% — a market-crushing outperformance compared to 212% for the S&P 500. Don’t miss the latest top 10 list, available with Stock Advisor, and join an investing community built by individual investors for individual investors.
James Brumley has no position in any of the stocks mentioned. The Motley Fool has positions in and recommends Caterpillar, GE Vernova, and Microsoft. The Motley Fool recommends Siemens Energy Ag. The Motley Fool has a disclosure policy.
FC Barcelona target Julian Alvarez has been heavily booed by Atletico Madrid fans at the Metropolitano, as shown by various videos posted on social media.
Getty Images
FC Barcelona target Julian Alvarez has been heavily booed by Atletico Madrid fans at the Metropolitano, as shown by various videos posted on social media.
Julian’s name and number were read out ahead of the Rojiblancos’ La Liga meeting with Villarreal, as the announcer ran through the team.
With the Argentine starting on the bench against the Yellow Submarine, the very mention of him saw what SPORT described as a “brutal booing”.
This is indeed a response to Julian’s open flirting with Barca. After reports in late May that he had accepted a five-year contract offer from the Catalans, Atleti have refused to negotiate a transfer of the player it signed from Manchester City in 2024.
At the World Cup where he reached the final with his country, Julian said that: “The truth is that I don’t know,” with regards to the future, when interviewed after Argentina’s group victory against Austria.
“I don’t think it’s the time to talk, but I can’t hide either. I try to be an honest person. I spoke to the people at the club, who I had to talk to. I think the best thing for everyone is a transfer and I want to fulfill my dream,” Alvarez added, with that dream believed to be a move to FC Barcelona.
There are reports that Atleti teammates are unhappy with Barcelona target Julian Alvarez
Before the Villarreal match, Carrusel Deportivo reported that in the Atleti locker room, Julian’s “usual beetroot face” is making his teammates uncomfortable.
“He apologized and said he would be professional with Atletico, but as the days go by, they see that his attitude doesn’t change,” the Spanish radio station added.
Also ahead of the game, Atleti President Enrique Cerezo goaded Barca by telling El Desmarque that “FC Barcelona has not risen to the occasion and has not done what it usually does in these cases,” in terms of landing Julian.
Yet many Culers question why Atletico would want to keep a player who doesn’t want to be at the club against his will, and who has now clearly lost the support of the Spanish capital outfit’s fervent fans.
With around a week until the market closes, maybe Sporting Director Deco will launch one last attempt to make a Julian Alvarez a Barcelona player considering Hansi Flick doesn’t have a striker at present other than young Hamza Abdelkarim.
Technical analysis with magnifying glass by Peshkov via iStock
Try not to look at the tickers of these two securities. Quick, tell me which one you’d prefer to invest in. Or, which one is clearly better.
www.barchart.com
You probably can’t. And that’s my point.
More News from Barchart
The chart above shows the iShares Semiconductor ETF (SOXX), the celebrated semiconductor ETF, alongside the ProShares Ultrapro QQQ ETF (TQQQ). TQQQ is the same as the Invesco QQQ Trust (QQQ), but with 3x daily leverage.
Why are these two ETFs moving so closely in sync?
Welcome to Correlation Nation. Get comfortable. You’re going to be here for a while. Maybe forever.
As markets head into the fall, the artificial intelligence narrative has completely sucked the air out of the room, forcing equity indexes into a high-volatility holding pattern. The euphoria surrounding AI mirrors the dot-com bubble. While the technology holds practical utility as a productivity assistant, corporate spending and equity valuations have reached levels that are structurally unsustainable.
That’s the fundamental narrative. My concern as an investor, and especially as a risk manager, is not fooling myself into thinking I own different return and risk tradeoffs, when in fact I don’t. That’s the downfall of many investors and traders.
Because as we see above, you can lever up QQQ by a factor of three, and get a return pattern that is nearly identical to that of SOXX, an unleveraged ETF that has a lot of volatile stocks in it.
www.barchart.com
SOXX and QQQ overlap, but only by about one-third. QQQ has 100 stocks and SOXX has 35. 17 of them are owned in both ETFs. So there’s plenty to separate them.
That helps account for why SOXX is more volatile than QQQ. But to replicate SOXX’s up and down, chaotic movement, all we need to do is take QQQ and triple its own price moves. For the past six months, there has been little daylight between them.
If this were the only such situation here in Correlation Nation, I wouldn’t be so worried. But it is far from an isolated incident. I have compared a wide range of currently “sexy” market segments and themes, from quantum computing to space exploration and others. My conclusion is that if thrills are what you want in 2026, you’re not going to get much added value beyond QQQ.
The real decision for traders is how much leverage do you want in your QQQ investing? While the math is not consistent over different time frames due to the quirks of leveraged ETFs (where a loss takes a much bigger subsequent gain to offset), the nature of today’s U.S. stock market is that you can get all the “beta” you want. But realize that in more cases than you’d expect, that’s all you are getting.
Just look at how cleanly this has worked over the past three years. TQQQ’s return is about 300%, QLD’s is 200%, and QQQ is “only” a double (100% gain). All’s well that ends well.
www.barchart.com
Until the cycle turns, at least. That’s when a lot of investors are bound to look at their portfolios, filled with seemingly different ETFs, and realize that their “allocation” was really a “correlation.” Sort of like saying “I’d like three different scoops of ice cream, please.” And you get three of the same. That’s great for dessert. But if you thought you were getting some variety, you haven’t.
That other way to think of this is just when you expect diversification to be that “free lunch of investing” we hear about, something else happens. You end up paying for everyone’s lunch in the whole restaurant. And the one next door too.
This is not about the companies or stocks themselves. They are all different entities. But we live in an era where algorithms and index funds roam the earth. That means that traditional differences between stocks and even industries get painted over by the “risk on vs. risk off” trade obsession.
That’s where we are. And to me, it makes me much more focused on how much QQQ exposure I have at any point in time, instead of how many different flavors of up and down moves I care to fill my portfolio with.
This is not something I figured out a long time ago. As I’ve written here before, I have seen a rise in correlation between stocks and sectors for a few years. But this summer, it has reached a fever pitch. That’s why I’m heading into autumn with a vow to myself to consolidate where I take risks.
Most tech stocks and AI-related themes are caught in the same web. That’s not bad news. The insight could save a lot of financial headaches as the stock market bull run gradually fades.
Rob Isbitts is a semi-retired CIO, former fiduciary investment advisor, and Barchart columnist. Check out his other work at ETFYourself.com (featuring the Fresh Charts weekly trading post), and ROAR.PiTrade.com, helping investors to better-manage their own portfolios.
On the date of publication, Rob Isbitts did not have (either directly or indirectly) positions in any of the securities mentioned in this article. All information and data in this article is solely for informational purposes. This article was originally published on Barchart.com
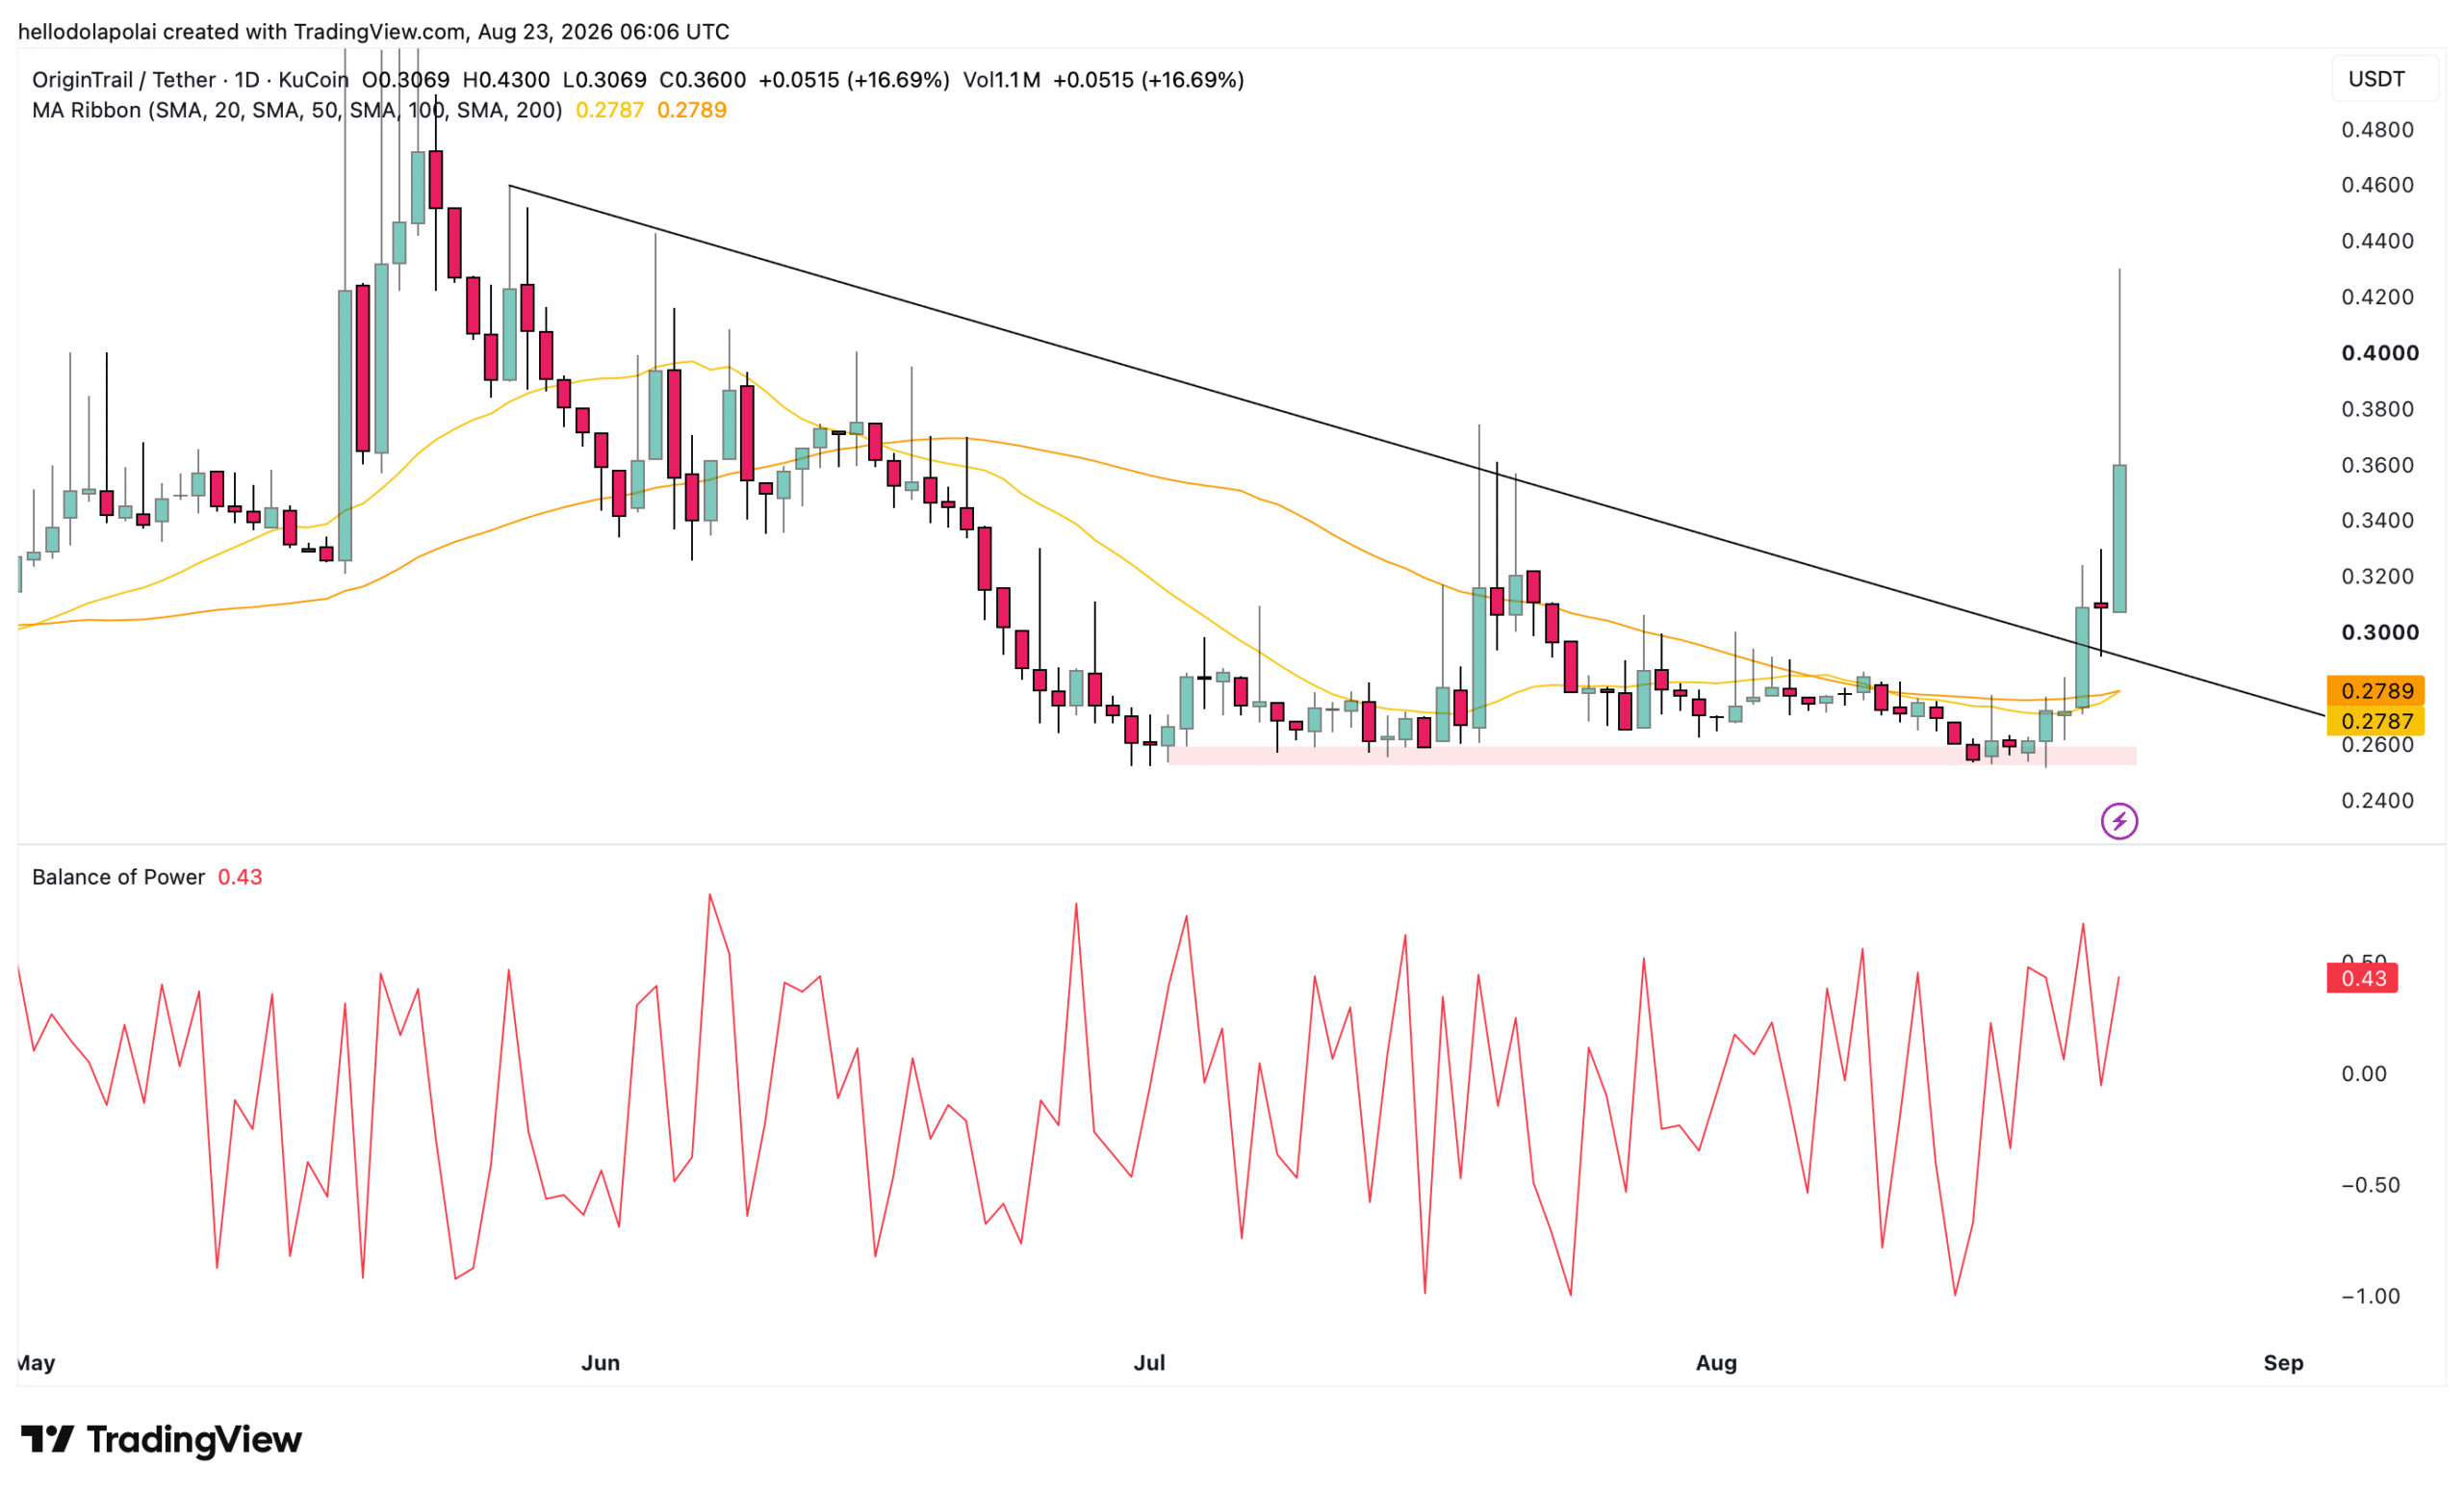
OriginTrail [TRAC] has continued to rally in the market, with a 15% gain, at press time. The rally follows a structural breakout from a descending resistance line on the chart, with the asset forming a new local high and reaching a level last seen around the 4th of June.
The breakout from this resistance level should typically lead the asset to form a high of $0.49, the starting point of the descending resistance line.
Source: TradingView
At the time of writing, the Moving Averages (MA) were about to form a bullish crossover on the chart. That’s when the 20 SMA trades above the 50 SMA on the chart, which historically tends to precede a rally.
In addition, there’s been a surge in the Balance of Power (BOP) indicator. The tool measures the relative strength of buyers and sellers to determine which side dominates the market.
When the reading is above 0, it often indicates that buyers have more strength, especially when it reads far above the 0 mark. At press time, TRAC had a BOP reading of 0.35 on its daily timeframe chart, confirming that buyers are still very much active.
Notably, however, buyer strength compared to the 21st of August has declined by nearly half, as it peaked at 0.67. For now, there’s still a good chance that TRAC maintains its bullish positioning and rallies in the near term.
Where the market stands
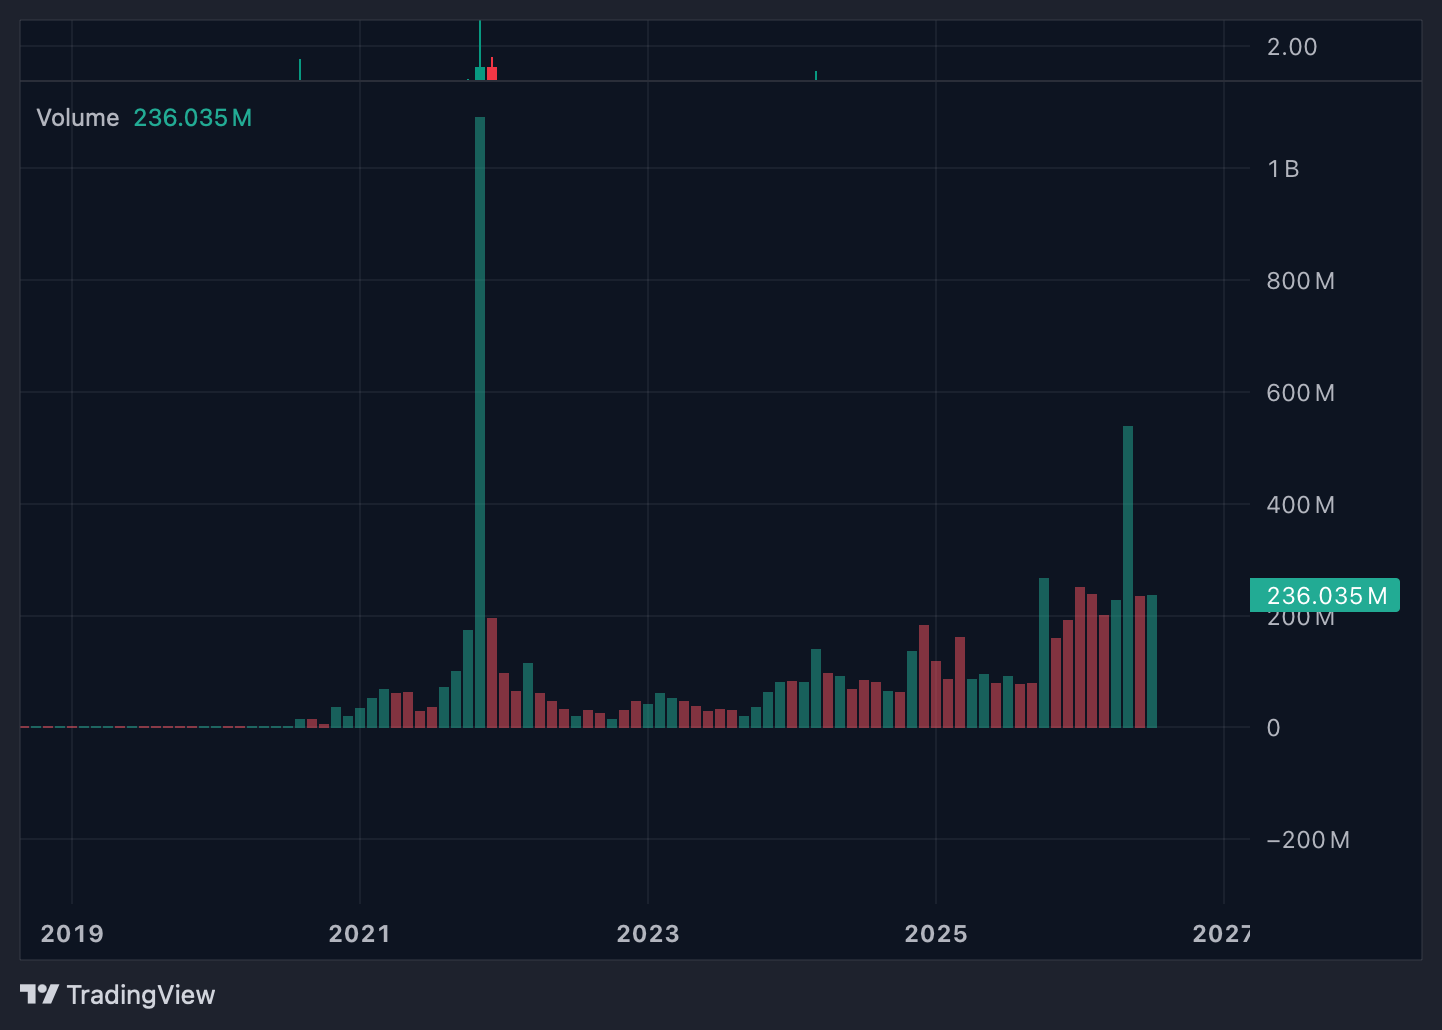
Market momentum remains heavily inclined toward supporting the buying outlook on the chart, based on volume analysis.
When volume rises alongside price, buyers typically remain active and continue positioning for further upside. Conversely, when volume is declining while price is up, it hints that there’s minimal buying backing the asset.
At press time, volume data on CoinMarketCap showed that TRAC’s trading volume increased by 580% over the last 24 hours, with roughly $35 million worth of the asset traded.
Source: TradingView
If this continues, there’s a high chance that TRAC makes a continued upward swing in price. In addition, TRAC has gained mindshare as market participants mention the asset more frequently across social media.
Mindshare was up slightly by 1.37% as it reached 1,370 posts from several market participants. If there’s a growing surge in mindshare, especially as the price is rallying, it could possibly influence other traders in the market to buy into the asset.
Community sentiment is bullish
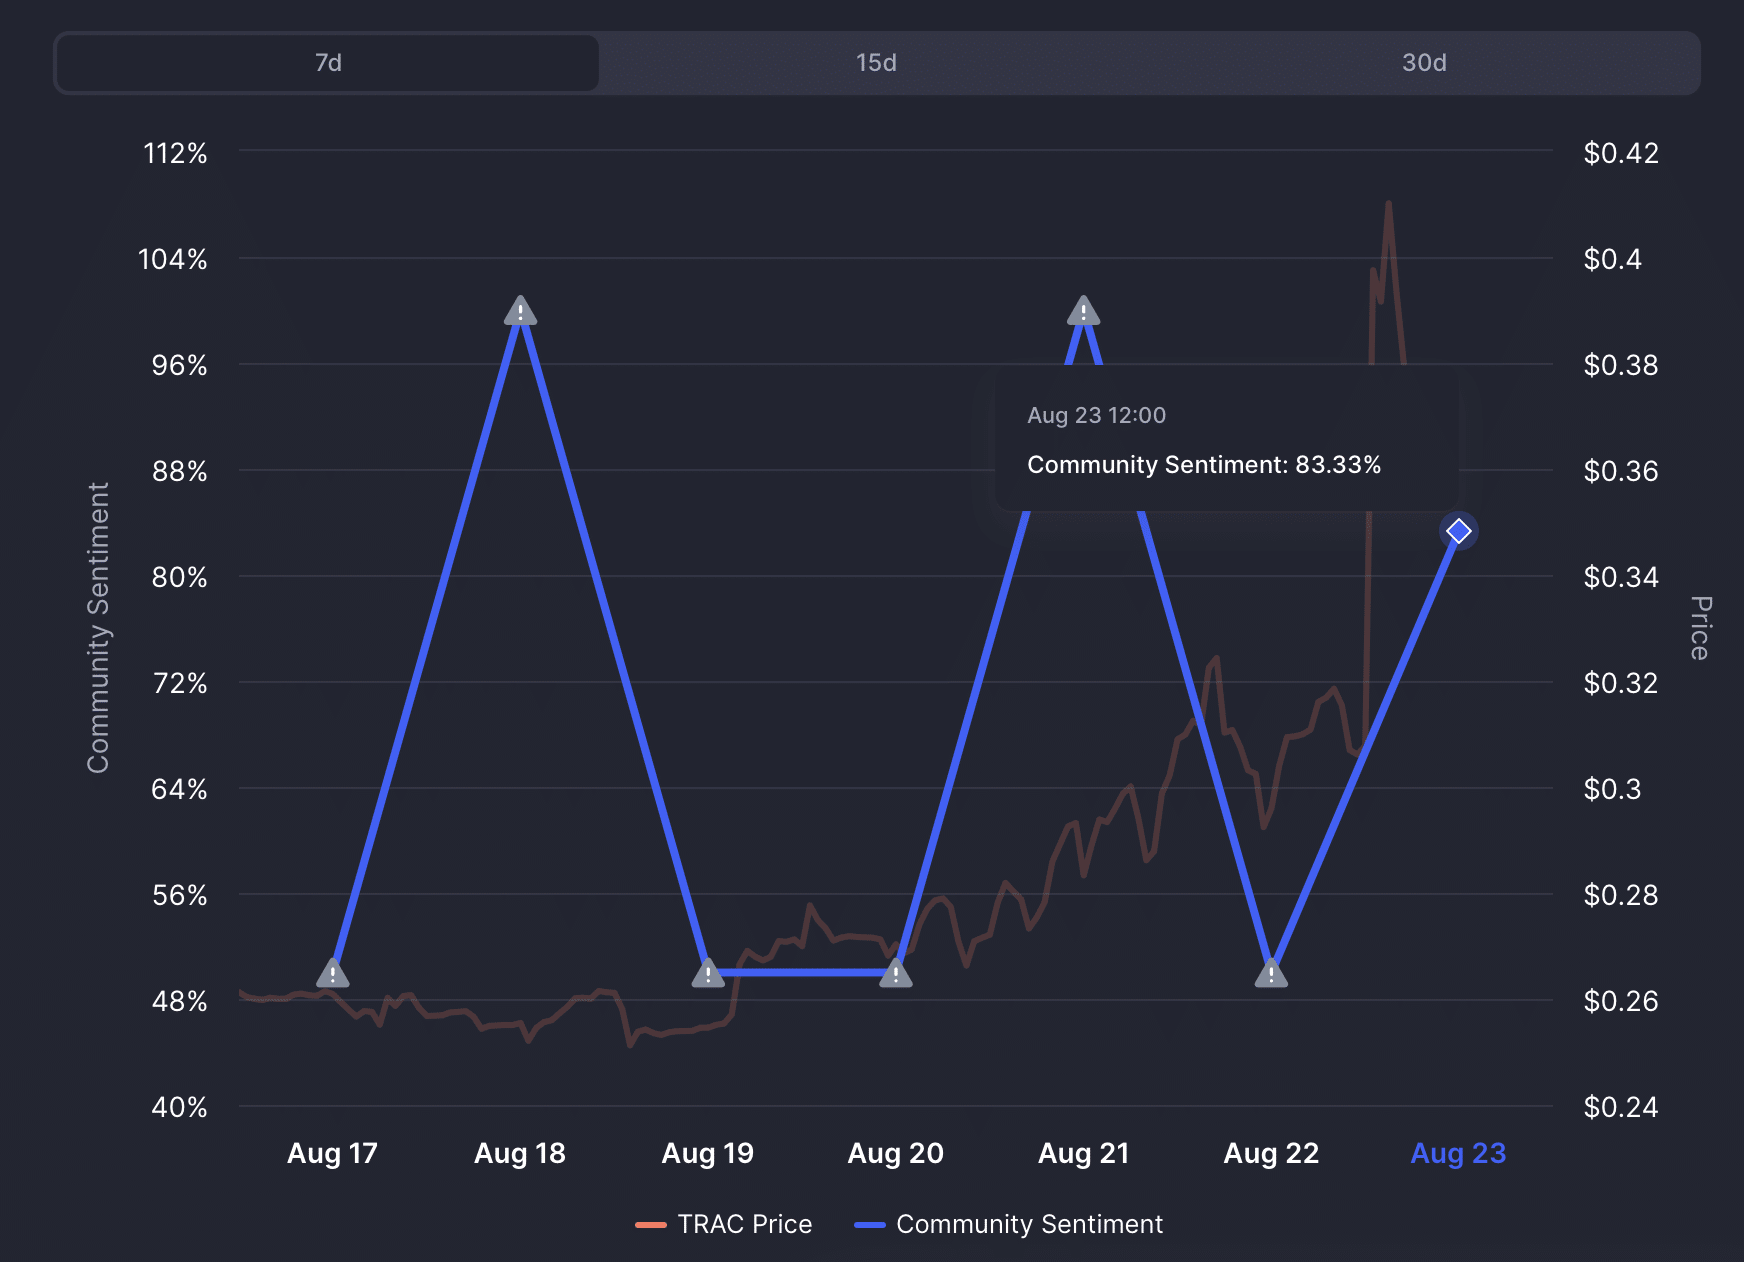
Community sentiment, which measures the relative strength of buyers and sellers based on market votes, shows a clear consensus that the market remains bullish.
Source: CoinMarketCap
The sentiment data, based on votes from 13,800 traders, shows that roughly 83% expect TRAC to maintain its bullish momentum.
Notably, this remains a sentiment-based view, and traders could change their outlook before that shift is reflected in the sentiment indicators.
Final Summary
TRAC’s rally has pushed price above a key descending resistance line, while the 20 and 50 SMAs approach a bullish crossover.
Rising volume and 83% bullish community sentiment support further upside, but weakening Balance of Power could limit momentum.
A close-up shot of Beyond Meat plant-based patties by BalkansCat Shutterstock_com via Shutterstock
Beyond Meat (BYND) investors are entering a critical new chapter after the company completed its 1-for-30 reverse stock split, with split-adjusted trading beginning Aug. 14. The move was primarily aimed at helping the plant-based meat maker regain compliance with Nasdaq’s $1 minimum bid-price requirement after a prolonged slide in its stock. Additionally, Beyond Meat needs to maintain a closing bid of at least $1 for 10 consecutive business days before the Aug. 31 deadline.
Each 30 pre-split shares were consolidated into one share, while Beyond Meat also reduced its authorized common shares from 3 billion to 100 million.
More News from Barchart
BYND remains a high-risk, high-volatility name, making post-split price action particularly important. Shares initially gained more than 10% on Aug. 14, closing at $13.47, but the stock subsequently faced renewed selling pressure.
Meanwhile, the reverse split does not change Beyond Meat’s underlying fundamentals. The company continues to face weak demand, declining revenue and significant financial pressure. Given this backdrop, it remains to be seen whether the stock can hold its post-split gains, regain Nasdaq compliance and, more importantly, whether management can stabilize the underlying business.
About Beyond Meat Stock
Beyond Meat is a plant-based food company focused on developing and selling meat alternatives made from plant-based proteins, including burgers, sausages, nuggets, and other products. The company is headquartered in El Segundo, California, where it operates its corporate, research, and innovation facilities. Following its recent 1-for-30 reverse stock split and sharp share-price volatility, the company’s market cap is now $241.9 million.
BYND has been under heavy pressure over the past year, reflecting a combination of weak demand, declining sales, and concerns about the company’s financial position. The stock is down 42.89% year-to-date (YTD) and 80.57% over the past 52 weeks. The decline has been driven by continued weakness in the plant-based meat category, with reduced distribution and softer consumer demand weighing on sales.
The stock’s collapse also pushed it below Nasdaq’s $1 minimum bid requirement, prompting the company to execute a 1-for-30 reverse stock split effective Aug. 14.
Volatility has remained extreme since the split. BYND jumped 10.32% on Aug. 14 to $13.47, plunged 13.66% on Aug. 17 to $11.63 and rebounded 9.54% on Aug. 18 to $12.74. With shares still 93.8% below their 52-week high, BYND remains firmly in speculative-trading territory.
www.barchart.com
The stock is currently trading at just 0.73 times sales, which is a discount compared to industry peers and its own historical average.
Weak Financial Standing
Beyond Meat reported its second-quarter 2026 financial results on Aug. 5, for the quarter ended June 27. Net revenue fell 8.2% year-over-year (YOY) to $68.8 million. U.S. foodservice revenue declined 27.6% to $8 million from $11.1 million, as product volume fell 27.4% amid weak category demand and fewer distribution points. International retail provided a bright spot, with revenue rising 16.5% to $18.5 million from $15.9 million, driven by stronger burger and chicken sales in Europe and the U.K. and higher ground-beef sales in Canada.
Profitability remained challenging. Gross profit declined to $5.9 million from $7.9 million, while gross margin contracted to 8.5% from 10.6%. The operating loss improved to $30.8 million from $37.5 million, narrowing the operating margin to -44.8% from -50.0%. However, adjusted EBITDA loss widened to $27.7 million from $24.7 million, with the margin deteriorating to -40.2% from -33.0%.
The company swung to $16.4 million of net income, versus a $31.8 million net loss in Q2 2025, primarily because of a $57.7 million non-cash gain on debt extinguishment related to conversions of its 2030 Notes. Its EPS was a $0.06 loss, compared with a $0.42 loss a year earlier. Cash and restricted cash totaled $186.1 million, while debt stood at $323.8 million at quarter-end. For the six months, operating cash burn improved substantially to $23.2 million from $58.0 million, while capital expenditures fell to $4.0 million from $6.4 million.
For the third quarter, management provided a limited outlook because of elevated uncertainty and volatility, forecasting net revenue of approximately $60 million to $65 million. The range implies another sequential decline from Q2 and highlights the continuing challenges facing the core plant-based meat business.
Analysts forecast loss per share to improve 90% YOY to $13.81 for fiscal 2026, followed by an 8.7% improvement to $12.61 in 2027.
What Do Analysts Expect for Beyond Meat Stock?
Overall, BYND has a consensus “Moderate Sell” rating. Of the six analysts covering the stock, three analysts are on the sidelines, giving it a “Hold” rating, and three recommend a “Strong Sell.”
BYND’s average analyst price target of $18.34 indicates an upside of 27.8%, while the Street-high target price of $30.03 suggests that the stock could rally as much as 109.3%.
www.barchart.com
www.barchart.com
On the date of publication, Subhasree Kar did not have (either directly or indirectly) positions in any of the securities mentioned in this article. All information and data in this article is solely for informational purposes. This article was originally published on Barchart.com
ASTER rallied heavily on the 21st of August, largely driven by market optimism over regulation around decentralized perpetuals exchanges. This was after Trump announced that the CFTC was working to bring Hyperliquid into the U.S. markets.
However, market conditions changed first amid the renewed trade war between the U.S. and Canada. As a result, the broader crypto market retraced.
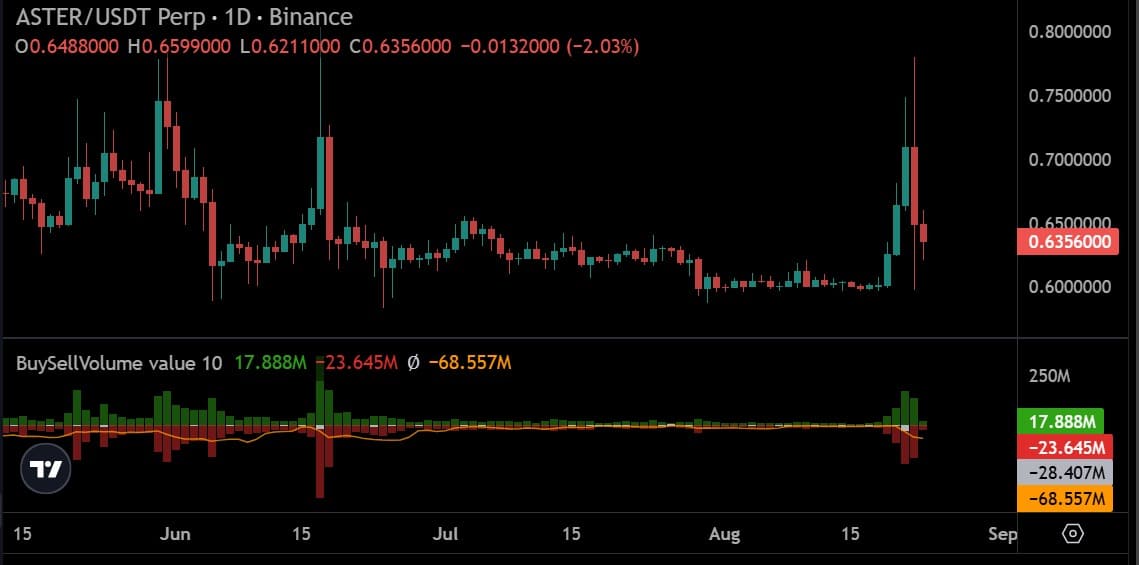
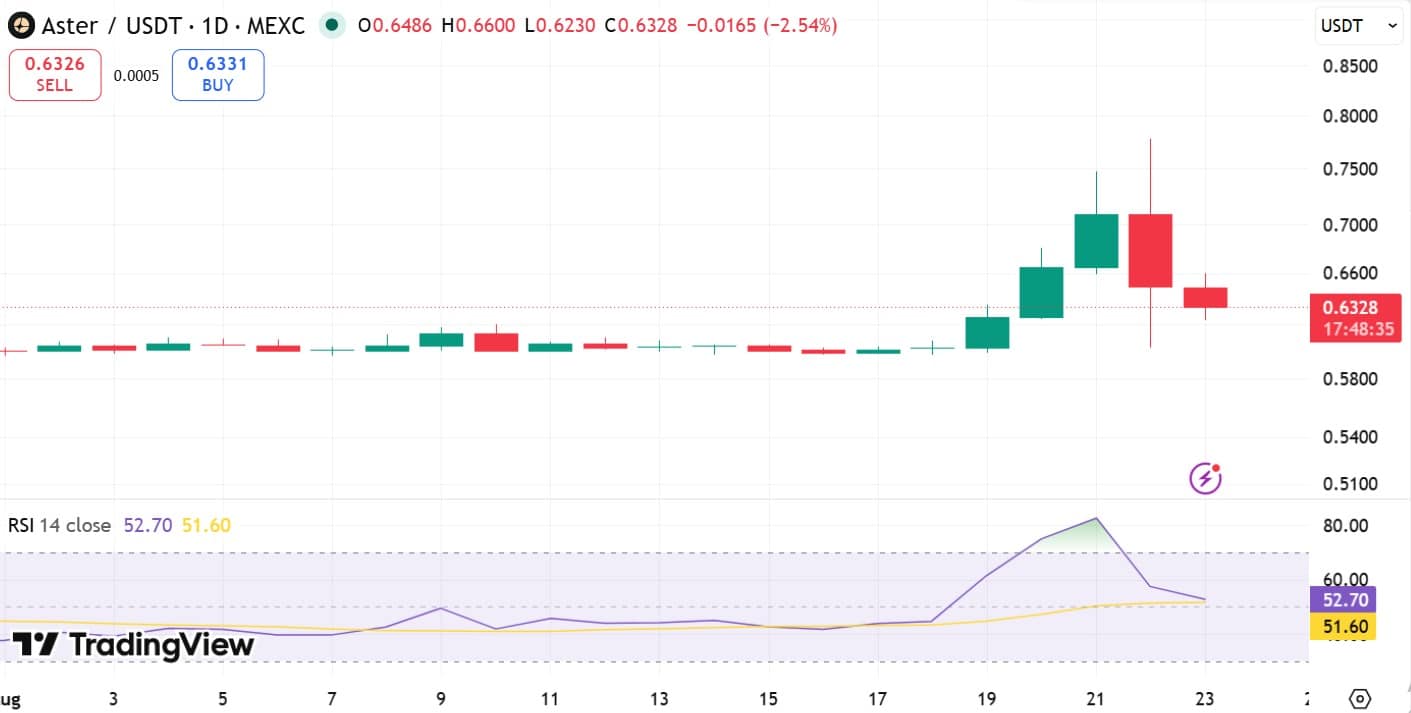
As the market retraced, ASTER fell from $0.77, breached the $0.7 support, plunging to a low of $0.61, marking a 15% drop before slightly rising.
As of this writing, ASTER traded at around $0.63, making an 8.3% drop on the daily charts. Over the same period, the altcoin’s trading volume dropped by 50%, indicating reduced market activity.
After ASTER dropped from the recent pump, traders who were anticipating continued rallies were forced out of the market.
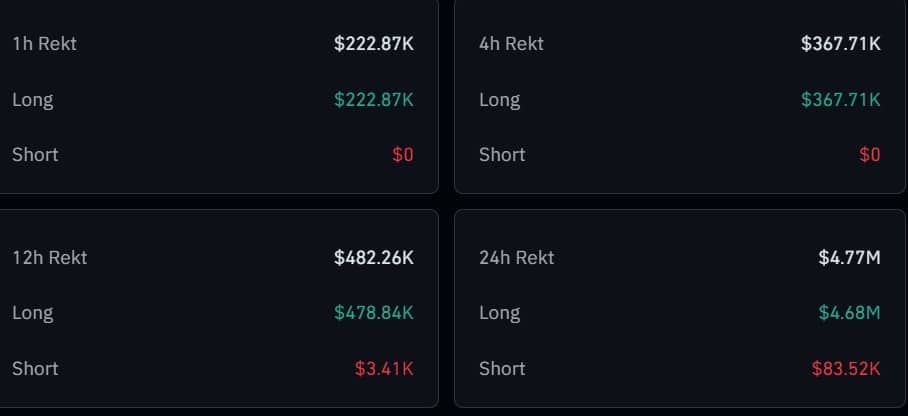
In fact, we saw long positions’ liquidations rise significantly. Over the past day, over $4.6 million worth of longs were liquidated.
Source: Coinglass
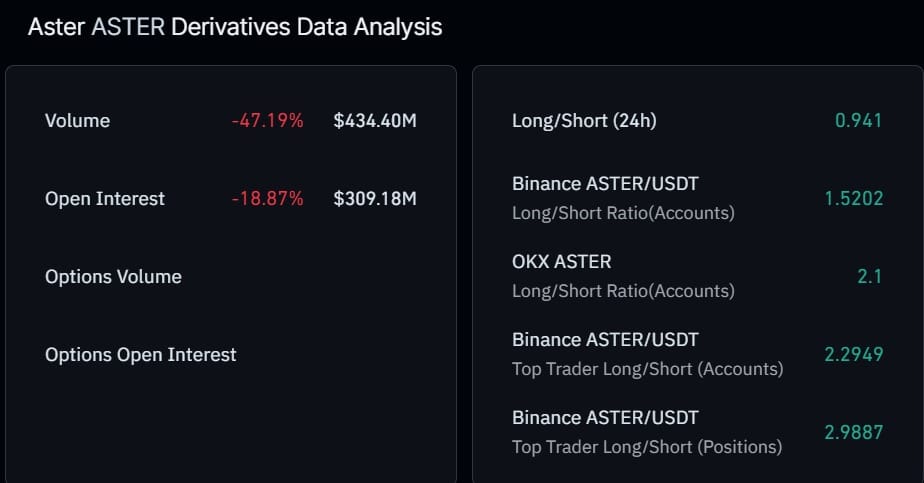
This long squeeze prompted other traders to hurriedly close their positions, fearing liquidation. According to CoinGlass data, ASTER’s Open Interest dropped by 18.8% to $309.1 million, while derivatives volume plunged by 47% to $434 million.
Source: CoinGlass
Dropping OI and volume in tandem suggested that traders were actively reducing exposure. These market exits look more prevalent upon gauging the perps and Futures outflows.
According to Coinalyze data, Perpetuals Sell Volume rose to 28 million while buy volume dropped to 17.8. As a result, Delta volume dropped to -10.2 million with net buying at -28 million, a clear sign of aggressive selling.
Source: Coinalyze
The same pattern emerged as Futures outflows rose to $80.4 million while inflows dropped to $66.6 million. The Netflow dropped to –13.76 million, further confirming this selling activity.
When derivative markets see such extreme selling pressure, it suggests that speculation has faded. Often when these traders exit the market, it tends to experience price shock, thus causing price drops.
Can the altcoin sustain the pressure?
With intense sell pressure, ASTER’s bullish momentum has weakened substantially. In fact, the altcoin’s Relative Strength Index (RSI) dropped to 54 from 87.
Source: Tradingview
The drop to these levels suggests a weakening market structure, with intense selling pressure. However, since it still holds above 50, it means that buyers are still active and sellers have yet to fully retake the market.
If the pressure continues, the RSI will drop below 50, which will confirm the bearish trend. In doing so, ASTER will drop below $0.6, with $0.59 as key support.
To invalidate this bearish outlook, the altcoin needs to have a daily close above $0.65.
Final Summary
ASTER fell from $0.77, breached the $0.7 support, plunging to a low of $0.61, marking a 15% drop before slightly rising.
ASTER declined as $4.6 million in long liquidations triggered a wave of panic exits across the derivatives market.